Economists Boost Inflation Expectations in Worrying Sign for Fed
The consumer price index will now average 5.7% in the final three months of the year, up from the 4.5% estimated a month ago, according to the median forecast of 72 economists in a Bloomberg survey. The chance of a recession over the next year also increased to 27.5% from 20% in March. The March CPI report will be released Tuesday. (…)
The Fed’s preferred gauge, the personal consumption expenditures price index, is anticipated to average 4.7% year-over-year in the final three months of the year, more than double the central bank’s 2% target. (…)
Average hourly earnings are expected to be higher than prior surveys showed, with the measure increasing by 5.6% and 5.3% from a year earlier in the second and third quarters, respectively, as businesses continue to boost wages to attract and retain workers.
(…) “The combination of overheating, followed by policy delay followed by supply shocks means I think it’s a very difficult set of challenges, and recession in the next couple of years is clearly more likely than not,” Summers told Bloomberg Television’s “Wall Street Week” with David Westin on Friday. “I suspect that’s how the consensus will evolve.” (…)
Summers also highlighted that the U.S. has never experienced inflation above 4% and unemployment below 4% without that being followed by an economic slump within two years. (…)
Turning to China, (…)
“Between exit from Covid, profound financial strains, internal issues around inequality, tension over state enterprises, China has real economic vulnerabilities,” Summers said. “What I’m fearful of is that those vulnerabilities will translate into hostile nationalist impulses as a way of holding the country together when the glue of rapidly growing prosperity starts to peel and flake off.”
- A “recession shock” is coming, BofA warns
- Rising consumer prices squeeze US consumers.
Nordea also discusses recession probabilities:
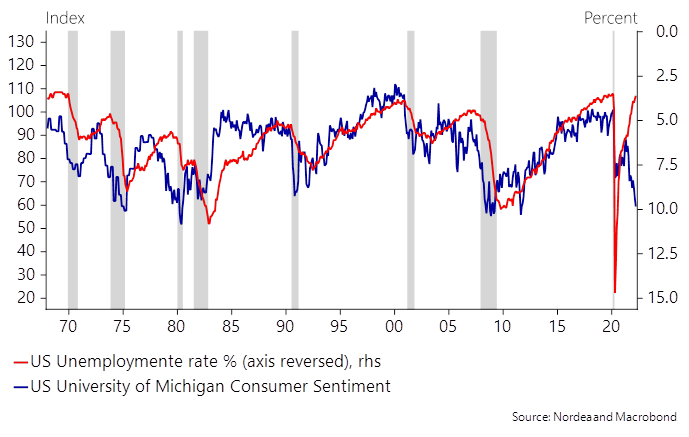
The University of Michigan (UoM) Sentiment index has slid to levels associated with past recessions and the latest spending figures fell 0.4% m/m in February after adjusting for inflation. Spending is not yet alarming, but we note that real spending has declined on a monthly basis in three of the last four months.
The US economic outlook is in the hands of households. The extremely tight labour market will support household consumption, but it is hard to imagine that consumers can endure an environment with increasing living expenses and declining real wages for a prolonged time without consumption taking a hard hit. We do not see UoM recovering anytime soon.
Consumption supported by low unemployment but hurt by bad sentiment
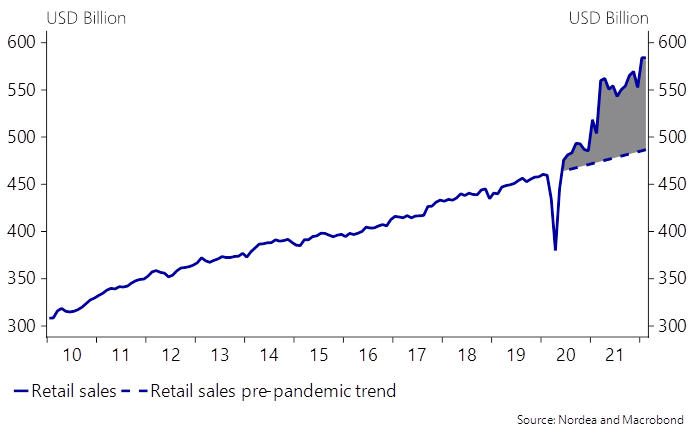
In this perspective, retail sales (Thursday) will be important to watch. Growth in US retail sales slowed in February after surging a month earlier, suggesting we are indeed starting to see a glimpse of the impact of falling purchasing power. The higher energy prices and – importantly in the US – the 20% increase in gasoline prices throughout March will put additional pressure on consumers and crowd out spending in other areas.
Retail sales yet to normalise
Some notes here:
- Consumer sentiment is a coincident indicator, generally bottoming out near the end of recessions, just before unemployment peaks out. Confidence is now as low as it has been in 50 years but no recession just yet with unemployment at a record low!
- We saw similar contradictions between unemployment and confidence in 1973-74 and 1979 but the U.S. was in recession then. Unlike today!
- The reality is that measures of consumer confidence have shown to be meaningfully influenced by trends in gasoline prices, particularly by sharp and sudden changes.
Using more than thirty years of consumer sentiment data, we analyze the relationship between changes in gasoline prices and its impact on consumer sentiment. We find a negative relationship between changes in gasoline prices and changes in consumer sentiment, suggesting that as gasoline prices rise (fall), this negatively (positively) impacts consumer sentiment. Additionally, causality analysis provides support that changes in gasoline prices leads consumer sentiment and changes in consumer sentiment. (Journal of Applied Business and Economics, 2012)
And this from The Pew Research Center in 2014:

- FYI, gasoline prices spiked 42% in 1973-74 and 68% in 1979. Currently: +45%.
- Now a smaller part of consumer budgets, can high energy inflation cause a recession?
Nordea’s retail sales chart above takes no account of inflation. If it did, it would show that real sales peaked in April 2021 and declined 1.7% since through February, with indications of weak March sales. In fact, rising inflation has already done half of the normalization process Nordea is talking about.

- Spending on goods accounts for 33% of total spending and the current hope is that the inevitable slowdown in goods will be more than offset by catch up spending on services, still 4-5% below trend.
- But there is a potential problem: real income. Americans have used the dollars not spent on services to splurge on goods during the pandemic years. But their real disposable income is now only 1.5% above pre-pandemic levels and declined in each the last seven months and 8 of the last 9.

-
This in spite of “a very, very, very strong labor market” as Mr. Powell said. Unfortunately, inflation is even stronger and is quickly eroding wage gains and whatever excess savings might have existed. The chart above clearly shows the historically tight relationship between spending and income.
-
Can we thus reasonably expect that services will take over from goods when disposable income is dropping? Just in the last 3 months , real DPI declined at a 3.4% annualized rate.

- Real DPI is now down 1.6% YoY. On a trailing 3-month basis, it did worse only once in the last 50 years: -2.6% in December 1974. Then, a 0.6pp dip in the savings rate (from 14.4%!) could not prevent a deep and long recession with the unemployment rate jumping from 4.6% to 9.0% within 19 months.
The truth is that, for most people, when it comes to spending, recurring real income matters a lot more than savings.
Most economists contend that inflation will abate significantly by the end of the year and return to the 2-3% range in 2023, what John Mauldin smartly calls the “immaculate disinflation”, like it will simply happen.
Some use inflation on vehicles to support their case, pointing out that prices of new and used vehicles, up 12.3% and 41.2% YoY respectively, will necessarily come down when the chips shortages abate. Their combined 8% weight in the CPI will then work in reverse and drag total inflation down.
The chart below plots the YoY changes in total CPI (red), average inflation for new and used vehicles (blue) and CPI ex-vehicles (black). There is no doubt that vehicle prices will eventually decline, but CPI-ex-vehicles is still up 6.3% in February from 2.5% two years ago.

The next chart shows the MoM changes in total CPI (red) and CPI-ex-vehicles. Note the large impact vehicles had in April, May and June 2021 when their big spikes occurred.

Since July 2021, both series have increased by 0.6% per month on average, a 7.3% annualized rate.
What will likely happen is that vehicle prices will eventually start declining as supply normalizes, dragging down total and core CPI, perhaps to the 3-4% range, allowing for an economist “aha!” moment, celebrating mathematical disinflation from items most of us only purchase very occasionally, while other goods and services we use in our daily lives (e.g. energy, food, rent, apparel, dry cleaning) keep climbing faster than wages.
We might well get a statistical inflation relief that could make even real incomes look stronger for a while.
But main street reality will not change unless the seemingly nascent wage/price spiral is stopped, either by rising unemployment, broadly improved supply of food, energy and other goods, and diminished corporate pricing power.
The war in Ukraine has considerably reduced prospects for goods deflation. As companies scramble to restore their supply chains and reconfigure their production and distribution facilities (reshoring, nearshoring and just-in-case manufacturing all concentrated in western world economies), demand for scarce labor and commodities will remain high for some time.
-
Cost of living crisis to worsen
The coming week sees inflation updates for the US, mainland China and the UK, which are expected to show the cost of living crisis intensifying. Worse is yet to come, as signalled by new highs for many PMI survey price indices, which showed business costs rising at a rate not seen since 2008 in March. These higher costs are being increasingly passed on to customers, leading to record rates of inflation in the US and Europe.
By measuring how companies’ cost pressures are changing, this index provides a reliable advance guide to consumer prices, tending to change around three months ahead of the annual rate of consumer inflation. Recently, the price index provided a very early steer into the severity and persistence of the surge in inflation triggered by the pandemic, and the latest rise in this index therefore hints at further upward inflationary pressures to come for households.


But what about services inflation? From S&P Global:
-
New highs for service sector inflation as spending patterns shift
Input cost inflation accelerated worldwide in both manufacturing and services, in both cases feeding through to higher rates of selling price inflation as higher costs were passed on to customers. While manufacturing input cost inflation and selling price growth remained below recent highs, new all-time peaks were recorded in the service sector.
While service sector inflation rates for both costs and selling prices lagged manufacturing throughout 2021 on average globally, the divergence has recently narrowed, largely reflecting the increasing spill-over of higher goods and fuel costs to the service sector, notably in terms of higher food and transport prices, and the later pick-up in demand for services since the start of the pandemic.
Lockdowns and other health-related restrictions meant spending was diverted away from services to goods in the early stages of the pandemic, but spending is shifting back towards services as economies reopen, which is causing a commensurate shift in pricing power from goods producers back to service providers.


- Starbucks Hires New Strategy Chief as More Baristas Unionize Starbucks said it is bringing aboard a new senior executive specialized in worker relations as more baristas at the coffee chain’s cafes this week voted to unionize.
(…) Six New York state cafes voted Thursday and Friday to join Starbucks Workers United, the union formed to help the first Buffalo, N.Y.-area locations unionize in late 2021. Additional tallies are slated for next week for Starbucks cafes in Massachusetts, Oregon and Virginia. (…)
More than 180 of Starbucks’s 9,000 corporate stores have petitioned for union elections.
Addressing workers Monday, Mr. Schultz said that he never would have been able to expand Starbucks with the presence of labor organizations within the chain, and that he sees Starbucks as a pro-worker company “that does not need someone in between us and our people.” (…)$SPXmazon warehouse staff in New York City voted to unionize. More U.S. workers, citing unfair labor practices, now want a similar vote
- JetBlue is offering flight attendants $1,000 attendance bonuses for the spring travel crush. (CNBC)
Bank of Canada expected to announce oversized rate hike this week Bay Street economists believe the central bank will raise its policy interest rate by half a percentage point at its Wednesday rate announcement, instead of the usual quarter percentage point
Europe Debates How to Cut Purchases of Russian Oil European Union officials are seeking to make oil the focus of the bloc’s next set of economic measures against Russia over its invasion of Ukraine.
(…) Germany continues to resist the idea of an oil ban, and EU officials are wary of acting during the French presidential election, whose first round took place Sunday. Meanwhile, Hungary has become more entrenched in its opposition, diplomats say. (…)
Germany, which also insisted on a slower timetable for stopping Russian coal imports than many other EU countries wanted, has said it could halve its Russian oil imports by this summer, but that it would need until the end of this year to stop them entirely. (…)
A senior European official said Budapest seems to have “dug in” on its opposition to energy sanctions since the elections on April 3. Austria is also notably reluctant to impose tougher energy sanctions. (…)
Poland and the Baltic countries are in the opposite camp. Lithuania announced last week it had stopped all oil and gas purchases from Russia, despite its traditionally heavy reliance on Russian energy supplies. (…)
The U.S. has also promised to increase shipments of liquefied natural gas to Europe to ease its energy squeeze, and is aiming to ship 50 billion cubic meters of LNG to Europe annually in the coming years, making up for about a third of the gas the EU receives from Russia.
China auto sales slump in March on COVID curbs
Sales in the world’s biggest car market tumbled 11.7% in March from a year earlier to 2.23 million vehicles – its first decline in three months and contrasting sharply with an 18.7% jump in February, according to the China Association of Automobile Manufacturers. (…)
While China’s overall March sales plummeted, sales of new energy vehicles, which include battery-powered electric vehicles, plug-in petrol-electric hybrids and hydrogen fuel-cell vehicles, more than doubled in March to 484,000 vehicles. That was, however, sharply slower than a tripling of sales in February.
China Inflation Rises as Lockdowns, Ukraine War Drive Up Prices Inflation in China picked up in March, driven by soaring global commodity prices and lockdowns in major cities, but the overall inflationary picture remains far more benign than in other major economies.
(…) Consumer prices in March were up 1.5% from a year earlier, biggest annual jump in three months, while the prices charged by companies at the factory gate were up 8.3%, a slower pace than February’s 8.8%, but exceeding the expectations of economists polled by The Wall Street Journal. (…)
Gasoline prices were up 25% as Russia’s invasion of Ukraine sent global oil prices rocketing. (…)
Producer prices in March were up 1.1% from February, double the previous 0.5% monthly gain, as geopolitics and other international factors drove up commodity prices, said Dong Lijuan, a senior statistician with China’s statistics bureau. Russia’s invasion of Ukraine has pushed up prices for commodities ranging from oil to nickel to wheat, heaping costs on factories world-wide.
What the media omit is that food prices were down 1.5% YoY in March and that Non-food CPI was up 2.2% YoY but +11.6% MoM annualized according to Goldman Sachs.
")
(GS)
TECHNICALS WATCH
Patience and defense remain the best advice. Demand for equities is weak and very selective as small caps continue to be shunned while large cap investors increasingly focus on defensive sectors.
Actually, my favorite technical analysis firm, for the first time during this long cycle, raises the possibility that we are living a major market top, not dissimilar to 2007.
The S&P 500 Large Cap Index – 13/34–Week EMA Trend Chart seems to want to turn negative again:

- John Authers: How ‘Ukraine Fatigue’ Is Taking Over Markets The attitude seems to be that this war can be safely ignored if it turns into a long grind of attrition. That’s a mistake.
(…) There are chances of seriously terrible and genuinely positive outcomes. But the likelihood is that this turns into something more like World War I, stuck in a stalemate for years. The attitude in markets seems to be that this can then be safely ignored, much as the grinding conflict in Afghanistan came to be known as the “Forgotten War.”
The problem with this is that Ukraine is in Europe, bordering the European Union, and is a major supplier of raw materials to the rest of the world. (…)
Further, it’s hard to see how the stalemate can end without the West finding some way to limit its reliance on Russian energy. It will take years, at best. (…)
Russia needs to find alternative buyers to avoid an eventual loss in a years-long war of attrition. That turns the spotlight to India and particularly to China. If they decide to prop up Russia by buying more oil at preferential rates, Beijing will sunder its economic relationship with the EU, and probably usher in a grim return to a bipolar Cold War-like world. (…)
Stocks are resisting the dreadful news from Ukraine because brokers’ analysts are upgrading their forecasts for 2022 earnings despite everything. (…)
EARNINGS WATCH
From Refinitiv (my emphasis):
Twenty S&P 500 companies have reported their latest quarter:
Of these companies, 70.0% reported earnings above analyst expectations and 25.0% reported earnings below analyst expectations. In a typical quarter (since 1994), 66% of companies beat estimates and 20% miss estimates. Over the past four quarters, 83% of companies beat the estimates and 13% missed estimates.
In aggregate, companies are reporting earnings that are 2.4% above estimates, which compares to a long-term (since 1994) average surprise factor of 4.1% and the average surprise factor over the prior four quarters of 13.3%.
Of these companies, 80.0% reported revenue above analyst expectations and 20.0% reported revenue below analyst expectations. In a typical quarter (since 2002), 62% of companies beat estimates and 38% miss estimates. Over the past four quarters, 80% of companies beat the estimates and 20% missed estimates.
In aggregate, companies are reporting revenues that are 1.1% above estimates, which compares to a long-term (since 2002) average surprise factor of 1.2% and the average surprise factor over the prior four quarters of 3.7%.
The estimated earnings growth rate for the S&P 500 for 22Q1 is 6.1% [6.4% on Apr. 1]. If the energy sector is excluded, the growth rate declines to 0.6% [1.0% on Apr. 1]. The energy sector has the highest earnings growth rate (239.2%) of any sector. It is expected to earn $32.1B in 22Q1, compared to earnings of $9.5B in 21Q1.
The estimated revenue growth rate for the S&P 500 for 22Q1 is 10.9%. If the energy sector is excluded, the growth rate declines to
8.3%.The estimated earnings growth rate for the S&P 500 for 22Q2 is 6.9% [6.8% on Apr. 1]. If the energy sector is excluded, the growth rate declines to 2.1% [2.4%].


Downward revisions are spreading out to more sectors. Last week, only 3 S&P 500 sectors (Health Care, Real Estate and Energy) had positive revisions compared to 4 and 7 in each of the previous two weeks respectively.
But revisions are pretty minor so far:
Goldman Sachs:
We forecast downside risks to earnings estimates for the remaining quarters in 2022. Full-year EPS estimates have actually been revised 2% higher since the start of the year and earnings growth is forecast to accelerate in coming quarters. Analysts appear reluctant to adequately trim forecasts despite the high degree of uncertainty surrounding the economic outlook.
Although our 2022 top-down EPS estimate is 3% below bottom-up consensus ($221 vs. $227), we believe results from 1Q earnings season are unlikely to generate enough clarity for analyst estimates to fully converge to our forecast.
BTW:


