U.S. PPI Posts Another Strong Increase in February
The Producer Price Index for final demand rose 0.5% (2.8% y/y) in February following a 1.3% strengthening in January. The index has risen at an 8.6% annual rate during the last three months. A 0.5% rise had been expected in the Action Economics Forecast Survey. The PPI excluding food & energy rose 0.2% (2.5% y/y) after increasing 1.2% in January. The index rose at a 5.8% rate during the last three months. A 0.3% rise had been expected. The PPI less food, energy & trade services rose 0.2% (2.2% y/y) after strengthening 1.2% in January.
Energy prices surged 6.0% (5.5% y/y) in February following a 5.1% January advance. Gasoline prices jumped 13.1% (3.5% y/y) while the costs of home heating oil improved 4.6% (1.4% y/y).
Food prices improved 1.3% last month (4.5% y/y) after rising 0.2% in January. Beef & veal prices jumped 13.0% (15.9% y/y) and dairy product prices rose 1.0% (-2.9% y/y).
The 0.2% increase in the core PPI reflected 0.3% rise (2.5% y/y) in goods prices less food & energy. Capital equipment prices rose 0.3% (1.5% y/y) for a second month. Core consumer goods edged 0.1% higher (1.8% y/y) following a 0.4% rise. The cost of nondurable consumer goods held steady (1.6% y/y) while durable consumer goods prices improved 0.3% (2.1% y/y). Private capital equipment prices rose 0.3% (1.5% y/y) for a second month.
Services prices edged 0.1% higher (2.5% y/y) in February following a 1.3% jump. Trade services edged 0.1% higher (3.3% y/y) following a 1.0% jump. The price of transportation & warehousing of finished goods for final demand rose 0.2% (3.8% y/y) following a 1.8% rise.
Construction costs rose 0.3% (1.0% y/y), the strongest of four consecutive monthly increases.
Intermediate goods prices surged 2.7% in February (6.6% y/y) following a 1.7% rise. These gains were bolstered by the strength in energy prices.


-
Turbocharged Economy Leaves Factories Struggling to Deliver Goods That Shoppers Want Some businesses worry that a further surge in demand, led by the U.S., could exacerbate supply-chain disruptions; ships are sitting offshore for weeks
(…) Orders to Honey-Can-Do’s manufacturers in China that took 30 days a year and a half ago now take up to three months, while shipping costs are 50% higher, Mr. Greenspon said.
“Ships can sit offshore for weeks at a time in the U.S.,” waiting to dock at busy ports, says Mr. Greenspon. “There doesn’t seem to be any relief.” (…)
The price of “every material, every part, plastic parts, glue, everything from China has increased,” said Lim Bao Lih, export manager at Classic International.
She said her firm used to source nearly 70% of its raw materials from China, including its core material, leather. Now, the company buys more-expensive leather from Malaysian suppliers to offset rising shipping costs and material prices in China. (…)

Canada’s job market snaps back from second-wave setbacks
The labour market added a net 259,200 positions in February, blowing past the consensus estimate of 75,000. The rapid gain coincided with an easing of health restrictions in several provinces and followed the loss of 266,000 positions in December and January. The unemployment rate fell to 8.2 per cent from 9.4 per cent, Statistics Canada said on Friday.
One year into the pandemic, the labour market has a long road to recovery. The number of employed people is down by 600,000. About 406,000 more people are working less than half their usual hours. And nearly half a million have been unemployed for longer than six months. (…)
Given the industries involved, job gains were geared more toward part-time positions (171,000) than full-time work (88,200). (…)
Looking ahead, March may bring another round of hiring. Toronto moved out of the province’s toughest lockdown phase this month, allowing more in-person shopping. (…)

CONSUMER WATCH
Continuing the big debate.
The Limits to America’s Pent-Up Demand (Stephen Roach)
(…) Recent trends in US consumer spending suggest that the natural forces of pent-up demand may largely be spent. Over the final eight months of 2020, the post-lockdown rebound of durables consumption was fully 39% greater than what was lost during the lockdown in March and April. As a result, durables consumption rose to 8.25% of GDP in the second half of 2020 – the highest share since early 2007 and well in excess of the 7.1% average over the 2008-19 period.
There is probably some more to come. On the heels of another tranche of federal relief checks issued in December ($600 per eligible recipient), the 5.3% surge in retail sales reported for January – dominated by outsize gains for durable items such as electronics, appliances, and furniture – provides further evidence of consumer euphoria. And with an even larger round of $1,400 checks in the offing as President Joe Biden’s “American Rescue Plan” takes hold, additional impetus from consumer durables seems likely.
At that point, however, pent-up demand should be exhausted. This is even more apparent when assessing the extraordinary power of the recent surge in consumer durables relative to pent-up demand cycles in the past.
Since the early 1990s, recoveries in personal consumption have been relatively muted. But in the seven cyclical expansions from the mid-1950s through the early 1980s, the release of pent-up demand boosted consumer durables’ share of GDP by 0.6 percentage points, on average, in the four quarters following business cycle troughs. From this perspective, the recent increase in consumer durables’ share of GDP of fully 1.35 percentage points from the 6.9% low hit in the first quarter of 2020 is all the more extraordinary. At more than double the earlier cyclical norm, it is all the more unsustainable. (…)
All these numbers are correct and powerful arguments…until we look at this longer term chart plotting durables expenditures against GDP (quarterly data):

Yes, the recent bounce was large and “well in excess of the 7.1% average over the 2008-19 period”. But that average was historically unusually low, scars from the GFC and, apparently, a more frugal, environmentally conscious consumer.
And yes, “the recent increase in consumer durables’ share of GDP (…) is more than double the earlier cyclical norm.” But the recent bounce merely returned the ratio to its previous cyclical lows.
I don’t pretend to have any particular insight in the American consumer psyche but I think these numbers deserve more digging.
This next chart plots durables/GDP in both nominal (red) and real terms: from the price deflated data, we see that Americans still crave for more durable goods.

The splurge in the second half of 2020 looks rather spectacular until we also visualize the first half trend and put it all against the longer term trend…

…and plot annual data, illustrating that real spending on durables, for the whole of 2020, was pretty much in line with the long-term trend of 3.0-4.5% annual growth:


Another way of assessing pent-up or spent-up demand is to contrast spending on durables with disposable income. The blue line tells us that Americans last year spent 12% of their real disposable income on durables. This was barely up from 11.9% in 2019 but the long-term trend would have suggested something closer to 13.5%. In nominal terms, durables absorbed 9.2% of disposable income in 2020, slightly lower than the 9.46% average since 2013:

The reality is that durable goods have gradually become relative bargains for Americans over the last 2 decades as durables prices (blue) have constantly deflated:

In all, it seems highly adventurous to say that the American consumer has spent himself out during the pandemic, even more so considering the tsunami of rescue money still coming his way, the humongous savings and significant deleveraging, and the historically low interest rates right when the economy is about to fully reopen.
This is much different than the ending of the GFC which came about thanks to monetary stimulations while most Western countries remained fiscally cautious. The monetary spigot flowed right into financial assets without much impact on Main Street. This time around, a lot of the stimulus goes directly to consumers with little incentives to save given their reduced indebtedness and negative real rates.
In my wager book, Americans will are more likely to live up to their reputation and will consume quite a bit of their stimmies (more on this later).
- Michigan’s consumer sentiment index in March hit the highest level since March 2020, jumping to 83.0 from 76.8 in February. The index of current conditions jumped 5 points to 91.5 and the expectations index improved by 7 points to 77.5.
Consumer sentiment rose in early March to its highest level in a year due to the growing number of vaccinations as well as the widely anticipated passage of Biden’s relief measures. The gains were widespread across all socioeconomic subgroups and all regions, although the largest monthly gains were concentrated among households in the bottom third of the income distribution as well as those aged 55 or older. Over the past fifty years, the key age group that consistently led recoveries, but was the last age group to indicate a pending recession, was consumers under age 35 (see chart). (…)
Another important distinction involved greatly improved views of buying conditions for large household durables, but only marginal gains for vehicles and homes. (…)

-
“More Spending, More Growth”
Goldman Sachs raised its GDP growth expectations for the U.S. economy:
In light of the larger fiscal package just enacted, we now expect slightly higher GDP growth of +6% / +11% / +8.5% / +6.5% in 2021Q1-Q4 which implies +7.0% in 2021 on a full-year basis (vs. +5.5% consensus) and +8.0% on a Q4/Q4 basis (vs. +6.0% consensus). (…)
As we now expect a somewhat slower drop-off in fiscal support in subsequent years, we have also raised our GDP growth forecast in 2022 by 0.6pp to +5.1% on a full-year basis (vs. +3.8% consensus) and by 0.5pp to +2.9% on a Q4/Q4 basis (vs. +2.6% consensus).
We have similarly nudged up our inflation forecast to reflect the tighter labor market, and now expect core PCE to reach +1.90% / +2.00% / +2.1% / +2.15% at the end of 2021-2024 (vs. +2.00% / +1.90% / +2.05% / +2.15% previously). This change reflects a tighter labor market, as well as an earlier-than-expected end to crisis-related Medicare payments (at the end of this month, vs. our previous expectation that the Phase 5 bill would be renew these payments for the rest of 2021).

ISRAEL WATCH
Restaurants fully booked as Israelis flock back after year of restrictions Some places reporting 10-day waiting lists for a spot; credit card use jumps after eateries, cafes reopen
Since reopening Sunday, restaurants and cafes have seen a torrent of customers, with many would-be diners unable to make reservations as tables at many eateries are all booked days in advance, according to the Kan public broadcaster.
Some restaurants had a 10-day waiting list, the report said. “It’s crazy,” said Haggai, a co-owner of Tel Aviv’s Goocha restaurant. “From the start of the week, every day has been packed to weekend levels.” (…)
Under the relaxed virus rules, eateries are allowed to host up to 100 people with Green Passes — indicating vaccination or recovery from the virus — indoors at up to 75 percent capacity, and can seat up to 100 people outside, even without passes. Tables must be two meters apart. (…)
Channel 12 reported last week that some 4,000 of the 14,000 restaurants that operated before the pandemic have closed for good. (…)
China’s Economic Activity Soars Chinese economic activity surged in the first two months of 2021, though the picture was less rosy when weighed against growth momentum in the final months of 2020.
(…) Industrial output in the January-February period rose 35.1% from a year earlier while retail sales, a major gauge of China’s consumption, expanded 33.8% over that same time frame. Both indicators topped economists’ expectations.
Home sales by volume, an indicator of demand, soared 143.5% in the first two months of 2021 from a year earlier, while property investment by value gained 38.3% over the same stretch.
Fixed-asset investment increased 35.0% over that period compared with a year earlier, though economists had predicted faster growth, especially in manufacturing investment.
More worrying was China’s benchmark measure of joblessness, the surveyed urban unemployment rate, which ticked higher to 5.5% in February, from January’s 5.4% and December’s 5.2% readings, official data showed Monday. (…)
Officials noted Monday that, for all the statistical volatility of the past year, the economic levels for January and February this year were higher than those for the first two months of 2019, well before China’s economy was walloped by the emerging pandemic.
Industrial output in the January-February period increased by 16.9% compared with the same period in 2019, while retail sales were 6.4% higher, the statistics bureau said. (…)

-
China’s Youthful, Debt-Fueled Spending Spree Sparks Reckoning A new generation helped power rising consumption. Now, new financial regulations are forcing lenders to reassess their business strategies.
Leading up to last year’s coronavirus pandemic, a new generation of tech-savvy and free-spending citizens helped power rising consumption, a growing driver of China’s economy.
Many used short-term loans to pay for expenses such as prestige cosmetics, electronic gadgets and costly restaurant meals. They found credit easy to obtain, thanks to Ant and other Chinese financial-technology companies that provided unsecured loans to millions of people who didn’t have bank-issued credit cards. In 2019, online loans accounted for as much as half of short-term consumer loans in China, according to estimates from Fitch Ratings. (…)
Starting in 2022, Ant and its peers will have to fund at least 30% of the loans they make together with banks, a rule designed to make online lenders bear more risk.
In recent weeks, a grass-roots campaign on Chinese social media dubbed “coming ashore”—a metaphor for becoming debt-free—has been gathering steam, with people sharing their experiences and regrets about overspending and borrowing. (…)
Some described clawing their way out of debt by reducing daily expenses and avoiding unnecessary purchases. (…)
The official, Guo Wuping, said fintech companies allowed people to borrow excessively, causing “some low-income people and young people to fall into debt traps.” He described Ant’s Huabei virtual-credit-line service as inclusive but not favorable, as some fees associated with it were higher than what banks charge on credit cards. (…)
Ant’s personal-lending services Huabei and Jiebei—meaning “just spend” and “just borrow”—were used by about half a billion Chinese citizens in the 12 months to June alone. (…)
- China Begins Withdrawing Pandemic Stimulus Efforts As its economy rebounds, Beijing begins a delicate process that will influence the domestic and global recoveries.
(…) China’s policy makers have expressed concern about an overheating housing market and want to prevent bigger imbalances. They are also eager to resume a multiyear campaign to curb debt that started building during the previous global recession. (…)
China is likely to move slowly, gradually tightening credit in certain parts of the economy while avoiding more blunt-force moves like raising interest rates. (…)
China lowered its fiscal deficit target—the gap between government spending and revenue—to 3.2% of GDP this year, from 3.6% in 2020. (…)
The government also cut the quota for local government special bonds, a type of off-budget financing to fund local investments like infrastructure, to approximately $560 billion, down from $576 billion last year.
Beijing didn’t announce further issuance of special central government bonds this year, after selling approximately $154 billion of such bonds in 2020. (…)
In January, the central bank mopped up more liquidity than expected through daily open-market operations, a tool used to control the money supply available to commercial banks. That briefly sent a key short-term money rate to its highest level in five years, making it costlier for banks to borrow funds.
To tame rising property prices, China’s financial regulators recently imposed new rules making it more difficult for property developers, who are typically highly leveraged, to obtain new bank loans.
Broad credit growth picked up some in February, after declining for four consecutive months. Still, analysts expect lending will slow again given Beijing’s recent signals. (…)
At the end of 2020, China’s total fiscal spending on pandemic stimulus was about 6% of its GDP, versus 19% for the U.S., according to IMF calculations. (…)
(Nordea)
China’s Corporate Earnings Set for Biggest Jump in a Decade
(…) Having powered its way out of the coronavirus lockdown to become the only major economy in the world to grow last year, China is also seen taking the lead on earnings recovery from the pandemic. Profits at firms in the CSI 300 Index are expected to jump 28% year-on-year in the fourth quarter, the fastest pace since 2010, according to data compiled by Bloomberg. That’s versus an estimated growth of just 2.2% for the S&P 500 Index. (…)

Households’ Equity Market Exposure Continues To Rise
(…) We note that this does not include mutual fund shares but it does include ETFs, closed-end funds, and REITs. As shown below, the value of equity market assets held by households is up to 16.8/% of total assets, the highest since Q3 of 1969 and surpassing the 16.7% peak from the tech bubble. Looking at financial assets only, equity exposure is the highest since the 24.2% peak from 2000, but is nonetheless extremely elevated. We should note that while this signal is certainly a contrarian indicator, it doesn’t necessarily mean that equity markets must decline in value; there’s no reason that markets can’t continue to climb and raise the share of equity ownership further.

(Bespoke)
Things look different when we include household holdings of mutual funds and other exposure to equities. In the chart below we account for indirect allocations to equities. By this measure, Q4 equity market exposure rose to 38.0% of financial assets (versus the Q1 2000 peak of 38.3%). Equity exposure as a percentage of all financial assets hit a record, surpassing the old peak of 26.4% with a 27.0% reading in Q4. In short, households are very aggressively exposed to equity markets.

(Bespoke)
To say that “there’s no reason that markets can’t continue to climb and raise the share of equity ownership further” is technically right but, practically, we all know there is a limit. Market growth can, in itself, raise the allocation, but our concern really is with real demand from here. Where does the “prudent man/woman rule” starts to matter?
Normally, 40% of one’s financial assets in straight equity would sound risky, particularly when valuations are cyclically extreme. But when the Fed prevents any “reasonable” returns on the other 60%, what does a prudent person do?
- Ride the fixed income risk curve up? Check!

This when Treasuries are also dearly priced. From Steve Blumenthal’s On My Radar:
What the next chart shows is how much is at risk for every 1% rise in bond yields (red arrow pointing right). Shown are the 10-year Treasury note and the 30-year Treasury bond. Zero in on the -9.24% and -21.67% numbers. That’s the current loss in rise in interest rates since late August. Note the losses should rates move up another percentage point from here too. This is why I say the bond market is broken. A 1.54% yield with inflation above that number does nothing to help your portfolio. Further, should rates continue to rise, you lose money. The reward-to-risk is just not there.

- Buy dividend yields? Check!

- Go for growth? Check!

Goldman Sachs: “In some sense valuations today are even more elevated than they were in 2000. 20 years ago, the aggregate S&P 500 P/E was a similar 24x, but the median stock traded at 14x. Today, the median firm trades at 21x.”

- Prudently go cash?
Not quite yet if technical analysis has any weight in the decision.
TECHNICALS WATCH
While the high-flying segment of equity markets was correcting, many other major indices reached all-time highs, namely the DJIA and its Transports component, the NYSE, all S&P caps (600, 500 and 400) and the Russell 2000 and Mid-Cap. Even the TSX and many European indices participated in the fireworks.
And last week, the techies and other money losers came back!
My favorite technical analysis service says that this “broad, expanding demand objectively” means that “the intermediate-term advance is healthy and able to continue into the weeks and months ahead.”
To what extent does this broad and expanding demand rely on retail investors and how they use their “rescue checks”?
Well, Deutsche Bank’s survey says its online users will invest 37% of payments with 43% of them newby investors:

But Bank of America’s survey of more than 3000 people reveals that only 9% would invest their stimmies and 36% would spend them.

(via The Market Ear)
Biden Eyes First Major Tax Hike Since 1993 in Next Economic Plan
(…) While it’s been increasingly clear that tax hikes will be a component — Treasury Secretary Janet Yellen has said at least part of the next bill will have to be paid for, and pointed to higher rates — key advisers are now making preparations for a package of measures that could include an increase in both the corporate tax rate and the individual rate for high earners. (…)
The tax hikes included in any broader infrastructure and jobs package are likely to include repealing portions of President Donald Trump’s 2017 tax law that benefit corporations and wealthy individuals, as well as making other changes to make the tax code more progressive, said the people familiar with the plan.
The following are among proposals currently planned or under consideration, according to the people, who asked not to be named as the discussions are private:
- Raising the corporate tax rate to 28% from 21%
- Paring back tax preferences for so-called pass-through businesses, such as limited-liability companies or partnerships
- Raising the income tax rate on individuals earning more than $400,000
- Expanding the estate tax’s reach
- A higher capital-gains tax rate for individuals earning at least $1 million annually. (Biden on the campaign trail proposed applying income-tax rates, which would be higher)
An independent analysis of the Biden campaign tax plan done by the Tax Policy Center estimated it would raise $2.1 trillion over a decade, though the administration’s plan is likely to be smaller. Bianchi earlier this month wrote that congressional Democrats might agree to $500 billion.
The overall program has yet to be unveiled, with analysts penciling in $2 trillion to $4 trillion. No date has yet been set for an announcement, though the White House said the plan would follow the signing of the Covid-19 relief bill.
Commodities Supercycle Looks Like a Stretch Some investors are betting commodity prices will surge over a long period, but history suggests the conditions aren’t right.
(…) When resources’ prices swing higher for an extended period, one of three things happens. The first is an economic shock, such as the recession in the 1970s, caused in part by the Arab oil embargo. The second is a rush of supply as miners, energy producers and farmers seek to cash in. Over time, people switch to cheaper alternatives. (…)
The world’s biggest independent oil trader doesn’t see an imminent supply crunch. “We have plenty of reserves in the ground, we have plenty of refining capacity and we have plenty of ships to move oil,” said Giovanni Serio, head of research at Vitol. (…)
Metal prices are the beneficiary of booming demand for goods and the economy’s emergence from lockdown. Both fillips are likely to fade. Also, it will be years before green infrastructure and technologies devour metals such as lithium at a pace that propels prices upward, analysts say.
Traders say there is plenty of copper available right now. (…)
The current run-up in metal prices in part reflects the same forces that have driven the past year’s recovery in stocks and corporate bonds.
“Fiscal and monetary stimulus has underpinned the rally since last March,” said Tom Mulqueen, head of research at Amalgamated Metal Trading Ltd. “There’s just more money in financial markets.”
John Authers today:
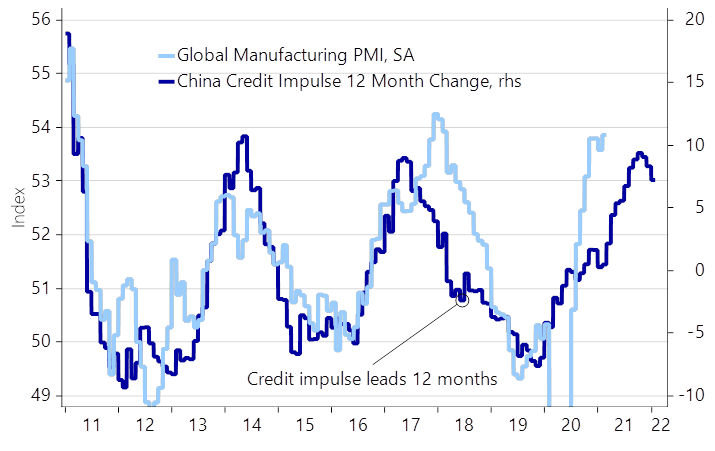
Capital Economics points out that industrial metals prices have been almost wholly dependent on demand from China. This was true for two decades before the GFC, and it has been even more true in the post-crisis decade. With China apparently reining in credit again, and once more hoping that it can manage the switch from an investment- to a consumption-led economy, and with no other country (even India) in any position to replace China as consumer-of-first-resort, this could be a problem for the thesis that we have a new upward commodity cycle coming, at least according to Capital Economics:

Electric-Vehicle Startups Promise Record-Setting Revenue Growth Amid the current SPAC frenzy, companies with little revenue today are projecting explosive growth in a short time, leaving some investors skeptical.
It took Google eight years to reach $10 billion in sales, the fastest ever for a U.S. startup. In the current SPAC frenzy, a spate of electric-vehicle companies planning listings are vowing to beat its record—in some cases by several years.
Among the most ambitious are luxury-car maker Faraday Future, U.K.-based electric-van and bus maker Arrival Group, and auto maker Fisker Inc. FSR -6.05% Each has disclosed plans to surpass the $10 billion revenue mark within three years of launching sales and production. (…)
Those projections, which regulations strongly discourage in IPOs, are another important factor in how investors value the emerging companies. Expectations of growth tend to lead to higher valuations. (…)
More than 10 electric-vehicle or battery companies that struck deals with SPACs have been valued in the billions of dollars before producing any revenue, as amateur traders and many traditional investors have flocked to the buzzy sector. (…)
“It is easy to make PowerPoint slides; it’s relatively easy to make a few prototypes that look good and drive well,” said Mr. Baker, now the chief investment officer at Atreides Management LP. “It’s mass producing high-quality, reliable cars that’s hard.” (…)
SPAC managers have hailed the ability to provide projections, saying they help startups communicate their vision to investors. (…)
![]() It’s only words and words are all I have
It’s only words and words are all I have
To take your heart away ![]()
(The Bee Gees)
Europe Faces a Covid Rebound Slow vaccinations, outpaced by virus variants, and indecision by EU governments are deepening the continent’s gloom
(…) Italy’s escalation comes after weeks of lighter measures failed to stop the rapid rise of the U.K. variant. (…) Mr. Draghi doesn’t have to worry about re-election: He is a technocratic prime minister leading an emergency government with the support of nearly all parties in Parliament for probably only one year. (…)
French President Emmanuel Macron, who is up for re-election next year, has rebuffed calls from public-health experts to impose a third lockdown on the country. Instead he has relied on a nationwide evening curfew and other restrictions while authorities try to accelerate vaccinations. Health Minister Olivier Veran told reporters Thursday that variants now account for more than 70% of new infections in France. (…)
In Germany, which is gearing up for national elections in September, there is little political will to reimpose tougher restrictions, even though infections have begun increasing again since early February. Scientists say the U.K. variant is behind the rise there, too. (…)


