U.S. Home Builders Urge Biden to Help Slow Housing Inflation
The biggest U.S. homebuilders group urged the Biden administration to help increase lumber supply, saying record-high costs threaten to price potential home buyers out of the market and curb construction.
The administration needs to remove import tariffs on Canadian lumber and urge producers to boost output, the National Association of Home Builders said Friday on its website. In November, the U.S. Department of Commerce reduced its duties on Canadian softwood lumber by more than half to 9%. (…)
Alicia Huey, a high-end custom home builder in Alabama and second vice-chair of NAHB, said the price of her lumber framing package on identically-sized homes has more than doubled over the past year to $71,000 from $35,000. (…)

This cost-push on housing leads us to
THE BIG DEBATE
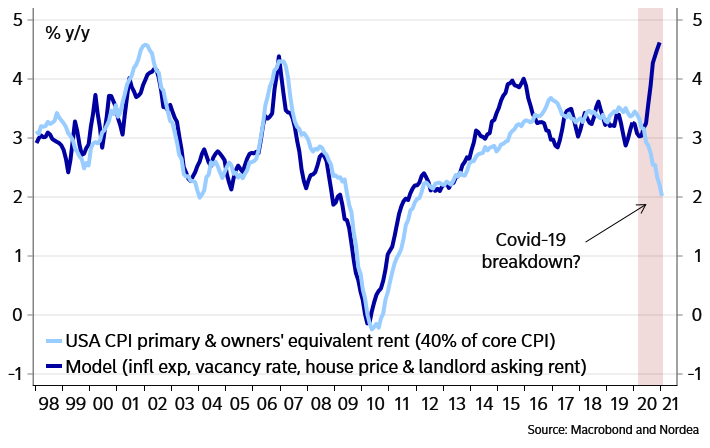
Last week, I showed this chart comparing YoY changes in house prices with the CPI “housing inflation” component that together account for 32% of CPI, highlighting the non-impact of rising house prices on the CPI:

Another way to see this is to index each series to January 2000 = 100: house prices have multiplied by 2.3x while Owner’s Equivalent Rent is up 1.7x.

There are as always many opposing forces in inflation numbers but if we take a balcony view it is the “shelter” component, i.e. rents, that is holding back core inflation.
Shelter has a 42% weight in core CPI and is thereby extremely important. Currently it is running at 1.6% y/y, which is historically quite low, and core CPI would be at 2% y/y if shelter increased at a normal rate. COVID-19 has clearly affected the numbers, both due to how rents are measured but also in terms of the political viability in raising rents during a deep humanitarian disaster.
What is clear, however, is that the underlying pressure to hike rents when COVID-19 cools down is massive, which probably also is true for other service prices. Apartment vacancy rates are the lowest since 1986, house prices are soaring, inflation expectations are increasing and landlords are signalling the largest increase in the asking price for rent ever. There could be a huge, latent jump in shelter in the second half of 2021.
Underlying upside US rent pressures are massive
Any major upward trend in core inflation probably won’t happen until the COVID-19 lockdown behaviour has passed, but here we remain positive on developments. New cases continue to decrease with both the vaccine rollout and seasonal factors indicating that we have passed the peak. Restrictions will accordingly gradually be lifted over the coming 6-8 weeks, opening up for a surge in spending. In our view, an effect of this will be broad price increases.
Financial conditions are extremely loose, money supply has increased rampantly, fiscal stimulus is still with us, inflation base effects will come into play, global food prices are up 20% the past 6 months, there are bottlenecks for semiconductors, freight costs are surging, inflation expectations are rising, companies/households have plenty of money on the side-line and the economic starting point was very different from after the financial crisis – a supply shock that soon should be over, bringing the economy back to normal much faster than from the 2009 abyss. The inflation story is alive.
Bloomberg Businessweek summarized the Summers-Krugman, two Democrats, debate:
Summers, who got to go first, made four points: 1) The $1.9 trillion package is “extremely large” and the amount of spending is far bigger than the estimated “output gap,” that is, the amount by which the economy’s output is falling short of potential; 2) it goes “way beyond what is necessary” to help victims of the Covid-19 crisis; 3) “We risk an inflationary collision of some kind”—if the package does kick up inflation, the Federal Reserve could inadvertently cause a recession by trying to squelch the inflation with higher interest rates; 4) that sum of money, or even more, would be better spent on long-term public investment, what Biden calls “building back better.”
Krugman did not wholly disagree. He compared his differences with Summers to physicist Wolfgang Pauli’s disagreement with Albert Einstein. After one of Einstein’s lectures, Pauli said, “You know, what Mr. Einstein said is not so stupid.” But Krugman said Biden’s plan should be regarded as a rescue, not a stimulus. “Think of it as disaster relief or like fighting a war. When Pearl Harbor gets attacked, you don’t say, ‘How big is the output gap?’” (…)
Krugman argued that the package wouldn’t overstimulate the economy, causing inflation, because a lot of the $1,400 given out in checks will be saved, rather than spent. And if the coronavirus crisis should ease, much of the aid to state and local governments will also be saved in rainy day funds. (…)
[Summers] disagreed with Krugman’s contention that most of the relief money would be spent slowly. He said that once the pandemic ends, there could be a burst of consumption. (…)

Toward the end, the two heavyweights veered into partial agreement. Krugman said, “Larry and I are actually, in many ways, on similar wavelengths.”
Addressing Summers’s views about inflation, he said, “I think you’re wrong. I think you’re excessively worried. But I’m not sure about that.”
What they think doesn’t matter anyhow, he said, because the package is likely to pass intact—or nearly intact. “Then we’ll find out.”
So, it comes down to Krugman saying: “I don’t agree with you, but maybe I should. Anyhow, let’s spend another $1.9 billion, not even 10% of GDP, and see what happens.”
Nobody knows: will people save or spend? So every month, Morning Consult asks Americans: “After you paid your recurring expenses last month, did you have any money left over that you could save or add to your savings?”

Despite the second round of stimulus checks in January, the number of adults who experienced financial hardship in January remained relatively unchanged from December.
Another way to look at the above numbers is that more households spent their stimmies in January.
-
U.S. Consumer Sentiment Falls in Early February Decline driven by downbeat expectations among lower-income households
Consumers’ view of the economy slipped in early February as Americans were more downbeat about future business conditions, according to a University of Michigan survey released Friday.
The preliminary estimate of the index of consumer sentiment came in at 76.2 in February, down from 79.0 in January. The decline in sentiment was concentrated in the measure of future expectations and among households with incomes below $75,000, said Richard Curtin, the survey’s chief economist.
“Households with incomes in the bottom third reported significant setbacks in their current finances, with fewer of these households mentioning recent income gains than anytime since 2014,” Mr. Curtin said. (…)
The sentiment measure was the lowest since August, and down from the 101.0 in February 2020, just before the coronavirus pandemic took hold in the U.S. (…)
Consumers’ assessment of the current economic conditions decreased slightly to 86.2 in February from 86.7 in January. The index of consumer expectations—which reflects the balance of respondents anticipating improved business conditions in the next six months—fell to 69.8 from 74.0 the prior month. (…)
Data: University Of Michigan; Chart: Axios Visuals


Goldman Sachs sees inflation smooth landing:
We estimate that the impact of fiscal measures on the level of GDP will average 5-6% of GDP in 2021, roughly the size of the current output gap. We see less risk of persistent overheating from fiscal stimulus (…). First, any excessive boost from fiscal stimulus would likely be short-lived because spending on most items such as stimulus payments is one-off and spending on some items such as UI benefits will shrink automatically if the economy booms. Second, most consumers tend to deviate only so much from their normal spending habits, so they are likely to spend less of their pent-up savings while they are receiving generous fiscal support, for example. As a result, the total impact of fiscal stimulus, pent-up savings, and post-vaccination reopening will likely prove smaller than the sum of the parts estimated individually.
- Mervyn King: The Debate About Stimulus Is Missing the Point This is not a normal recession, and a conventional stimulus isn’t what’s needed.
(…) The difference between stimulus and support should shape the policy response. Last March, central banks purchased large quantities of assets to prevent dislocation in normally liquid markets for government instruments. But those purchases were not reversed when the temporary dislocation ended. The result is that, unlike after the quantitative easing undertaken in response to the financial crisis, monetary aggregates are now growing very rapidly. In the U.S. M2 rose by 26% between January 2020 and January 2021; in the U.K. the broader measure M4 rose by over 13% in the year to December 2020.
The belief that the sharp fall in output over the past year is a reason for a large monetary injection reflects a fallacious view that any kind of negative shock justifies stimulus. The economic models that lie behind that view fail to pay adequate attention to the nature of today’s shock. Further generalized monetary and fiscal stimulus would add to the existing risk of much higher inflation down the road.
On the fiscal front, what’s required is temporary support for those affected by the immediate consequences of Covid-19, not a longer-lasting stimulus. This is the crucial distinction, far more important than whether the package is big or small.
Much has been made of the difference between the size of the Biden administration’s proposed package and the degree of stimulus recommended by its critics. In fact, both Treasury Secretary Janet Yellen and former Treasury Secretary Larry Summers are right. It makes sense to go big with temporary support that will unwind as the Covid restrictions are relaxed — just as Yellen advocates, when she stresses the need to help people “make it to the other side.” But Summers is also correct in pointing to the dangers of a longer-lasting fiscal stimulus on top of the Federal Reserve’s large monetary injection.
The debate should be about the timing and composition of added fiscal support, not about whether it adds up to $1.9 trillion, $600 billion, or something in between. Support, not stimulus, is what’s critical in limiting the damage from the Covid restrictions while avoiding future inflation. And once that’s settled, we can start talking about the next big challenge — guiding the long-term shift in economic activity that will be needed after the pandemic is controlled.
While the world debates, markets reflate:

Data: U.S. Department of the Treasury; Chart: Michelle McGhee/Axios
Mortgage rates increased in four of the first six weeks of 2021, data from the Mortgage Bankers Association showed last week.
Nordea notes:
Regarding real interest rates, it might be difficult to understand why we talk about a possible trend reversal when the yield on US 5-year real TIPS reached an all-time low this week. So did Italian government bond yields, by the way. And US junk bond yields traded below 4% for the first time ever. Well, to us forward rates can sometimes be an important precursor of things to come. And 5y5y real swap rates have started to move higher. The divergence compared to spot real rates is similar to the late 2012/early 2013 experience when it marked the bottom for 5-year real rates. (…)
Real rate divergence could spell coming trend reversal
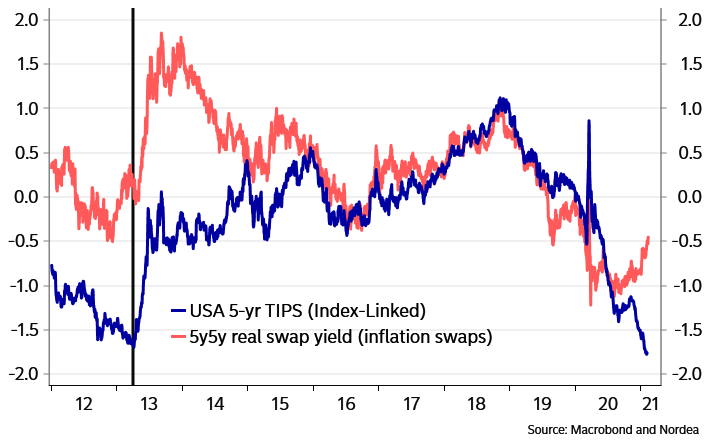
Will inflation expectations lead real rates higher?
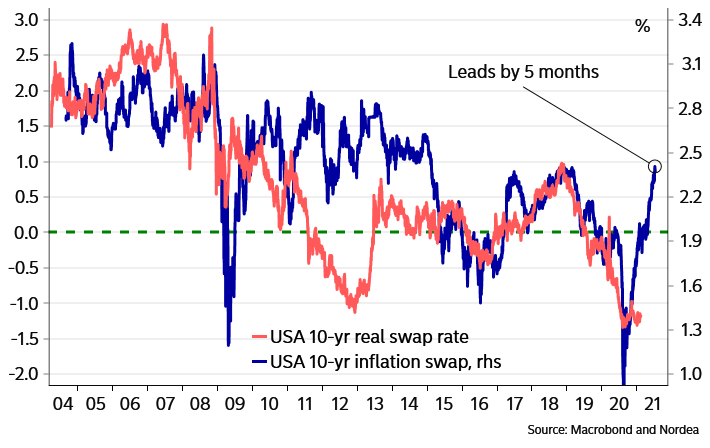
The Nordea team is really looking everywhere to find support for its inflation call:
US small businesses are hiking prices
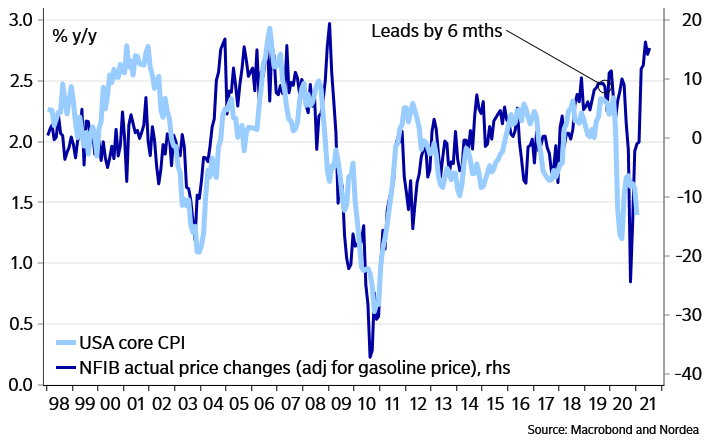
How about this relationship?
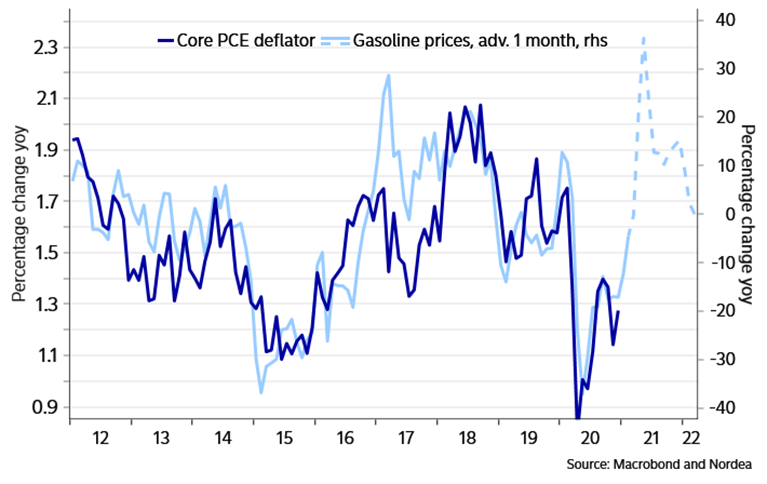
Higher gasoline prices could spill over in “unexpected” ways to core inflation
Meanwhile, liquidity keeps coming at us:
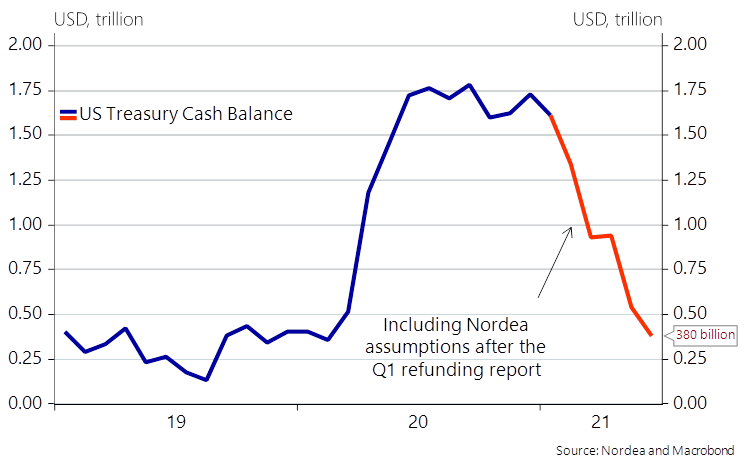
Yellen Shift on Vast Treasury Cash Pile Poses Problem for Powell
Already low short-term interest rates are set to sink further, potentially below zero, after the Treasury announced plans earlier this month to reduce the stockpile of cash it amassed at the Fed over the last year to fight the pandemic and the deep recession it caused.
The move, which aims to return its cash position at the central bank to more normal levels, will flood the financial system with liquidity and complicate Powell’s effort to keep a tight grip over money market rates.
“All this cash from the Treasury’s general account will have to go back from the Fed and into the market,” said Manmohan Singh, senior economist at the International Monetary Fund. “It will drive short term rates lower, as far as they can go.”
While the Fed has pushed its benchmark overnight policy rate down to nearly zero to aid the pandemic-inflicted economy, a drop in short-term market rates into negative territory could prove disruptive, especially for money market funds that invest in short-dated Treasury securities. Banks may also find themselves hamstrung by effectively being forced to hold large unwanted cash balances at the central bank. (…)
Market pros are trying to parse out the implications of what could be an unprecedented surge of liquidity. Some forecast downward pressure on the dollar. Others predict buoyant stock and bond prices. Still others see it mostly as a non-event — except when it comes to the money markets. (…)
In an effort to provide a floor for the money markets, the central bank could lift the rate it pays on excess reserves parked at the Fed by banks and on its reverse repurchase agreements, from 10 basis points and zero, respectively. Tweaking these administered rates is something the Fed has done before. (…) While any rate rise would be portrayed as a technical adjustment, there’s a risk investors wouldn’t see it that way. (…)
Nordea’s take:
(…) We estimate a funding need of >$1400bn for the coming two quarters, which means that the cash account will be taken more than >$1000 bn lower and the commercial banking system will be on the receiving end of the liquidity. If Biden-nomics is implemented, the Treasury will likely increase issuance 1 to 1, but so far they make no assumptions on coming additional stimulus.
This will lead to a drawdown (read underfunding) on the TGA [Treasury General Account] by >$250bn in February, >$400 bn in March and >$400bn again in May, in turn leading the TGA towards sub $500bn territory by the end of June. This is marked game changer for the USD liquidity outlook as commercial banks will be on the receiving end of the liquidity addition.
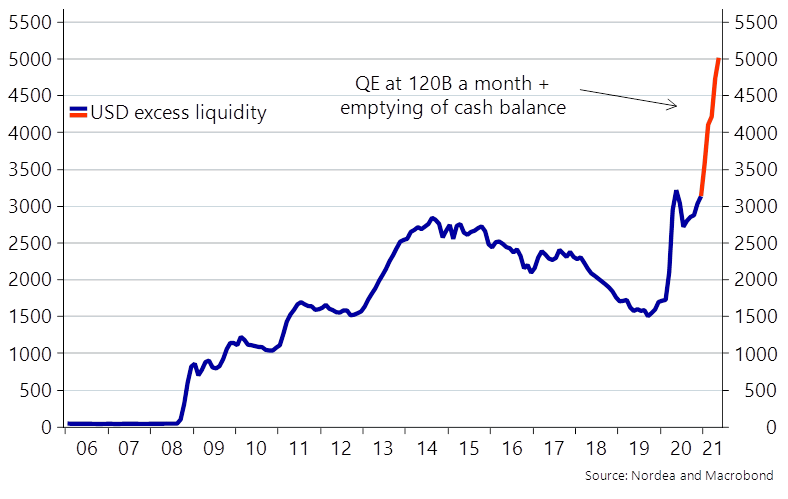
Excess liquidity in the banking system will accordingly increase, and if we include/assume a continued 120Bs a month in QE purchases by the Fed, the total liquidity increase in the first half of 2021 could end up around 1.6-1.8trn – (almost) without historical precedence.
Excess liquidity to increase by a whopping 1.6-1.8trn $
(…) the new refunding strategy should be viewed as positive USD liquidity news and could prove to be a marked change of scenery from the Mnuchin era. Maybe the US Treasury decided to spend the idle cash as the Fed seemed unwilling to monetize debt to the same extent as in 2021 (Fed Review: An unchanged QE pace is a sort of tapering scenario…)? Or else they are simply clearing the way for a huge fiscal package from the Biden/Yellen administration.
The decision also reduces the risk of an unsurmountable pile of debt issuance in Q1/Q2, and even with Biden-nomics included, the issuance to QE ratios now look less scary than prior to the decision to scale down issuance markedly. It is still clear that Fed will not end up “overmonetizing” debt over the next few quarters, if just parts of Bidens fiscal plan comes into fruition over the course of the spring. Higher long-term USD real rates are still on the cards.
A tsunami of USD in the market, along with the Biden checks…

Japan powers out of coronavirus dip with 3% fourth-quarter growth Rise in GDP boosts hopes of mounting a ‘V-shaped’ recovery
SENTIMENT WATCH
The BofA’s sentiment index keeps rising but is still just neutral…

More than $58 billion went into mutual and exchange-traded funds tracking global stocks during the week ended Wednesday, the largest such inflow on record, according to a Bank of America analysis of data from EPFR Global.
-
A gauge of market positioning from JPMorgan shows global investors now are the least fearful of taking risk in markets since the dot-com bubble burst. (Bloomberg)
The mob in action:
A Week Inside the WallStreetBets Forum That Launched the GameStop Frenzy Five days of chaos on Reddit: ‘This is the most fun I’ve ever had losing money’
(…) There was jubilation across WallStreetBets. Shares of GameStop—known by its ticker, $GME—were rising in premarket trading after a mind-boggling rally to $483 the previous week. Members were amped for more. They wondered: What was preventing the stock—which started the year around $18—from topping $1,000?
The weekend had already seen celebrations. WallStreetBets members had purchased billboard ads touting GameStop. In states ranging from Colorado to Minnesota to Georgia to Tennessee, they were seemingly everywhere.
“Bought 4 billboards on I-15 between Provo and Salt Lake City,” u/TheWardOrganist posted over the weekend. “$160 for four days—not even half a share of GME to fuel this rocket to Mars!” (…)
By Monday’s end, one thing was becoming clear: With roughly eight million members at that point—versus fewer than two million a month earlier—WallStreetBets wasn’t the same absurd internet corner it once was. Members were looking out for “imposters.” Fingers were pointed. Posts demanded: Hold the line. (…)
“I’m going to get a lot of hate for this, but I think we need a reality check,” u/Taking_The_Odds commented. “The stock is going to be worthless soon.”
u/TastyCodex93 wasn’t pleased: Don’t post discouraging things, the user said. “[You’re] helping the enemy.”
By midweek, r/WSB users were frustrated. How, some wondered, could $GME be falling? Members had posted screenshots showing they were still buying shares.
There had to be another reason behind the tumble, some thought. A theory emerged: it must be a “short ladder attack.”
According to posts on WallStreetBets, such an attack works like this: To make it appear as if a company’s share price is dropping, bearish short sellers sell nonexistent shares to each other at lower and lower prices. (…)
In reality, there was one big problem with that theory: Short sellers, academics and regulatory experts had never heard of a “short ladder attack.” (…)
“How do you know this is in fact a short ladder attack?” u/GoldilocksRedditor questioned.
“Honestly, it’s getting to the point where every drop is called a short ladder in this sub, when 80% of these people didn’t even know what it was 2 weeks ago,” u/dedriuslol said.
“Well no one did because you literally can’t find a single post on the internet about it before then,” u/Psturtz replied.
“Yeah has anyone here played chutes and ladders before?” u/OCOWAx quipped about the childhood board game. (…)
In just four days, GameStop shares had fallen 84%. (…)
“This is the most fun I’ve ever had losing money,” u/AvalieV posted Friday night. “See you next week.”
What about fundamentals?
Positive earnings revisions at record high. Remember that it needs to continue as everyone agrees that higher equities from here needs to come from earnings and not multiple expansion:

But who cares about earnings now?
- Currently, retail net bullish call options are piling up on the most shorted stocks…

- …even though those are the stocks with the worst fundamental factors.

In the debt market:
Debt Binge Reaches Riskiest Companies Investors’ near-insatiable demand for even the riskiest corporate debt is fueling a Wall Street lending boom, offering lifelines for struggling companies even as the coronavirus pandemic still drags on the economy.
Companies such as hospital operator Community Health Systems Inc. and newspaper publisher Gannett Co. Inc. have issued a record $139 billion of bonds and loans with below investment-grade ratings from the start of the year through Feb. 10, according to LCD, a unit of S&P Global Market Intelligence. More than $13 billion of that debt had ratings triple-C or lower—the riskiest tier save for outright default—about twice the previous record pace.
Despite the onslaught of new bonds, riskier companies can now borrow at interest rates once reserved for the safest type of debt.
As of Friday, the average yield for bonds in the ICE BofA US High Yield Index—a group that includes embattled retailers and fracking companies—was just 3.97%. By comparison, the yield on the 10-year U.S. Treasury note, which carries essentially no default risk, was as high as 3.23% less than three years ago. The 10-year Treasury yielded around 1.2% Friday. (…)
In recent weeks, three businesses have financed dividends to private shareholders by issuing so-called PIK toggle notes—bonds that give the issuer flexibility to pay interest in additional bonds rather than cash. Such deals are hallmarks of hot credit markets, rising to prominence in the years leading up to the 2008-2009 financial crisis. (…)
- More than 15% of debt raised in the U.S. high-yield bond market has carried a rating of CCC or below, the lowest ratings given, since the start of 2021. That’s the highest share since 2007. (FT) And BTW, covenants are just as light as ever.
Some people simply don’t care of all the above:

TECHNICALS WATCH
Of all the technical analysis I survey, Lowry’s Research remains the most intelligent and comprehensive. Lowry’s recognizes the peculiarities of this bull, namely the sharp increase in participation of retail investors and the impact it can have on several technical indicators. Its recent analysis seeks to find if conventional technical readings are twisted and biased by these newcomers. So far, it remains confident that readings of breadth, intensity and participation along with its own proprietary indicators all point to a “dynamic bull market with a long way to go.”
Green Copper
Green copper demand to rise very fast. You can sum up a whole investment theme in one chart and the one below certainly fits that bill. It doesn’t even include cars as EVs require much more copper than traditional gas guzzlers. The reality is that for the green energy transition to be a reality it will require a lot more copper. As copper globally is getting harder to extract as ore body quality declines, this will require much higher prices to incentivise expanded production. If you wonder what that looks like in pratical terms, the chart at the bottom shows the increasingly large production gap. (The Market Ear)
Sanford Bernstein


- BTW: The share of U.S. adults who say they are likely to purchase an EV in the next decade (39 percent) is up 6 percentage points since March 2019. Meanwhile, the share of those who say they are unlikely to do so is down to 49 percent from 56 percent. Interest in hybrids has remained steady during the same period. Read more.
Apple approached Nissan to work on autonomous car project Talks ended after disagreement over branding of iPhone maker’s secretive effort
![]() China targets rare earth export curbs to hobble US defence industry
China targets rare earth export curbs to hobble US defence industry
The U.S. relies on imports of the elements, which are used in everything from smartphones to fighter jets. Rare earths have previously been a focus in the deteriorating trade relationship between China and the U.S.
China’s stock market cap
China has become one of the largest single-country exposures for U.S. investors, according to Seafarer’s data.
“China is now both the second largest economy and the second largest capital market,” Linda Zhang, CEO of Purview Investments, tells Axios.
“Most U.S. investors are exposed to Chinese firms … either directly or indirectly through their brokerage accounts or 401ks.”
Banning Chinese companies from U.S. stock exchanges could push Chinese companies to the Shanghai and Hong Kong stock exchanges.
- In the long run, this would increase the relative power of these exchanges over those in the U.S., Bob Bartel, global head of corporate finance at New York-based financial consultancy Duff & Phelps, points out.


")


")

")
")


