THE INFLATION DEBATE…
FIBER: Industrial Commodity Price Rise Continues The Industrial Materials Price Index, from the Foundation for International Business and Economic Research (FIBER), increased 1.7% during the four weeks ended March 19 pulling prices up roughly one-third y/y.


Fed Will Need to Buy Bonds as Stimulus Boosts Yields, Dalio Says
The recent fiscal stimulus announced by the Biden administration will result in more bond sales to finance the spending, worsening the “supply-demand problem for the bonds, which will exert upward pressure on rates,” Dalio said Saturday on a panel at the China Development Forum, an annual conference hosted by the Chinese government. That will “prompt the Federal Reserve to have to buy more, which will exhibit downward pressure on the dollar,” he said.
He said the world is “very overweighted in bonds,” and they are yielding minus 1 basis point in real terms, which is “very bad.”
“And not only might there be not enough demand, but it’s possible that we start to see the selling of those bonds,” he said. “That situation is bearish for the dollar.”
Fed Chair Jerome Powell said this week that current monetary policy is appropriate and there’s no reason to push back against a surge in Treasury yields over the past month.
Actually, the FOMC statement reads
(…) the Federal Reserve will continue to increase its holdings of Treasury securities by at least $80 billion per month and of agency mortgage‑backed securities by at least $40 billion per month until substantial further progress has been made toward the Committee’s maximum employment and price stability goals.
The Fed is totally aware it is involved in a serious poker game against also pretty powerful players. When Ray Dalio talks bearishly about Treasuries, Bridgewater is probably not currently on the bid and “it’s possible that we start to see the selling of those bonds”.
We know inflation measures will soon be rising and that the Fed is betting the market will tolerate it as “transitory”.
We also know that “transitory” will be strongly debated…
…while Treasury issuance will be huge.
We also know that the Fed cannot lose this multi-faceted game: “transitory” inflation it must be since Powell said the FOMC will definitely not use “precautionary”, pre-emptive policies (it will take “actual progress, not forecast progress” to convince the Fed to change tack). Bears will feed on that.
And Powell has defined “actual progress” as being unemployment at 3.5%, where the red line stands below. Progress is reaching the historical best!

Can anybody seriously expect near-zero interest rates at record unemployment?
Unless Lacy Hunt proves right and record indebtedness keeps the economy and inflation pretty weak. “Transitory” applied to GDP growth.
Via Steve Blumenthal’s On My Radar:
On CNBC Wednesday evening, [former Dallas Fed president Richard] Fisher was asked how important the Fed’s move from a proactive Fed to a reactive Fed was, and whether such a move was dangerous.
Fisher’s reply:
“It is important, and there is a risk here because you have to remember it takes a lot of time for monetary policy to work its way into the real economy, I’m not talking about market reaction. And if you are reactive, first of all data is out of date by the time you get it, even though we’re getting better at getting contemporary data. If you are reactive, (Fed policy) is going to take time to work into the economy and I think that’s the risk rather than anticipating and using your judgment, going forward, as to what’s likely to happen if, let’s say the bond market determines the 10-year rate.
If the bond market begins to price in some inflationary pressure. The Fed does its work, gets its data, finds out there is more than transitory inflation in play, then they have to tighten or do whatever they need to do. It (policy) takes a while to work into the economy and it (being reactive) will therefore be, I think, be less effective. That’s a risk they’re running.”
CNBC asked Fisher, “There’s a lot of talk about transitory inflation and how far they would let it go. Coming back ultimately to this 2% inflation target, how far do you think they would let inflation go, before they felt the need to do something?”
Fisher’s answer:
“Here’s the problem: If you’re a supply-side economist, you’re also thinking about the kind of cost pressures that are now underway, raw materials, freight—I can go on and on and on. However, a business operator also has to worry about what other new costs are going to be imposed—higher taxes, perhaps unionization, minimum wage efforts, etc.
So, on top of what they’re already seeing, they are likely or possibly going to price in a reaction, and it’s very rare in my experience to have businesses price in an increase, and then take it back. So he’s right, in terms of, compared to the low levels of which we were a year ago.
- But the problem is it’s the dynamic of going forward and how do businesses react? So that’ll determine how transitory it is.
- I think what the market is doing is questioning that premise. Look at the 10-year and a five-year yields, the world is questioning that premise.
Will we have transitory inflation, or will it become more embedded? And this isn’t 4 or 5% inflation, I’m just saying above the two-plus level, which the Fed won’t articulate, and I understand why he won’t… But you can build in a behavioral reaction here, and then the Fed has to take the time to respond, and it then takes time for that to play its way through the economy. Which means it could feed its way into itself, that’s the point I’m trying to make.
Fisher concluded, “What I’m more interested in is how the market perceives this.”
Meanwhile, Bank of America reminds us the YtD issuance of Treasuries ($861bn, on its way to $4.45tn this year), IG/HY bonds ($514bn), stocks/SPACs ($178bn), “all on pace for record highs, so bond & equity supply is annualizing a record $7.6TN.” Putting the twin deficit in perspective:

Supply > demand + uncertainty + ?confidence? = correction/bear:

Summers Sees ‘Least Responsible’ Fiscal Policy in 40 Years
(…) In his latest attack on the recent rush of stimulus, Summers told David Westin on Bloomberg Television’s “Wall Street Week” that “what was kindling, is now igniting” given the recovery from Covid will stoke demand pressure at the same time as fiscal policy has been aggressively eased and the Federal Reserve has “stuck to its guns” in committing to loose monetary policy. (…)
He said there is a one-in-three chance that inflation will accelerate in the coming years and the U.S. could face stagflation. He also saw the same chance of no inflation because the Fed would hit the brakes hard and push the economy toward recession. The final possibility is that the Fed and Treasury will get rapid growth without inflation.
“But there are more risks at this moment that macroeconomic policy will cause grave risks than I can remember,” said Summers, who is a paid contributor to Bloomberg. (…)
Bond Rout Hits Safest Company Debt Returns on investment-grade corporate bonds have faltered and spreads have widened amid broader selloff
(…) Bonds from highly rated companies have lost more than 5.4% this year, counting price changes and interest payments, through March 18. That is their second-worst start in data going back to 1996, the worst being last year’s pandemic-fueled selling, according to Bloomberg Barclays data. That compares with a 0.2% return for high-yield bonds and a 1.7% gain in corporate loans to highly indebted borrowers. (…)
At around 8 1/2 years, the duration on the Bloomberg Barclays U.S. investment-grade bond index implies an 8.5% change in price for every 1% move in interest rates. That is nearly 40% higher than the average duration from 1992 to 2008, according to data compiled by Morgan Stanley Wealth Management, and more than three years higher than it was in the trough of the 2008-09 recession. (…)
Credit quality has fallen to its weakest point in decades. Companies including hotel operator Marriott International Inc. and furniture company Steelcase Inc. suffered downgrades after pandemic borrowing, leaving more than 50% of the U.S. market now at the lowest rung of the investment-grade ladder, according to Morgan Stanley. (…)
With billions of dollars of debt outside the U.S. producing negative returns after taking inflation into account, more foreign investors have turned to the U.S. investment-grade market. (…)

For foreign investors’ interest:

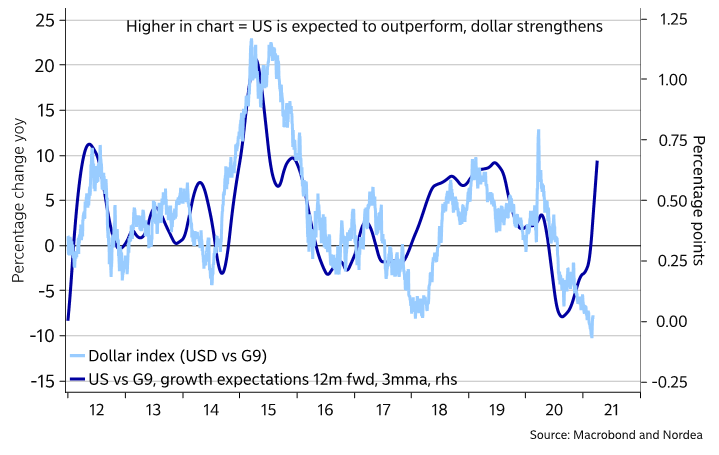
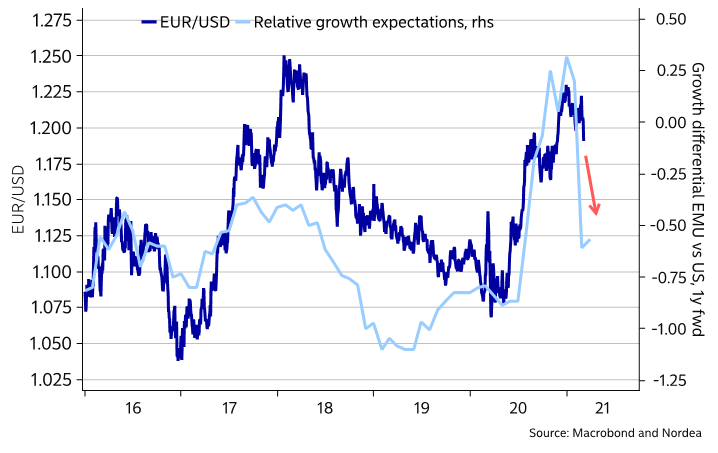
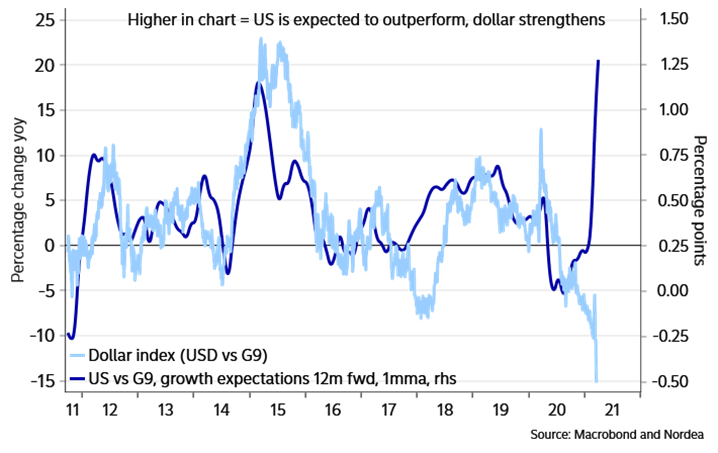
On the other hand, if people continue to focus on relative growth rather than financials the USD could actually strengthen before it weakens as Nordea argues:
In terms of relative growth forecasts, or in term of revisions to said forecasts, the USD should be in a very strong spot – rising 20% yoy instead of falling 15% yoy(!).
USD/G9 vs relative growth
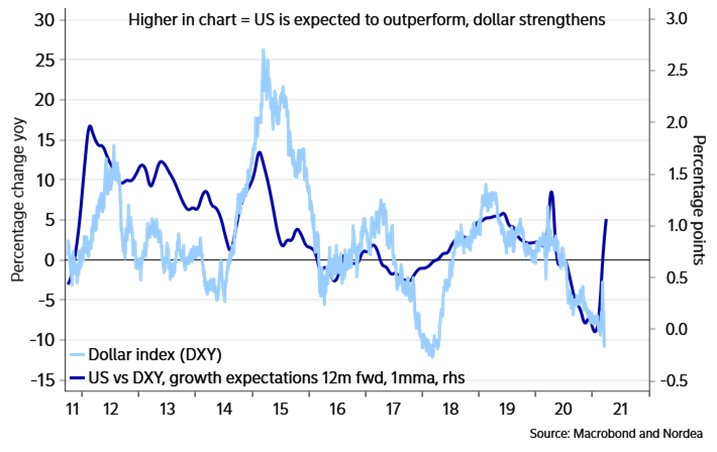
Also when we weigh the forecasts with the DXY weights, the USD should be gaining rather than weakening – though not as much as when we look at an equal-weighted average of G9 forecasts (since these are held down by Sweden, Switzerland and Norway). This is not the prettiest chart we have made, but we figured we’d show it anyway.
Dollar index (DXY) vs relative growth
Back to interest rates, more uncertainty comes from the Fed’s decision last week not to extend the SLR. Bloomberg explains (my emphasis):
As the March 31 end of the waiver to something called the supplementary leverage ratio (SLR) approached, many banks argued that it should be extended, lest they be forced to retrench while the economy is still fragile. Bank critics, including Senator Elizabeth Warren, pushed to end the break, noting that banks were managing to return tens of billions to shareholders through buybacks and dividends. The Fed decided to let the waiver lapse, but said it would propose other ways of addressing the banks’ concerns. (…)
When the Fed purchases Treasuries from a money manager, those securities become an asset on the central bank’s balance sheet. The seller deposits the cash it received at a bank, and the bank in many cases adds it to the reserves it holds at the Fed. That makes the money an asset for that bank and a liability for the Fed. In other words, the Fed’s big purchases boosted the asset levels of U.S. banks. If the SLR had been left in place, those increased assets would have meant that banks needed to set aside more capital as reserves.
The last thing the Fed wanted during that critical time was for banks to be pulling money out of the economy. So it eased the SLR so that banks’ excess capital could be deployed to struggling businesses and households. The continuing disruption in Treasuries was also a major factor in the decision. The move allowed banks to help stabilize that market, while maintaining funding for short-term borrowing arrangements known as repurchase agreements.
Wall Street pointed out that the pain from coronavirus is far from over. JPMorgan Chase & Co. cautioned that it might have to shun customer deposits if tougher rules are reinstated — an awkward situation just as the big Covid relief bill signed by President Joe Biden in mid-March pumped billions into consumers’ accounts. Analysts have also tied recent bouts of wild trading in the $21 trillion Treasury market tied to concerns that banks will be forced to hold less government debt, even potentially selling hundreds of millions of dollars of their holdings. By some measures, the SLR break allowed banks to expand their balance sheets by as much as $600 billion. (…)
{The Fed] concluded the threat that Covid-19 poses to the economy isn’t nearly as severe as it was a year ago. But the agency also said that it’s going to soon propose new changes to the SLR to address the recent spike in bank reserves triggered by the government’s economic interventions. Central bank officials said they don’t want the industry’s overall capital levels to change. The Fed did provide another consolation, though, by more than doubling to $80 billion the maximum overnight reverse repo activity a participant can execute through the central bank’s facility. That could absorb some of the pressure of too much government stimulus cash sloshing through the system by giving money market funds a place to put it.
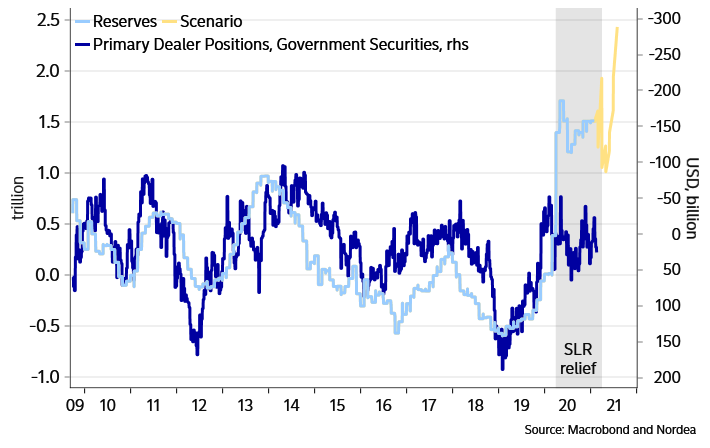
Nordea illustrates the risk to Treasuries:
More reserves might trigger selling of USTs (and higher yields?)
Meanwhile, rising Treasury yields are pushing mortgage rates up while house prices are exploding:

But the market doesn’t care:

(Dave Wilson’s Chart of the Day)
Return of the Bond Vigilantes? Watch 3EDGE Asset Management’s Steve Cucchiaro 11 minute video.
- A Fed With No Fear of Inflation Should Scare Investors Markets are only just waking up to the implications of an important shift in Federal Reserve policy
(…) A hawkish Fed can counteract a big-spending White House by hiking rates. But Mr. Powell has committed to no hikes until inflation is sustainably at the Fed’s target and the country is at full employment. Most policy makers think that means at least three more years of near-zero rates.
The question is what happens if the target is reached earlier. If inflation picks up fast, say to 3%, will the Fed be willing to hike rates early and risk a rise in unemployment? What about 4%?
(…) pushing up unemployment to restrict inflation will hit that group the most. Politically that makes tighter monetary policy harder to justify. (…)
However, everything is in place for at least a bout of market anxiety about inflation. (…)
Yet, a permanent regime shift clearly isn’t priced into Treasurys. Even after last week’s jump, the 10-year still only yields around 1.7%, and long-term bond market inflation expectations have been stable. Investors, in the main, accept Mr. Powell’s pitch, and think that after a brief period of higher price rises, the Fed will be willing to assert its independence and keep inflation in line.
If the market loses confidence, long-dated Treasury yields should ramp up even faster, the dollar would slide and stocks most reliant on profits far in the future, think Tesla, will be hit hard.
Real inflation scares hurt.
Speaking of long-dated equities, Richard Bernstein reminds us to beware investing in stories without considering how much these stories are actually worth (video) [what my investment life is all about…].
Go international as Steve Cucchiaro suggests? One problem is with countries sporting high USD debt and rising inflation. There have been 8 global rate hikes YtD. “The net interest burden of emerging-market governments is more than three times that of their developed-market counterparts, while emerging markets are both more inflation-prone and dependent on external financing” (Nomura)

We have seen this movie several times before:
- Turkish Lira Falls After Erdogan Fires Central Bank Chief Turkey’s currency is down more than 10%, putting it on course for its biggest single-day selloff since 2018, after the abrupt replacement of the country’s top central banker.
And that one as well:
- New Realtors Pile Into Hot Housing Market Surging prices are persuading tens of thousands more Americans to try their hands at selling real estate, but supply is extremely tight. There are more agents than homes for sale in the U.S.
PROFIT MATTERS
From Refinitiv/IBES:
Through Mar. 19, 498 companies in the S&P 500 Index have reported revenue for Q4 2020. Of these companies, 73.3% reported revenue above analyst expectations and 26.7% reported revenue below analyst expectations. In a typical quarter (since 2002), 61% of companies beat estimates and 39% miss estimates. Over the past four quarters, 67% of companies beat the estimates and 33% missed estimates.
In aggregate, companies are reporting revenue that are 3.8% above estimates, which compares to a long-term (since 2002) average surprise factor of 1.0% and the average surprise factor over the prior four quarters of 1.8%.
The estimated earnings growth rate for the S&P 500 for 20Q4 is 4.1%. If the energy sector is excluded, the growth rate improves to 8.0%. The estimated revenue growth rate for the S&P 500 for 20Q4 is 2.7%. If the energy sector is excluded, the growth rate improves to 6.0%.
The estimated earnings growth rate for the S&P 500 for 21Q1 is 22.9%. If the energy sector is excluded, the growth rate improves to 23.8%.


Trailing EPS are now $142.64. Full year 2021: $175.54e. Full year 2022: $202.11e.


TECHNICALS WATCH
My favorite technical analysis firm remains bullish seeing a broadening of the market, gradually out of tech into a number of cyclical sectors. It notices rising supply, however, but, using the Fed’s positive narrative, qualifies it as transitory as “enthusiastic demand” takes care of the waning interest in Technology.
That said, tech stocks jumped 2.9% last week. Yet, INK Research notes the “depressed level of Tech insider sentiment” approaching its 10-year low.
Now, depressed insider sentiment does not necessarily foreshadow depressed tech stock share prices. When it hit its 10-year low in November 2013, it was a false signal in no small part due to QE by the Fed. Importantly, at the time the XLK was riding comfortably above its 200-day moving average (+10%). Low bond yields plus momentum allowed tech stocks to continue sailing.
The next time we came close to the 2013 lows was in March 2019, and it was a different story with the XLK straddling its 200-day. The ETF subsequently traded flat for 6 months.
With the indicator approaching its low again, the XLK is sitting firmly above its 200-day by more than 10%. However, we may not be in a repeat of 2013. Back in 2013, bonds were still in their multi-year bull market. That bull market appears to be over which increases the risk that the XLK will soon test its 200-day as rising long yields pressure valuations. As such, we will be watching to see if the ETF heads back below the 200-day. Should that happen in conjunction with ultra-low insider sentiment, that could indicate the formation of a significant peak in Technology stocks.


Airlines struggle to take off in face of $300bn debt headwinds Recovery may take years as industry grapples with rescue finance and state loan bills
Revenue for the top seven airlines is down 67% from a year ago, and U.S. passenger airlines collectively are burning cash at a rate of $150 million a day, according to Airlines for America.
- They’ve added $60 billion in new debt over the past 12 months, and analysts say it will take years to pay down their current $170 billion debt load, limiting future growth.
- The industry has received a total of $54 billion for payroll support since the pandemic hit.
Equity investors couldn’t care less for these mundane details:
U.S., China Should Cooperate on Supply Chains: Ex-IMF Official
(…) “The U.S. and China should and can work together on stabilizing global supply chains,” Zhu Min, previously deputy managing director of the IMF, said Saturday at the China Development Forum, an annual conference hosted by the Chinese government. He cited rising geopolitical tensions that threaten to hurt global economic growth and financial stability as the major reasons for better cooperation.
On monetary policy, it’s also very important for the two sides to work closely, he said, adding they should coordinate if any further stimulus package is planned since inflation is coming back faster and stronger than expected.
Other areas of collaboration include global trade, governance issues and the digital economy, he said. (…)
- Divisive Alaska Meetings Test U.S. Ties to Beijing A divisive exchange between senior foreign policy officials exposes the deepening distrust between the two powers.
COVID-19
- AstraZeneca US trial shows 79% efficacy against Covid Trial found no increased risk of blood clots and 100% efficacy against severe or critical disease

")
- Royal Caribbean Schedules June Start for Trips From the Bahamas
- Hotels Show Signs of Life With Long-Awaited Rebound in Sight
VIRTUAL IRREALITY
Whether you’re shaking your fist like an old man with kids on his lawn, or a true believer in Non-Fungible Tokens (NFTs) looking to make millions, there’s a booming ‘virtual reality’ real-estate market where people are buying and selling parcels of ‘land’ across several online “metaverses” – where people are building virtual hotels, stores, and other properties in the hopes of increasing their value.
And if you’re an accredited investor willing to drop at least $25,000 – and you’re invited – there’s a fund for those who want to get in on the NFT real estate market. (…)
Bloomberg unpacks:
Plots sell daily in online worlds such as Decentraland, a virtual place with its own economy, currency and social events calendar, accessible to anyone with a web browser. And values for such assets are multiplying.
This year through March 15, the average price paid per parcel in Decentraland was $2,703 — more than triple what it was in 2020, according to NonFungible.com, which tracks the sales. Land prices quadrupled in the metaverse called Cryptovoxels, from $821 a parcel last year to $3,895 in the first two and half months of 2021.
Republic, meanwhile, has purchased over 30 parcels across four metaverses, and is in talks with a real-world hospitality brand to co-develop a hotel and bar on one of those sites. (…)
We assure you, this is real. This week, contemporary artist Krista Kim recently sold an NFT-minted digital house, called “Mars House,” for 288 ether – valued at more than $500,000 based on Friday’s trading price. (…)
“For me, I actually foresee that we will be living in an augmented reality lifestyle within a very short period,” Kim added, saying it could happen in “a couple years.” (…)
The new owner of Mars House will be able to upload the property to various metaverses.
In February, meanwhile, eight lots of virtual real estate sold for a combined $1.5 million on gaming platform Axie Infinity, according to NonFungible.
“There is obviously some fear-of-missing-out phenomenon behind this,” says NonFungible COO, Gauther Zuppinger, in an email to Bloomberg. “The best, rarest places are almost all purchased. The secondary market shows that the first buyers sell their assets for way more than the initial price.” (…)\
“Buying land today in virtual worlds may end up feeling a lot like buying land in Manhattan in the 1750s,” says Yorio. “There is massive growth ahead, and now is the time to get in on the ground floor.“
Wait, wait! There’s more!