U.S. Light Vehicle Sales Continue to Strengthen in April
U.S. sales of light vehicles increased last month as COVID-19 vaccines became more readily available. The Autodata Corporation reported that light vehicle sales during April rose 2.5% to 18.54 million units (SAAR) [consensus was 17.6M] and more than doubled y/y. So far this year sales have risen 13.0%.
Auto sales increased 4.5% (107.4% y/y) last month to 4.21 million units, the highest level since February of last year. Purchases of domestically-produced cars rose 3.0% (87.1% y/y) to 2.75 million units. Sales of imported autos jumped 7.4% (160.7% y/y) to 1.46 million, the highest level since February 2018.
Sales of light trucks rose 1.9% ( 113.6% y/y) during April to a record 14.33 million units. Purchases of domestically-made light trucks held steady (106.2% y/y) at 10.97 million units. Sales of imported light trucks increased 8.7% (141.7% y/y) to a record 3.36 million units.
Trucks’ share of the light vehicle market eased to 77.3% but remained near the record.
Imports’ share of the U.S. vehicle market increased last month to 26.1% from 22.4% twelve months earlier. Imports’ share of the passenger car market rose to 34.7% in April. Imports’ share of the light truck market strengthened to 23.4%. (Haver Analytics)
According to CalculatedRisk, April’s was the highest sales rate since 2005 and up 8% from the pre-pandemic high. Sales-to-date are up 1.9% compared to the same period in 2019.

David Rosenberg warns that
We have only been at this level five other times in the past (September 1985, September 1986, February 2000, October 2001, and July 2005) and sales plummeted on four occasions over the course of the next twelve months (the average decline was 13%). On a six-month basis, they declined sharply each time (-45.5% at an annual rate after the September 1985 surge; -23.9% after the September 1986 blowout; -18.2% in the six months after the February 2000 bounce; and -27.2% following the July 2005 run-up).
What Rosie omits to consider is where the savings rate was in each of those respective peak dates: 1985: 7.3%, 1986: 7.2%, 2000: 4.8%, 2001: 3.4%, 2005: 2.2%.
March 2021: 27.6%.
According to Markit, “the average age of light vehicles in operation in the US has risen to 11.9 years this year, about one month older than in 2019. (…) While work from home policies may continue for some time, there also has been increased reluctance in the use of public transit and ride sharing, and many consumers are opting for road trips instead of air travel for summer vacations.”
![]() The remaining problem is inventory which was at a 10-year low in March and no doubt declined further in April with the strong sales and idled plans due to the chip shortage. Wards is estimating that sales in May and June could be as low as 14.5M units SAAR. Rosie will prove right for a while.
The remaining problem is inventory which was at a 10-year low in March and no doubt declined further in April with the strong sales and idled plans due to the chip shortage. Wards is estimating that sales in May and June could be as low as 14.5M units SAAR. Rosie will prove right for a while.
Also noteworthy for the Biden administration:

The Chase consumer card spending tracker suggests goods demand remained solid through April 30 after a very strong March:


- Consumer Demand Drove U.S. Imports to Record High in March Trade deficit widened to $74.4 billion as imports were up 6.3% and exports rose 6.6%
(…) In March, the U.S. deficit in trade in goods with China, the largest U.S. trading partner, widened sharply to $36.9 billion from $30.2 billion in February. Imports from China surged 19% to $48.3 billion, while exports to the country rose 8.6% to $11.3 billion.
As strong consumer appetite for goods kept American factories humming, imports of semiconductors—critical components of products ranging from autos to washing machines—grew 26% from February to $6.3 billion.
“For all the talk of supply disruptions in the global semiconductor industry holding back U.S. production, particularly in the auto sector, this highlights that much of the problem is instead the huge and unanticipated rebound in demand,” Andrew Hunger, senior U.S. economist for Capital Economics, said in a research note.
U.S. exports of semiconductors to the rest of the world also rose in March to $5.24 billion, up 8.5% from February. (…)
Job Growth Rate in Small Businesses Increases Significantly in April
The Paychex | IHS Markit Small Business Employment Watch, compiled from aggregated payroll data of approximately 350,000 clients on the Paychex human capital management (HCM) suite, is out with the latest numbers.
The Small Business Jobs Index increased 4.33 percent from March to 98.34 in April, a positive indicator of job growth returning to pre-pandemic levels. The increase is in part driven by the comparison period of one year ago (detailed below). Each region, state, and metro area analyzed in April 2021 saw employment gains. The South leads all regions at 99.42.
“A return to full employment is not complete. However, the Small Business Jobs Index returned to its pre-pandemic peak, seen in February 2020,” said James Diffley, chief regional economist at IHS Markit. “We’re encouraged by the progress in job growth we see in the April numbers.”
“The country has been waiting for a significant increase in job growth since this time last year—and April delivered. Many businesses are finally able to resume regular operations with the onset of vaccine availability for all U.S. adults,” said Martin Mucci, Paychex president and CEO. “The significant growth seen in the leisure and hospitality industry, over the last two months, will only accelerate with the upcoming financial relief available by the Restaurant Revitalization Fund grants made available this week by the SBA.”
In further detail, the April report showed:
- Job growth improved in all four U.S. regions in March, as well as in all 20 states, and all 20 metros analyzed.
- The South continues to lead all regions in small business job growth.
- Texas took the top ranking for job growth among states.
- Leisure and hospitality saw the greatest improvement among industry sectors, but construction still has the highest index at 100.72.
- Leisure and hospitality and construction both also saw a significant gain in hourly earnings growth, 6.78 percent and 4.00 percent, respectively.
Paychex business solutions reach 1 in 12 American private-sector employees, making the Small Business Jobs Index report an industry benchmark. The national jobs index uses a 12-month same-store methodology to gauge small business employment trends on a national, regional, state, metro, and industry basis.

COMPOSITE PMIs
Eurozone private sector growth continues to strengthen in April
Growth of the eurozone private sector economy improved during April, with latest data indicating the fastest expansion since last July and the second best in over two-and-a-half years. This was highlighted by the IHS Markit Eurozone PMI® Composite Output Index recording 53.8, up from 53.2 in March.
The index has now signalled growth for two consecutive months and latest data indicated concurrent activity gains in both manufacturing and service sectors. Goods producers continued to lead the way, with output rising at a rate little-changed on March’s survey record. Service sector output returned to growth following seven months of continuous contraction, although the gain was only marginal overall.
Germany again led the way in terms of overall growth, expanding at a marked pace with growth underpinned by a strongly performing manufacturing economy.
Spain meanwhile saw growth improve to its strongest for over two years as service providers experienced a bounce in activity ahead of planned business reopening and in line with expectations of a relaxation of Covid restrictions.
France and Italy meanwhile registered modest growth of overall private sector output during April, with the gain in France the best seen in the past eight months.
Supporting the increase in overall eurozone private sector activity was a second successive monthly rise in new orders, the strongest recorded for over two-and-a-half years. Higher sales were reported in both domestic and international markets with foreign business rising at a rate little-changed on March’s series record level.
With new work continuing to increase in April, firms registered a further rise in backlogs of work, especially those based in manufacturing where delays in the delivery of inputs constrained production. The rate of growth was also the sharpest for 39 months, and helped explained why companies took on additional workers. April’s survey indicated that staffing levels rose for a third month in succession and to the strongest degree for two years.
Growing confidence in the outlook also encouraged firms to bolster payroll numbers. April’s survey indicated that confidence about the outlook was at its highest since composite data were first available in mid-2012.
Meanwhile, cost inflation intensified during April with latest data showing that operating expenses rose to the greatest degree for ten years. In part reflective of growing market demand, firms were able to pass on some of their increased costs to clients in the form of higher charges. Latest data showed that output prices rose to the greatest degree since February 2018.
The IHS Markit Eurozone PMI® Services Business Activity Index edged back above the crucial 50.0 no-change mark in April to signal the first growth in service sector activity since August 2020. That said, at 50.5, up from 49.6 in the previous month, the rate of expansion signalled by the index was marginal.
There was some notable divergences in performance by country. Whereas Spain registered a marked rise in activity, Germany and Italy experienced contractions. Marginal growth was seen in France.
The weak increase in regional activity overall reflected ongoing softness in levels of incoming new business. Although only marginal, new orders overall declined for a ninth successive month. Foreign demand remained a source of weakness: new export business fell for a thirty-second successive month.
Nonetheless, increasing confidence about the future led to a strengthening of business expectations to their highest level since May 2017. Positive projections for a rise in activity over the coming months helped to support a solid increase in employment.
Finally, operating expenses rose again in April and to the greatest degree for 15 months. Several firms raised their charges in response, although competitive pressures generally thwarted these efforts. This meant that output charge inflation remained marginal.

The U.S. Services PMI is out later today. Here’s the Australian Services PMI as a proxy of how services behave upon reopening:
The seasonally adjusted Business Activity Index rose to 58.8 in April from 55.5 in March, signalling a further sharp increase in activity. The latest increase extended the current sequence of expansion to eight months and was the steepest seen in the survey history. Panellists noted that the easing of COVID-19 restrictions had provided a further boost to total activity.
Notably, new business inflows received by Australian service providers also rose at the sharpest pace in the five-year series history. Anecdotal evidence indicated that the easing of lockdown restrictions contributed to an improvement in consumer confidence and demand. The Australia-New Zealand travel bubble, briefly in operation in the second half of April, in part supported a renewed rise in new export sales, despite most travel restrictions remaining in place.
Stronger demand conditions led firms to expand their workforce numbers for the sixth month running in the latest survey period. The pace of job creation was solid and matched February’s series record. Despite a further and faster increase in employment, business capacity remained strained as backlogs of work rose for the third straight month. Input delivery delays were also cited as a factor contributing to the increase in outstanding business.
Concurrently, price pressures further intensified in April as Australian service providers experienced an eleventh straight monthly increase in cost burdens. The rate at which input prices rose accelerated to the fastest since July 2017’s survey high. The increase in cost burdens was often linked to greater raw material prices and wage costs. A number of firms noted efforts to partially pass on higher costs to clients, with output charges rising at the fastest pace since December 2017.

GOOD BOOM, ZOOM DOOM!
JPMorgan CEO Sees Economic Boom Ahead
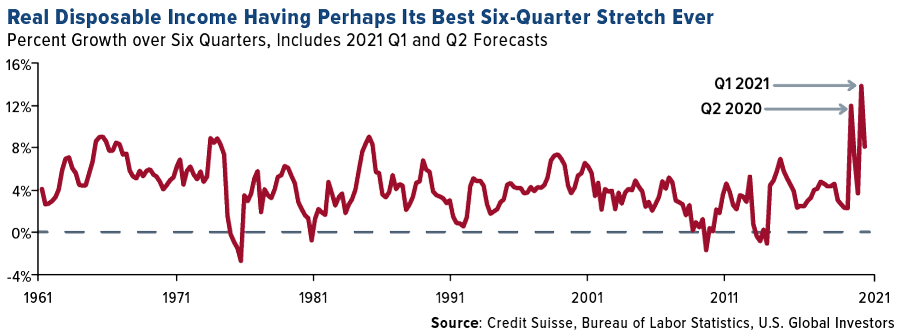
The leader of the nation’s biggest bank reiterated his recent optimism that the economy is poised to emerge from the pandemic on fire, with growth that could stretch into 2023. Mr. Dimon has in recent weeks said that the massive government stimulus, the widespread vaccine rollout and the actions of his corporate and consumer clients have him believing in a possible “Goldilocks” economy of fast growth coupled with mild inflation. (…)
The projected growth over the next 12 months is now double what the bank expected three months ago, expanding to 4.3% by the second quarter of 2022. (…)
“Our government, when they point out the issues that we should do better, they’re right,” Mr. Dimon said. “But if we just throw a lot of money at it and it’s all wasted again…we will be in big trouble.” (…)
More JPMorgan employees will return to the office starting this month, though Mr. Dimon acknowledged they aren’t all happy about it. But the remote office, he said, doesn’t work for generating ideas, preserving corporate culture, competing for clients or “for those who want to hustle.”
“We want people back at work and my view is some time in September, October, it will look just like it did before,” Mr. Dimon said. “Yes, people don’t like commuting, but so what?”
To Mr. Dimon, commuting is better than the alternative.
“I’m about to cancel all my Zoom meetings,” he added. “I’m done with it.”
Yellen Backs Off Comment on Interest Rates, Inflation Treasury Secretary Janet Yellen walked back her remarks earlier in the day that rates might need to rise to keep the economy from overheating, adding that she didn’t think there is going to be an inflation problem.
Treasury Secretary Janet Yellen said Tuesday she is neither predicting nor recommending that the Federal Reserve raise interest rates as a result of President Biden’s spending plans, walking back her comments earlier in the day that rates might need to rise to keep the economy from overheating.
“I don’t think there’s going to be an inflationary problem, but if there is, the Fed can be counted on to address it,” Ms. Yellen, a former Fed chairwoman, said Tuesday at The Wall Street Journal’s CEO Council Summit.
Ms. Yellen suggested earlier Tuesday that the central bank might have to raise rates to keep the economy from overheating, if the Biden administration’s roughly $4 trillion spending plans are enacted. (…)
“It may be that interest rates will have to rise somewhat to make sure that our economy doesn’t overheat, even though the additional spending is relatively small relative to the size of the economy,” she said in a prerecorded interview at the Atlantic’s Future Economy Summit. (…)
Ms. Yellen’s remarks were unusual because White House officials typically refrain from commenting on monetary policy. Such was the norm for decades, starting in the Clinton administration, until President Trump began weighing in on the Fed’s actions and urging Mr. Powell to cut rates before the pandemic.
“If anybody appreciates the independence of the Fed, I think that person is me,” she told the Journal, adding that it is entirely up to the central bank how it manages monetary policy. “It’s not something I’m going to give opinions about.”
But she kind of did, until the market told her she shouldn’t.
- Yellen’s Interest-Rate Comment Illustrates the Market’s Greatest Worry
- Everything Screams Inflation Investors are woefully unprepared for what may be a once-in-a-generation shift in the market
We could be at a generational turning point for finance. Politics, economics, international relations, demography and labor are all shifting to supporting inflation. After more than 40 years of policies that gave priority to the fight against rising prices, investor- and consumer-friendly solutions are becoming less fashionable, not only in the U.S. but in much of the world. (…)
1) Central banks, led by the Federal Reserve, are now less concerned about inflation
2) Politics has shifted to spend even more now, pay even less later
3) Globalization is out of fashion
4) Demographics worsen the situation. One of the advantages of globalization was that it added foreign workers as the domestic workforce expanded more slowly. (…) When workers have less competition, they can demand more for their labor as fear of factories moving elsewhere is reduced.
5) Empowered labor puts upward pressure on wages and prices. (…) unions are strongly supported by Mr. Biden, and organization is likely to become easier.
Douglas Porter, chief economist at BMO Capital Markets in Bloomberg:
“One always has to be careful not to overplay a few anecdotes, and project that onto the broader economy,” Douglas Porter, chief economist at BMO Capital Markets, said in a May 1 report. “But as the anecdotes accumulate, they eventually become data.”
Porter pointed to a sampling of 10 recent datasets, including U.S. employment costs, Canadian wages and still-soaring shipping costs.
“As rising inflation risks suggest,” he said, “when you run things hot, you risk getting burned.”
Sam Zell Buys Gold With Inflation ‘Reminiscent of the ‘70s’
(…) “Obviously one of the natural reactions is to buy gold,” he said in a Bloomberg Television interview. “It feels very funny because I’ve spent my career talking about why would you want to own gold? It has no income, it costs to store. And yet, when you see the debasement of the currency, you say, what am I going to hold on to?” (…)
“Oh boy, we’re seeing it all over the place,” Zell said of inflation. “You read about lumber prices, but we’re seeing it in all of our businesses. The obvious bottlenecks in the supply chain arena are pushing up prices. It’s very reminiscent of the ‘70s.” (…)
“Right now, oil and gas is not priced to reflect the risk of what’s going on, whether it be in the EV world, a climate changed world,” he said. “As recently as a couple of years ago I thought the risk-reward ratio was appropriate. It’s clearly become very inappropriate as our political situation has changed.” (…)
“Everybody’s worried about going back to work and office-space occupancy. I don’t think that’s really an issue,” he said. “The problem is that, before the pandemic, we were dealing with an oversupply of office space. Obviously the pandemic hasn’t reduced that oversupply and has probably encouraged it accordingly.”
Stores also present challenges, he said, given that the U.S. already had more retail space per person than the rest of the world before Covid-19, and shoppers increased their reliance on e-commerce while stuck at home during the pandemic.
“Street retail today is like a falling knife, and you don’t know how far it goes down,” he said. While that “doesn’t mean the best malls aren’t going to perform,” there’s a “huge amount of real estate that’s going to have to be reprogrammed in one form or another.”
The challenges faced by hotels are more of a temporary problem over the next three to four years, Zell said. “We will see a slow recovery in business travel,” he said. “In the interim period of time, it’s going to be a slow recovery, and hotels are big overhead things and running them at less-than-optimum occupancy is a very expensive scenario.”
Chip Crisis Deepens at Jeep Maker Stellantis The auto maker slashed planned production by 11% in the first three months of the year due to the global semiconductor shortage and warned of additional cuts in the weeks ahead as the crisis lingers.
SENTIMENT WATCH
RBC revises outlook for U.S. stocks – and it’s not alone
Royal Bank of Canada has become the second major bank in less than a week to raise its year-end target for the S&P 500, as the blockbuster first-quarter earnings season continues to roll out.
RBC follows Credit Suisse, which bumped up its target on April 30. Even Citigroup, one of the most bearish of the big Wall Street banks, is sounding a little more optimistic about where the benchmark U.S. index may be heading later this year.
Lori Calvasina, head of U.S. equity strategy for RBC Capital Markets, on Tuesday lifted her 2021 S&P 500 target to 4,325, up from the 4,100 prediction she issued in January. That came alongside her S&P 500 earnings per share forecasts rising to US$187 for 2021 and US$200 for 2022 (up from US$177 and US$193, respectively). (…)
Last week, Credit Suisse analyst Jonathan Golub raised his price target to 4,600 from 4,300 to reflect higher EPS estimates for 2021 and 2022. (…)
Citi’s top strategist, Tobias Levkovich, remains decidedly more cautious on where stock prices will head next, expecting stocks to end lower than current levels. Yet, in a note on April 30, he cited “a variety of upside risks,” which include significant fund flows into stocks, more impressive earnings and additional monetary stimulus. “Admittedly, first quarter 2021 results may force our year-end S&P 500 objective closer to the upper end of our 3,600-4,000 trading range,” he said. (…)
WATCH YOUR BACK!
Data Show Demand for Butt Implants Soared During the Pandemic
(…) Botox and soft-tissue fillers remained the most popular overall. But the biggest riser was butt implants, up 22%, from 970 to 1,179. (Implants are what provide volume; a butt lift merely turns a droopy pancake butt into a toned pancake butt.)
Dermatologist Ava Shamban points to homebound stagnation—“modern-day ‘secretary spread,’ or a general flattening of the buttocks.” And let’s not forget Instagram. “Presumably, seeing the higher, tighter rounder assets on social media or any number of reality distractions, had patients researching and ultimately scheduling procedures to give their bottom line a much-needed boost,” she says. (…)
Washington shies away from open declaration to defend Taiwan White House official says shift to ‘strategic clarity’ would carry ‘downsides’ in face of China’s belligerence
Births in U.S. Drop to Levels Not Seen Since 1979 The number of babies born in America last year was the lowest in more than four decades. Births fell 4% in 2020 as the pandemic and lower birth rates among millennials usher in an era of lower fertility.
U.S. women had about 3.61 million babies in 2020, down 4% from the prior year, provisional data from the Centers for Disease Control and Prevention’s National Center for Health Statistics shows. The total fertility rate—a snapshot of the average number of babies a woman would have over her lifetime—fell to 1.64. That was the lowest rate on record since the government began tracking it in the 1930s, and likely before that when families were larger, said report co-author Brady Hamilton. Total births were the lowest since 1979. (…)
Women typically have fewer babies when the economy weakens. Fears of getting sick, making medical appointments and delivering a baby as a deadly virus spread also dissuaded some women from pregnancy. (…)
Demographers say the data suggests that more fundamental social and economic shifts are driving down fertility. Births peaked in 2007 before plunging during the recession that began that year. Although fertility usually rebounds alongside an improving economy, U.S. births fell in all but one year as the economy grew from 2009 until early 2020.
“It’s not just Covid. It’s the fact that the birthrates never recovered from the Great Recession,” said Kenneth Johnson, senior demographer at the University of New Hampshire. “I’ve been waiting for years to see a big jump in fertility to women in their 30s and it hasn’t happened.”
(…) He said separately released provisional monthly data from the CDC showed births declined about 7.7% in December. That shows a drop that was already under way before the pandemic and accelerated once the pandemic took hold.
Millennials, born between 1981 and 1996, now account for the majority of women having children. In seeking to explain their lower fertility rates, researchers have pointed to the fact that they are marrying later in life, getting higher levels of education and are less financially secure than previous generations when they were the same age.
Provisional birthrates fell for all women ages 15 to 44 last year. That included women ages 40 to 44, whose birthrates declined 2%. The rate for that age group had risen almost continuously from 1985 to 2019, by an average of 3% a year.
The sharpest fertility declines in 2020 were among women in their late teens and early 20s. Since peaking in 1991, the teenage birthrate has fallen 75%. (…)