ECI Drop Suggests Hidden Slack in U.S. Labor Market
The year-on-year change in the employment cost index, an important gauge of wage inflation, slipped to 2.0 percent in the second quarter, compared to 2.9 a quarter prior. When the ECI is compared to the U.S. employment-to-population ratio — which remains depressed from its pre-financial crisis level — the ECI’s slower growth rate appears in-line with the historical relationship. The discrepancy between lower ECI and what’s expected, given the unemployment rate, may be due to slack in the U.S. labor market not properly represented by the headline jobs data.

US growth revised higher to 3.9% Second-quarter GDP confirms economy enjoys sustained tailwinds
(…) The better than expected growth was fuelled by improved consumer spending, which was revised up to 3.6 per cent growth from 3.1 per cent rate reported in August. This in turned was aided by cheap petrol prices and relatively higher house prices boosting household wealth.
Revised construction spending data helped to push up growth too, with non-residential fixed investment expanding 4.1 per cent in the quarter.
The revisions to second-quarter growth also reflected a smaller accumulation of inventories than earlier estimated, with inventories contributing just 0.02 percentage point to growth rather than adding 0.22 percentage point.
After-tax corporate profits were also stronger in the second quarter than previously thought. Profits after tax with inventory valuation and capital consumption adjustments showed a 2.6 per cent rebound from a slump in late 2014 and early 2015, instead of the 1.3 per cent increase reported last month.

CHINA
China Industrial Profits Fall Most Since 2011 as Growth Ebbs
Industrial profits tumbled 8.8 percent in August from a year earlier, with the biggest drops concentrated in producers of coal, oil and metals, the National Bureau of Statistics said Monday in Beijing. It was the biggest decline since the government began releasing monthly data in October 2011, according to data compiled by Bloomberg.

Profits in coal mining plunged 64.9 percent in the first eight months of this year from the same period last year, while oil and gas profits tumbled 67.3 percent, the report said. Ferrous metal smelting earnings fell 51.6 percent.
The drop in profit was attributed to falling product prices, lower investment returns and foreign-exchange losses, He Ping, an NBS official, said in an analysis on the agency’s website. The report is a gauge of earnings from industrial companies that have 20 million yuan ($3.1 million) or more in annual “core business income,” according to NBS. (…)
The “Hard-Landing” Has Arrived: Chinese Coal Company Fires 100,000
On Friday, in a move that would make even Hewlett-Packard’s Meg Whitman blush, Harbin-based Heilongjiang Longmay Mining Holding Group, or Longmay Group, the biggest met coal miner in northeast China which has been struggling to reduce massive losses in recent months as a result of the commodity collapse, just confirmed China’s “hard-landing” has arrived when it announced on its website it would cut 100,000 jobs or 40% of its entire 240,000-strong labor force. (…)
China Capital Outflows Hit Record on Yuan Weakness
Money is leaving China faster than ever, according to a Bloomberg gauge tracking capital flows. An estimated $141.66 billion left China in August, exceeding the previous record of $124.62 billion in July, data compiled by Bloomberg show.The gauge of so-called “hot money” is an estimate of the sum of foreign exchange purchases by banks and the change in foreign exchanges deposits to measure flows into the country. The monthly trade and direct investment balances are netted out for an estimate of portfolio flows. An exporter choosing to keep foreign earnings offshore would show as a capital outflow.The capital flight came as the People’s Bank of China shocked global markets by devaluing the yuan Aug. 11, triggering a worldwide drop in commodities, equities and emerging-market currencies.

China Financial Gauge Improves, Offering a Signal for Growth
Bloomberg’s China Monetary Conditions Index, a gauge that includes inflation-adjusted interest rates and the exchange rate, improved for a second month in August — the first back-to-back gain since 2013. Episodes of improvement in the past have tended to presage either an acceleration or a stabilization in economic growth. (…)
The HSBC China Monetary Conditions Indicator also rose to a six-month high in August, after stalling in July. The Bloomberg and HSBC gauges are designed to give a sense of how monetary conditions evolve over time, with higher values indicating looser monetary conditions and lower values signaling tightening. (…)

Renminbi creeps closer to reserve status IMF shareholders likely to back adding currency to SDR basket
(…) But remaining technical hurdles, concerns over Beijing’s heavy-handed intervention in markets and poor communication of reforms such as the changes to its foreign exchange regime that set off a bout of turmoil in global financial markets last month, are causing nervousness within the IMF.
The caution has prompted some IMF staff to raise the possibility that a vote by the fund’s board due to take place in November could be delayed into early next year to give China more time to deliver reforms and build credibility at a time when many outside observers have grown sceptical. (…)
However, a move to delay the actual decision over whether to include the renminbi even for a few months beyond this year would raise questions about whether the IMF was according China special treatment. The SDR basket is subjected to a review every five years and IMF officials have repeatedly said they are committed to concluding the current iteration by the end of this year. (…)
The big question for the IMF is not China’s capital controls but whether, in practical terms, member countries in crisis would be able to use the renminbi if needed. (…)
Chinese Debt Market Heats Up
(…) “China’s corporate-bond market is looking more and more like the red-hot stock market before its crash in the summer. It’s overheated and full of bubbles,” said Wang Jing, deputy general manager at the fixed-income department of China Securities Credit Investment Co., a financial-services firm in Shenzhen. (…)
Yields on AA+-rated corporate bonds, including RiseSun’s, are around 4.60%, compared with 5.60% before the rally began, the lowest level since October 2010. RiseSun sold a five-year bond in July with a coupon of 5.30%, and the yield has since dropped to 4.99%. (…)
Property developers, considered among the riskiest companies in China, have sold a total of 237 billion yuan worth of bonds so far this year, up 72% from 138 billion yuan a year earlier, according to data provider WIND Info.
“The most aggressive borrowers are usually the ones that need the money to save their lives, rather than to expand their business,” said Mr. Wang from China Securities Credit Investment.
Another risk to these bonds is their limited history: Property developers only regained access to the bond market in the middle of last year after a ban was imposed in 2009 as part of Beijing’s measures to cool the property market. (…)
OIL
-
Shell abandons Arctic drilling campaign Collapse in oil prices has called into question high-cost projects
-
Saudi Arabia withdraws overseas funds Up to $70bn moved from asset managers to boost oil revenues
Saudi Arabia has withdrawn tens of billions of dollars from global asset managers as the oil-rich kingdom seeks to cut its widening deficit and reduce exposure to volatile equities markets amid the sustained slump in oil prices.
The Saudi Arabian Monetary Agency’s foreign reserves have slumped by nearly $73bn since oil prices started to decline last year as the kingdom keeps spending to sustain the economy and fund its military campaign in Yemen.
The central bank is also turning to domestic banks to finance a bond programme to offset the rapid decline in reserves.
This month, several managers were hit by a new wave of redemptions, which came on top of an initial round of withdrawals this year, people aware of the matter said. (…)
EARNINGS WATCH
Profit Pessimism Rivals Crisis Days as Stocks Support Erodes Any hopes that investors had of earnings growth salvaging what is poised to be the first down year for stocks worldwide since 2011 are quickly fading.
Cuts to profit estimates outnumber increases by the most in three years, and the pessimism could reach levels last seen during the financial crisis, based on an index tracking the changes compiled by Citigroup Inc. (…)
Citigroup’s earnings-revision index, a measure compiled weekly that shows the number of analyst downgrades versus upgrades to global profit estimates, dropped to minus 0.39 in September, the lowest level since July 2012. That’s down from a high this year of minus 0.03 in May. In 2009, the gauge reached minus 0.62 and averaged minus 0.28 in the first half of the year.
Data compiled by Bloomberg show earnings at companies worldwide will climb about 4 percent this year and 10 percent the next. Forecasts for 2016 are too high, Citigroup indicated in a Sept. 24 report. The bank says that a drop of 3 percent is likely if the global economy slows to 2 percent, a scenario it considers possible.
After years of resilience from corporate America, analysts project earnings for Standard & Poor’s 500 Index members will be flat in 2015. That would be the worst performance since 2008, before an estimated rebound of 9.4 percent in 2016. Profits are forecast to increase 4.8 percent in Europe this year, down from the 11 percent predicted in March, and will fall 5.8 percent in the emerging markets, according to estimates compiled by Bloomberg. (…)
Excluding energy stocks reveals a better picture. The remaining S&P 500 companies will increase profits by 7.1 percent this year, analyst estimates show. And while Morgan Stanley expects European earnings to be flat in 2015 — down from predictions earlier this year for 12 percent growth — removing commodity-related shares means they will probably increase by an average 9 percent over the next three years, according to a note this month. (…)
Evidence of strong profits would offer relief for global stocks, which have dropped 7.3 percent in the third quarter as measured by the MSCI All-Country World Index. Alcoa Inc. unofficially kicks off the U.S. reporting season next week, and analysts project an average 6.5 percent decline in S&P 500 company earnings for the period. (…)

Getting closer to the Q3 earnings season, always a critical one since it serves as confirmation, or not, of the current year estimates and, therefore, as a “better” base for next year’s forecasts (for what they’re worth!). This one might be even more critical given the on-going correction and weak technical readings as this chart from Lance Roberts shows:

Already, earnings expectations for the market are anything but positive.

As the above chart shows, forward earnings growth expectations have turned negative. Is this simply an energy/materials issue? Energy earnings have contracted 50%. (The Blog of HORAN Capital Advisors)
It is not only an Energy/Materials issue per Factset:
Analysts have lowered earnings estimates for the S&P 500 for Q3 2015 by a smaller margin than average. On a per-share basis, estimated earnings for the third quarter have fallen by 3.0% since June 30. This percentage decline is smaller than the trailing 5-year and 10-year averages at this same point in time in the quarter. Fewer companies have lowered the bar for earnings for Q3 2015 as well. Of the 108 companies that have issued EPS guidance, 76 have issued negative EPS guidance and 32 have issued positive EPS guidance. The percentage of companies issuing negative EPS guidance is 70%, which is below the 5-year average of 72%.
As a result of the downward revisions to earnings estimates, the estimated year-over-year earnings decline for Q3 2015 is -4.5% today, which is higher than the expected decline of -1.0% at the start of the quarter (June 30). If the Energy sector is excluded, the estimated earnings growth rate for the S&P 500 would jump
to 2.9% from -4.5%.The estimated sales decline for Q3 2015 is -3.3%, which is also higher than the estimated year-over-year revenue decline of -2.5% at the start of the quarter. If the Energy sector is excluded, the estimated revenue growth rate for the S&P 500 would jump to 2.4% from -3.3%.
All sectors but Telecoms have seen their Q3 estimates decline since June 30, the worst being Materials, Industrials and IT (the latter always managing to beat handily). That said, company guidance is not hinting at a poor season. In fact, with the same number of companies having pre-announced, 33 (31%) have guided positively compared to 27 (25%) at the same time last year. This is the highest number of positive pre-announcements since at last 3 years.

SENTIMENT WATCH
S&P 500 Shows Pattern Similar to Start of Last Two Bear Markets
Driven by a retreat since mid-August, the Standard & Poor’s 500 Index has seen its average price over 12 months fall for two straight months, data compiled by Bloomberg and MKM Partners LLC show. In the past two decades, declines in the average measure lasting two months or longer had only occurred twice, in the dot-com crash and the 2007-2009 bear market. (…)
Gavyn Davies: What if the Fed is making a historic mistake?
(…) It is clear that none of the options to control the next downturn comes without serious collateral problems. If the Fed does raise rates this year, their judgment had better be right.
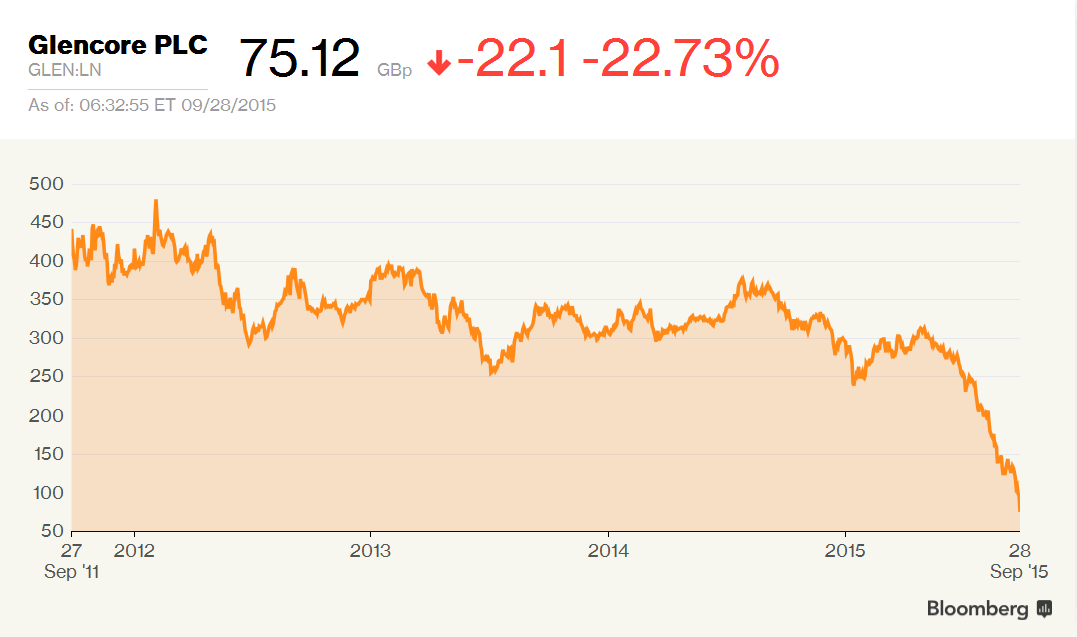
Glencore Sinks To All-Time Low On Continued Debt Fears Shares in commodities giant Glencore PLC sank 17% to a new all-time low as the trader and miner struggles to convince investors it will be able to meet its net debt targets if commodity prices remain low.
Shares in commodities giant Glencore PLC sank 19% to a new all-time low on Monday as the trader and miner struggles to convince investors that it will be able to meet its net debt targets if commodity prices remain low or fall further. (…)
Glencore’s shares are down 74% so far this year, making it the worst performer out of the blue chip index and are down more than 80% since listing its shares in London in 2011.
SP Angel mining analyst John Meyer said the stock feels oversold.
“I would be looking for Glencore to rebound from here…[but] only time will tell.”
Singapore Enters Bear Market
(…) Stocks in Singapore, a commodities-trading hub, have come under fire as signs that China’s economy is slowing more quickly than expected have sent commodities prices tumbling. (…)
Iron Ore Seen Below $40 by Citi as Roy Hill `Whale’ Starts
 U.S. Bonds Flash Warning Sign Yield spreads between corporate debt and Treasurys have been climbing, a potential signal of economic trouble
(…) Spreads in investment-grade corporate bonds—debt from companies rated triple-B-minus or higher—are on track to increase for the second year in a row, according to Barclays data. That would be the first time since the financial crisis in 2007 and 2008 that spreads widened in two consecutive years. The previous times were in 1997 and 1998, as a financial crisis roiled Asian countries, and a few years before the dot-com bubble burst in the U.S. (…)
U.S. investment-grade corporate bonds yielded 1.62 percentage points more than comparable Treasurys as of Thursday, according to Barclays data. The spread ended 2014 at 1.31 percentage points and ended 2013 at 1.14 percentage points. (…)
Investors Pull Back From Junk Bonds A decline in investors’ appetite for high-yield bonds poses a threat to the merger boom.
(…) Tepid demand forced European cable company Altice NV and U.S. chemical producerOlin Corp. in recent days to reduce the size of bond sales and boost interest payments.
The concessions mark the first significant slowdown following a multiyear boom. U.S. issuance of high-yield bonds, commonly called junk bonds, so far in 2015 has fallen 1.4% from a year ago, according to Securities Industry and Financial Markets Association data, known as Sifma. (…)
Altice on Friday sold $4.8 billion of junk bonds to fund its $10 billion purchase ofCablevision Systems Corp., according to S&P Capital IQ LCD. When the deal was shopped earlier this month, Altice expected to sell $6.3 billion of debt, investors said.
A 10-year bond was priced to yield 10.875%, compared with yields as low as 9.75% that were suggested by bankers initially, according to S&P Capital IQ.
Olin on Friday sold $1.2 billion of bonds to pay for its pending acquisition of Dow Chemical Co.’s chlorine-products unit. Earlier in the month, Olin was expected to sell $1.5 billion of bonds, fund managers and analysts said.
The annual interest rate on Olin’s 10-year bonds sold Friday was 10%, up from 7% expected earlier in the month, according to S&P Capital IQ. The steep increase in yield reflects growing concerns that slowing demand from China could hit sales of chemical makers. (…)
Companies have announced $3.2 trillion of M&A this year, according to Dealogic, emboldened to merge by cheap debt and the long stock rally that began after the financial crisis. That puts 2015 on pace to rival 2007 as the biggest year ever for takeovers. Issuance of junk bonds backing M&A deals hit a year-to-date record of $77 billion through Friday, according to data from Dealogic. (…)
Meanwhile, the yield of the Barclays U.S. corporate high-yield index rose to 7.64% on Thursday—the highest since 2012 during the European debt crisis. The average yield has jumped almost one percentage point since early August, reflecting lower bond prices, as stock-market turmoil has spilled into bond trading. (…)
The Trick to Making Better Forecasts
…and better investments. Professor Tetlock’s thesis touches on Bearnobull’s approach: this is a game of probabilities, not a forecasting game. Always consider the more improbable scenarios since they are generally overlooked. Test the consensus against them seeking what the crowd (analysts, strategists and media) is overlooking, intentionally or not. Keep your mind open and your “convictions” flexible. (My emphasis in Jason Zweig’s piece).
Three-quarters of all U.S. stock mutual funds have failed to beat the market over the past decade. Last year, 98% of economists expected interest rates to rise; they fell instead. Most energy analysts didn’t foresee oil’s collapse from $145 a barrel in 2008 to $38 this summer—or its 15% rebound since.
A new book suggests that amateurs might well be less-hapless forecasters than the experts—so long as they go about it the right way.
I think Philip Tetlock’s “Superforecasting: The Art and Science of Prediction,” co-written with the journalist Dan Gardner, is the most important book on decision making since Daniel Kahneman’s “Thinking, Fast and Slow.” (…)
The book is so powerful because Prof. Tetlock, a psychologist and professor of management at the University of Pennsylvania’s Wharton School, has a remarkable trove of data. He has just concluded the first stage of what he calls the Good Judgment Project, which pitted some 20,000 amateur forecasters against some of the most knowledgeable experts in the world.
The amateurs won—hands down. Their forecasts were more accurate more often, and the confidence they had in their forecasts—as measured by the odds they set on being right—was more accurately tuned. (…)
The most careful, curious, open-minded, persistent and self-critical—as measured by a battery of psychological tests—did the best.
“What you think is much less important than how you think,” says Prof. Tetlock; superforecasters regard their views “as hypotheses to be tested, not treasures to be guarded.”
Most experts—like most people—“are too quick to make up their minds and too slow to change them,” he says. And experts are paid not just to be right, but to sound right: cocksure even when the evidence is sparse or ambiguous. (…)
Joshua Frankel, a filmmaker and opera director in Brooklyn, N.Y., says the tournament taught him to “look at the world in a less binary way, to think much more in terms of probabilities.” (…)
In any case, investors, small and large, generally have not been smart enough to play this extraordinary equity bull as these ISI charts illustrate. If there is froth in U.S. equities, it is either due to machines or … central banks.

