Jobs Slowdown Frustrates Investors Who Wanted Certainty on the Fed Revisions and other distortions mean monetary policy outlook remains hazier than Wall Street would have liked.
The August jobs report was just good enough to keep markets guessing what the Federal Reserve will do this fall. That could be a problem.
The Labor Department said Friday that the U.S. economy added 142,000 jobs last month, below expectations for 161,000 but up from the prior month. The unemployment rate ticked down to 4.2% from 4.3%.
But beneath the surface there were more worrying signs. June’s jobs growth was revised down by 61,000 to 118,000, and July’s by 25,000 to 89,000 jobs. These revisions make it difficult to take August’s apparent rebound at face value. They also come on top of a very significant downward revision announced last month, by 818,000, of the total number of jobs added in the 12 months through March 2024. All together, these data points suggest a steadily weakening jobs market.
Hurricane Beryl, which had an impact on activity around Houston and the Gulf Coast in July, could also be distorting the data somewhat. Construction job growth, for instance, rebounded to 34,000 in August from 13,000 in July, which Capital Economics said in a note could be partly due to a recovery following the storm.
Using a three-month moving average to smooth out this and other monthly volatility, the underlying trend is clear: The economy added an average of 116,000 jobs in the three months through August, down from 141,000 in the three months through July. In fact, this average has been moving downward for five straight months. (…)
But a mere 25 basis-point cut could set up some issues for the Fed and markets at large. As there is no Fed meeting scheduled for October, further relief would likely only be coming by its next get together on Nov. 7. If the employment picture continues to steadily worsen between now and then, worries could keep building that the Fed is behind the curve in responding to this weakness. (…)

Source: U.S. Department of Labor and Wells Fargo Economics
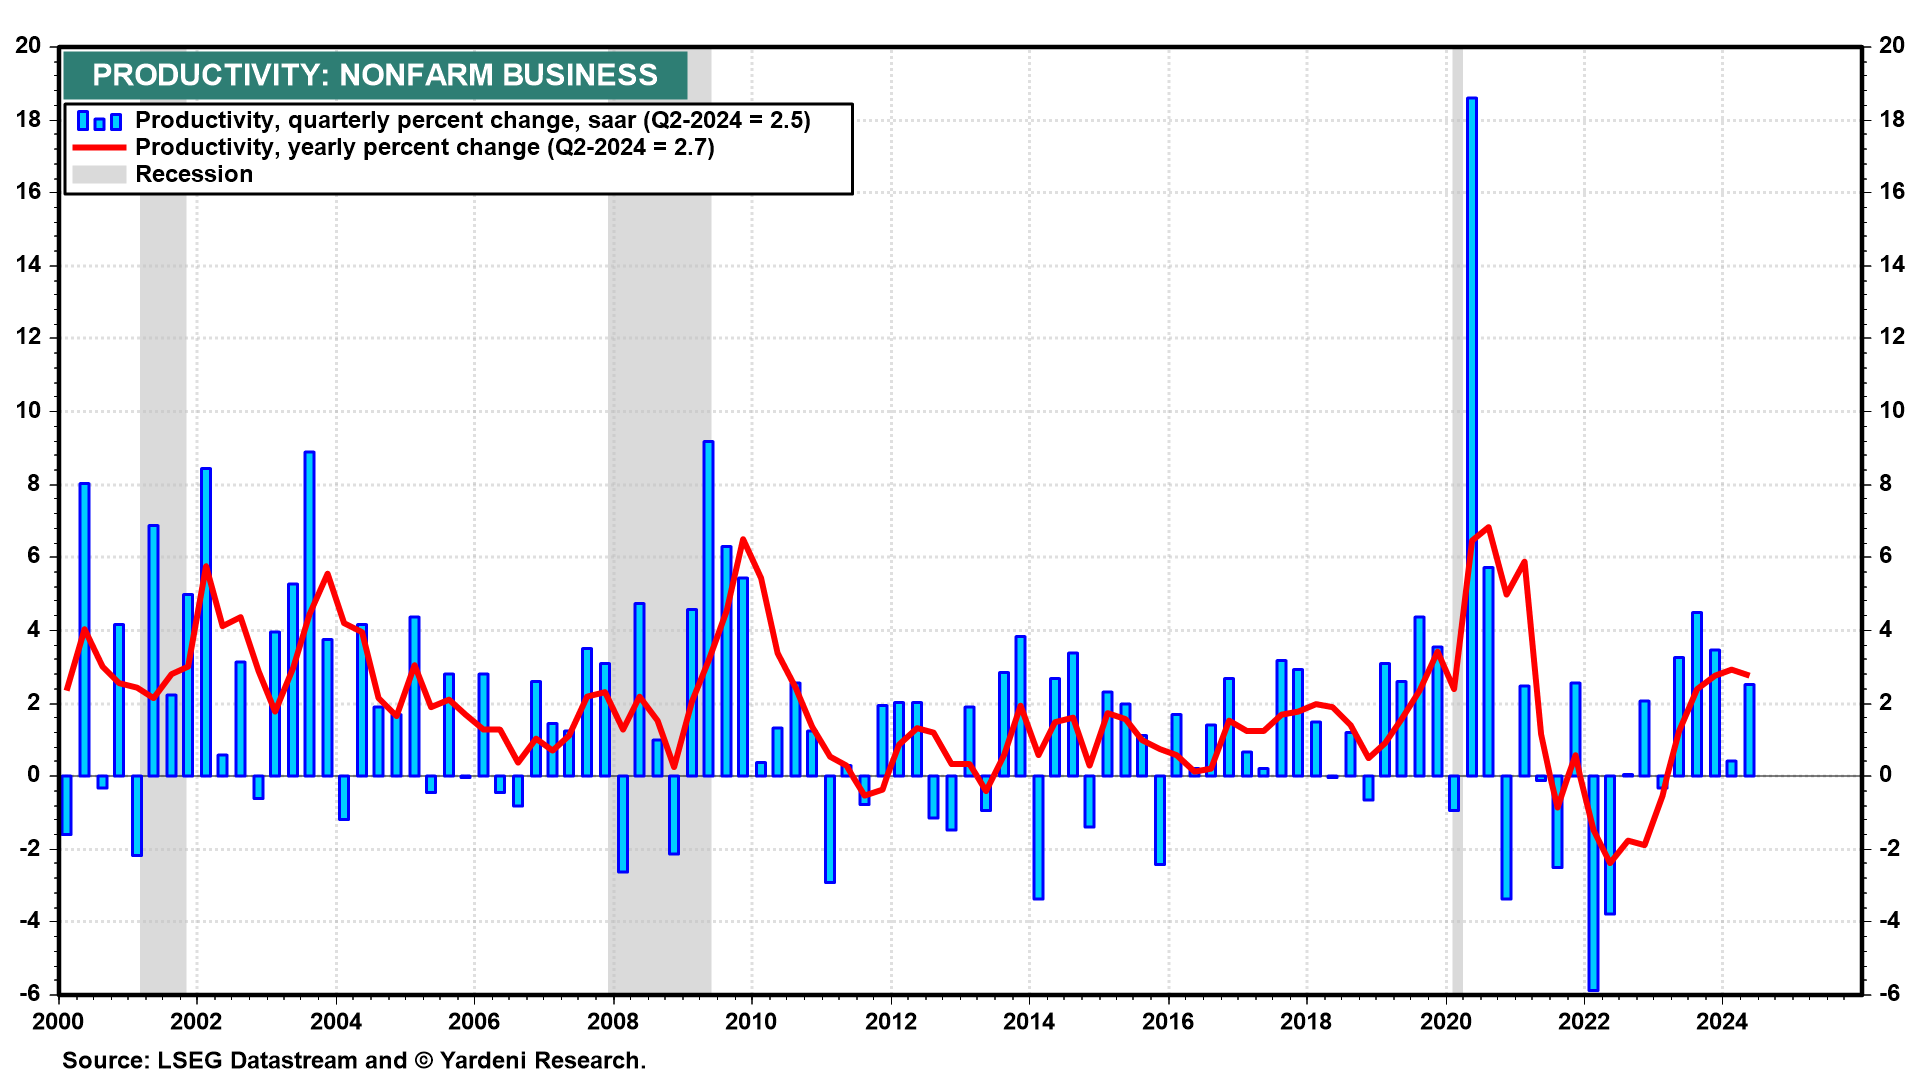
The labor market is unmistakably slowing as the above chart shows. It is not collapsing however: jobs postings have stabilized 12% above their pre-pandemic levels, the rise in the unemployment rate was supply-driven (immigration) and claims/layoffs are not spiking like they typically do in a downturn, thanks to strong productivity gains allowing corporates to hang onto their employees.
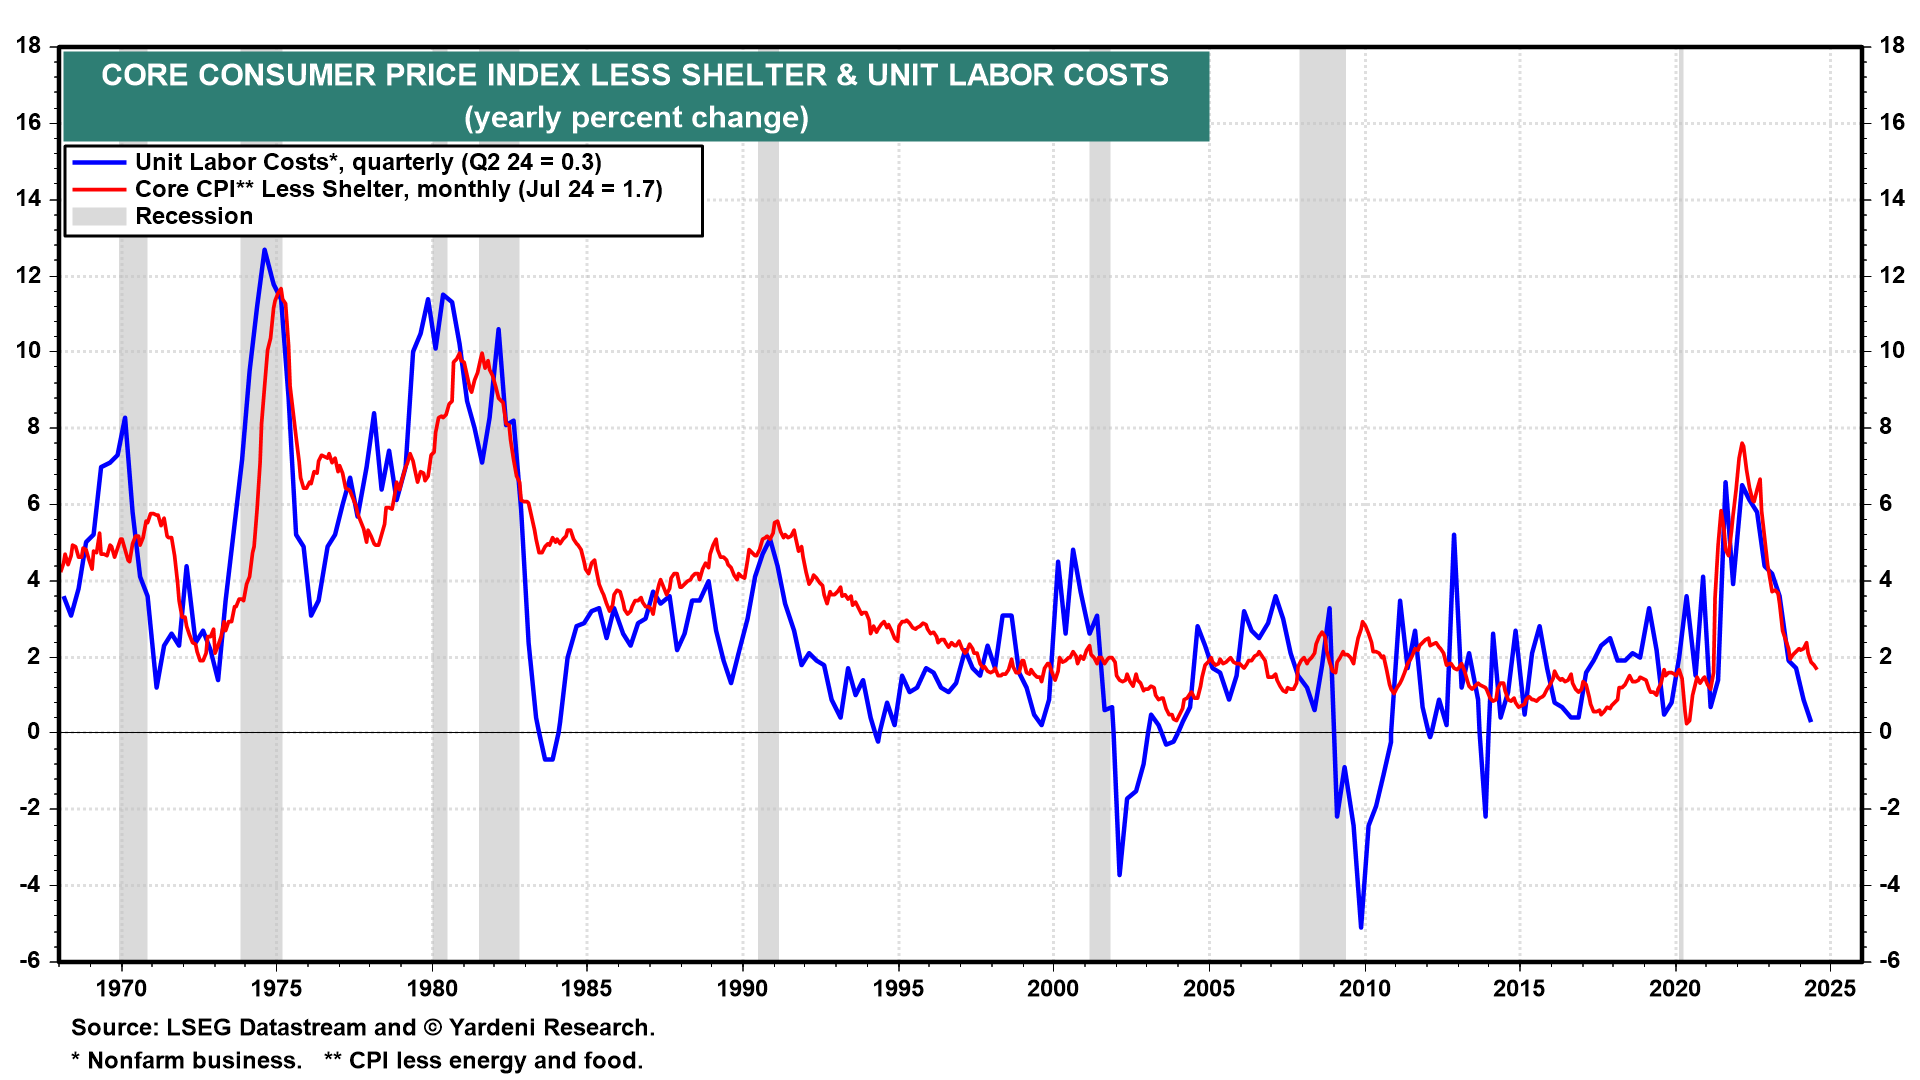
Strangely, the 0.4% monthly increase in hourly wages got little attention while July’s 0.2% advance was widely hailed as a sign that wages were under control. They may be since the 2 and 3-month average at +0.3% is in line with Q1 and Q2 averages and productivity gains are allowing businesses to absorb a 3.5-4.0% increase in wages without sacrificing profit margins. But another 0.4% print in September would get attention.
The other side of the coin is that, thanks to wages, growth in aggregate labor income remains solid: the +0.77% jump in August more than offsets July’s no gain. On a 3-month basis, labor income (jobs x hours x wages) is up 0.38% (4.7% a.r.) after 0.5% in Q1 and 0.3% in Q2. On a YoY basis, labor income is up 5.0% after 4.8% in July and 5.1% in June, only slightly lower than the 5.3% YoY gains in Q1 and Q2.
With PCE inflation having slowed to 2.5%, real labor income growth holds around 2.5%, supporting similar growth in real personal expenditures.

The slowdown in the labor market is not squeezing consumers nor threatening demand just yet.

This was confirmed by the August Services PMI:
S&P Global US Services PMI® Business Activity Index rose to 55.7 in August from 55.0 in July, signaling a marked monthly increase in service sector output, and one that was the most pronounced since March 2022.
The expansion in business activity was linked by respondents to higher new orders and success in securing new customers. Additional clients helped firms to increase their new business volumes for the fourth consecutive month. Here too the pace of expansion quickened, with the solid rise the most marked since June 2023.

On the goods side, Target CEO last week said at a retailing conference that the consumer was chugging along through the end of August, the beginning of the important back-to-school period.
Lower gas prices are also helping, not only consumers but also corporate costs and overall inflation.
Goldman Sachs:
The 8 OPEC+ countries agreed yesterday to extend their extra voluntary production cuts for two months until the end of November, underscoring the flexibility of the producer group. We still expect three months of OPEC+ production increases, but have pushed out the start date to December (vs. October previously).
We stick to our $70-85 Brent range and our December 2025 Brent forecast of $74/bbl. We expect the tightening impact of modestly lower OPEC+ supply in coming months to be roughly offset by the easing effect from ongoing softness in our China demand nowcast and from a quicker than previously expected recovery of Libya supply.
We still see the risks to our $70-85 range as skewed to the downside given high spare capacity, and downside risks to demand from weakness in China and potential trade tensions.
Apollo Global Management compiles daily and weekly indicators to gauge the economy in real time. Their Sept. 7 readings:

Consumer spending still shows momentum:

Canada’s unemployment rate climbs to 6.6% as labour market weakens
The economy added 22,000 jobs in August, following small declines in June and July, Statistics Canada reported on Friday.
Still, this growth couldn’t stop the unemployment rate from rising to 6.6 per cent from 6.4 per cent in July. Excluding the pandemic, this is the highest jobless rate since May, 2017, and it has risen nearly two percentage points from a record low in 2022. (…)
Over the past year, employment has grown by 1.6 per cent for those 15 and older, while the population in the equivalent age bracket has risen by 3.5 per cent. (…)
Job creation last month was entirely driven by part-time roles. The employment rate has fallen 10 out of the past 11 months. And the total number of hours worked in August edged down 0.1 per cent from July.
The Bank of Canada in July forecast economic activity to accelerate in the second half of the year, with real gross domestic product rising by 2.8 per cent annualized in the third quarter.
Desjardins Securities says growth is tracking about 1 per cent this quarter, based on early numbers. The Bank of Canada, which updates its economic projections at the October rate decision, says that growth needs to pick up so that inflation doesn’t fall below the 2-per-cent target. (…)
“The only silver lining was that rising joblessness continues to be driven by new entrants not finding work rather than existing workers losing their jobs,” Mr. Mendes said. “Existing workers are the ones that tend to have high debt loads. So, at least for now, we believe there’s still a narrow path to a soft landing.” (…)

Other important facts:
- The number of full-time jobs declined –44k after +62k in July.
- Hourly wage growth of permanent employees declined -0.3pp to +4.9% YoY in August.
Tech Facts
- Tech Troubles: After failing to breach that key overhead resistance level, tech stocks have rolled over again — at this point now notching up a lower high. From a classical technical analysis standpoint this is not a good sign, you want to see a series of higher highs and higher lows to be confident in the bull trend, whereas a transition to lower highs brings into prospect the possibility of a bear trend establishing. To remain constructive at all on tech stocks and by extension US equities as a whole, it is going to be critical for the Nasdaq to avoid making a lower low (and avoid breaching that rising bar of the 200-day moving average). (Callum Thomas)
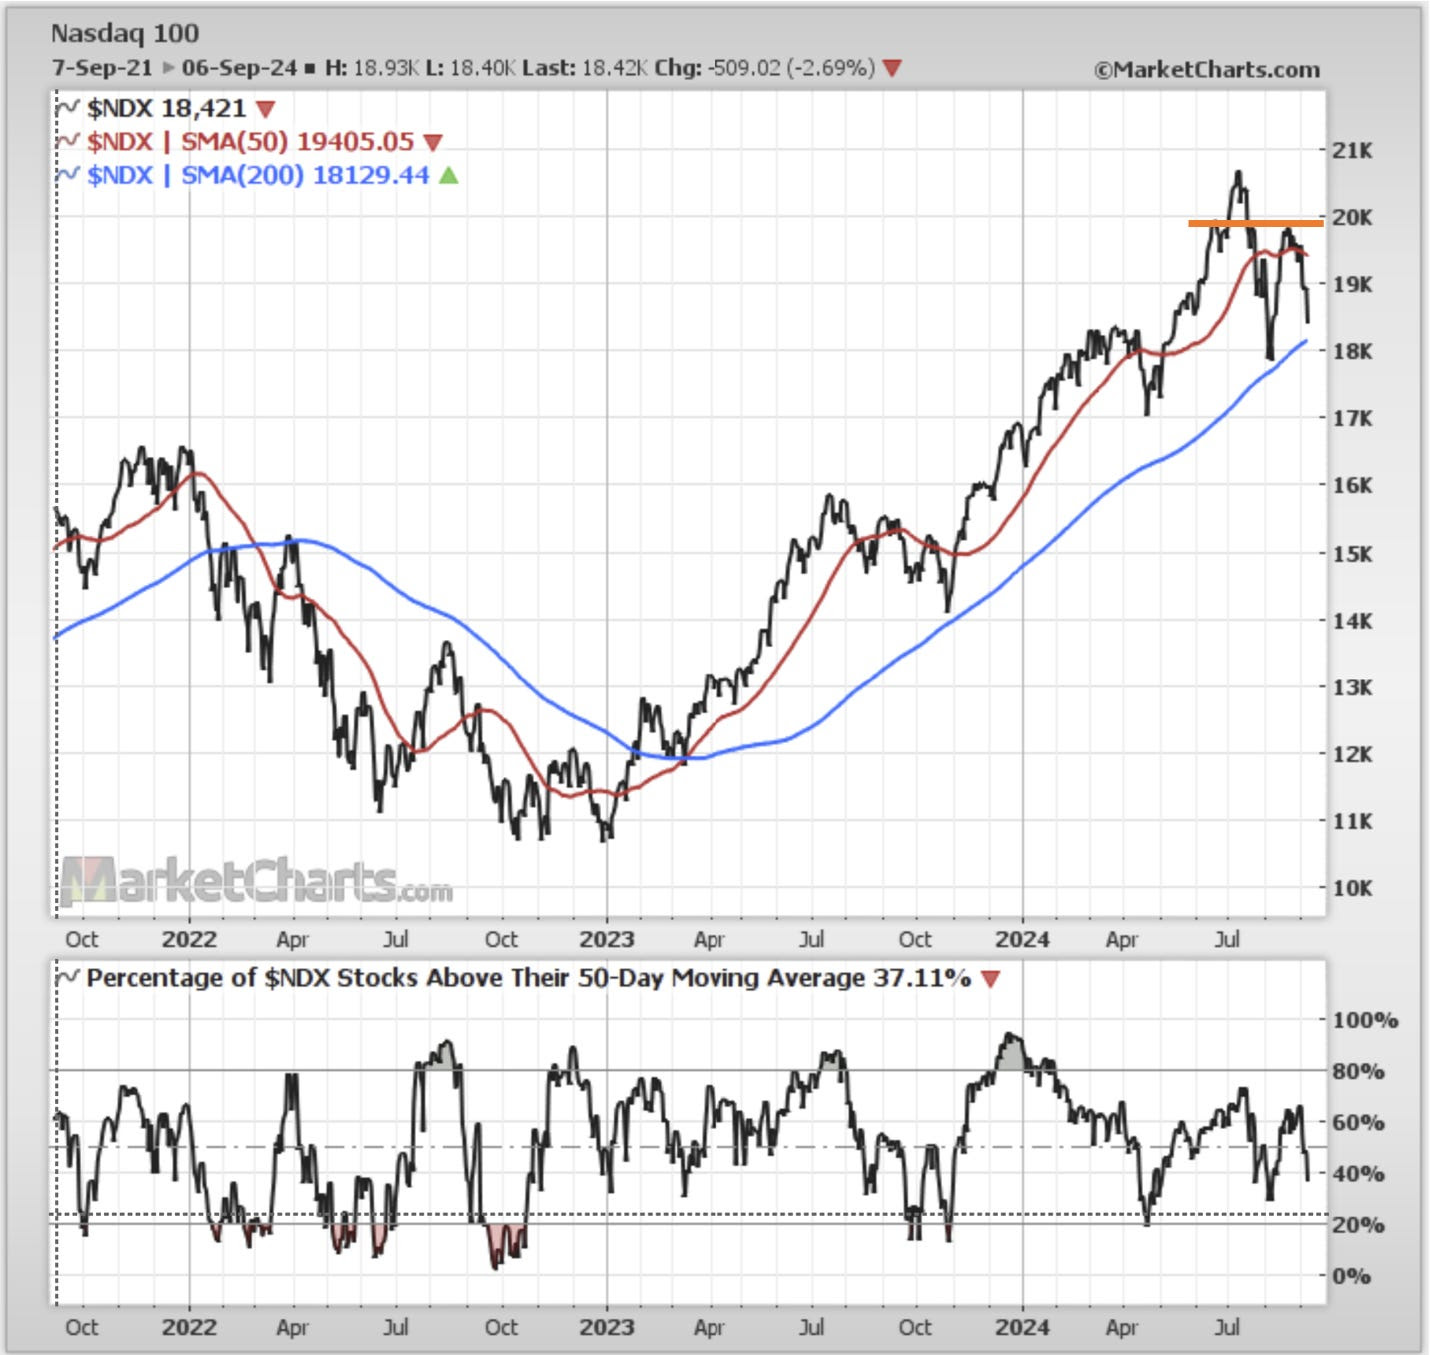
Source: Callum Thomas using MarketCharts.com Charting Tools
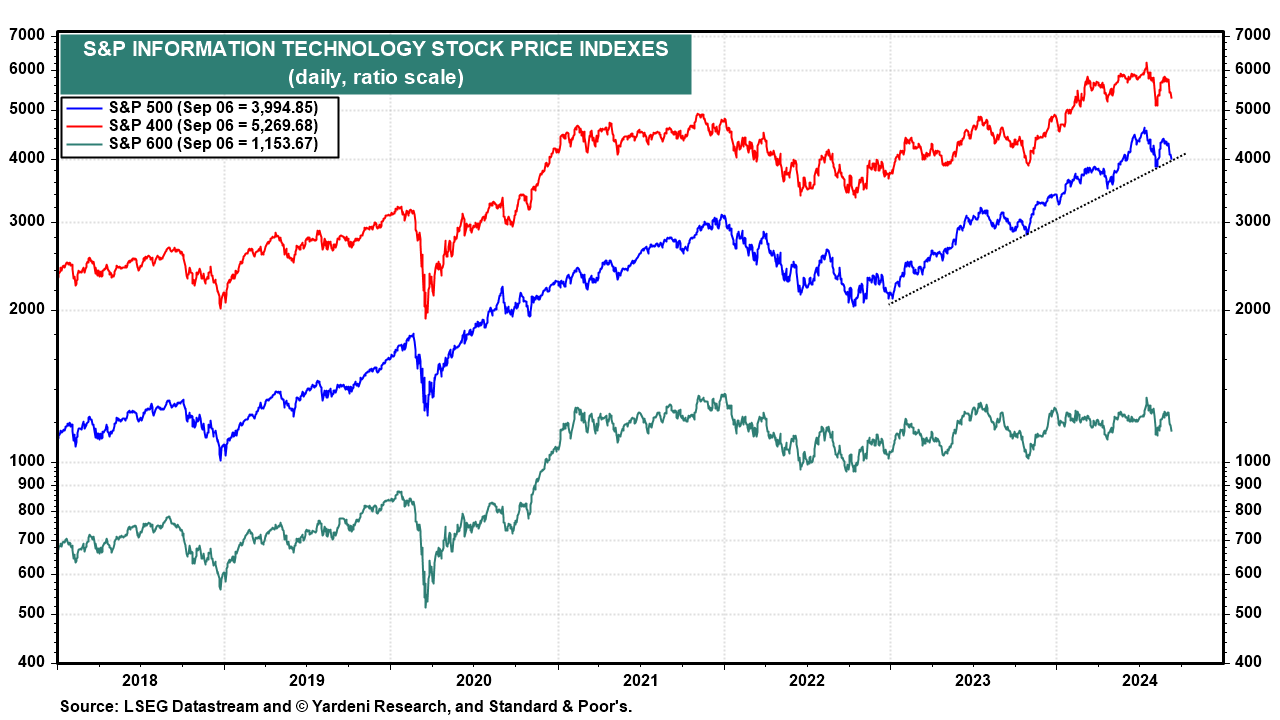
- On a ratio scale, the S&P 500 Information Technology stock price index is testing its uptrend line. (Ed Yardeni)
- Tech has become such a massive weight in the index and key driver of strength, but second because there has been so much hype and piling into tech, that it makes the biggest source of strength also the biggest vulnerability. And this chart shows just how all-in investors have been on tech. That by itself is not necessarily a tactical sell signal, but it does represent a risk — there are many minds that could change, and if those minds all change at once things can go further and faster than you think. (Callum Thomas)
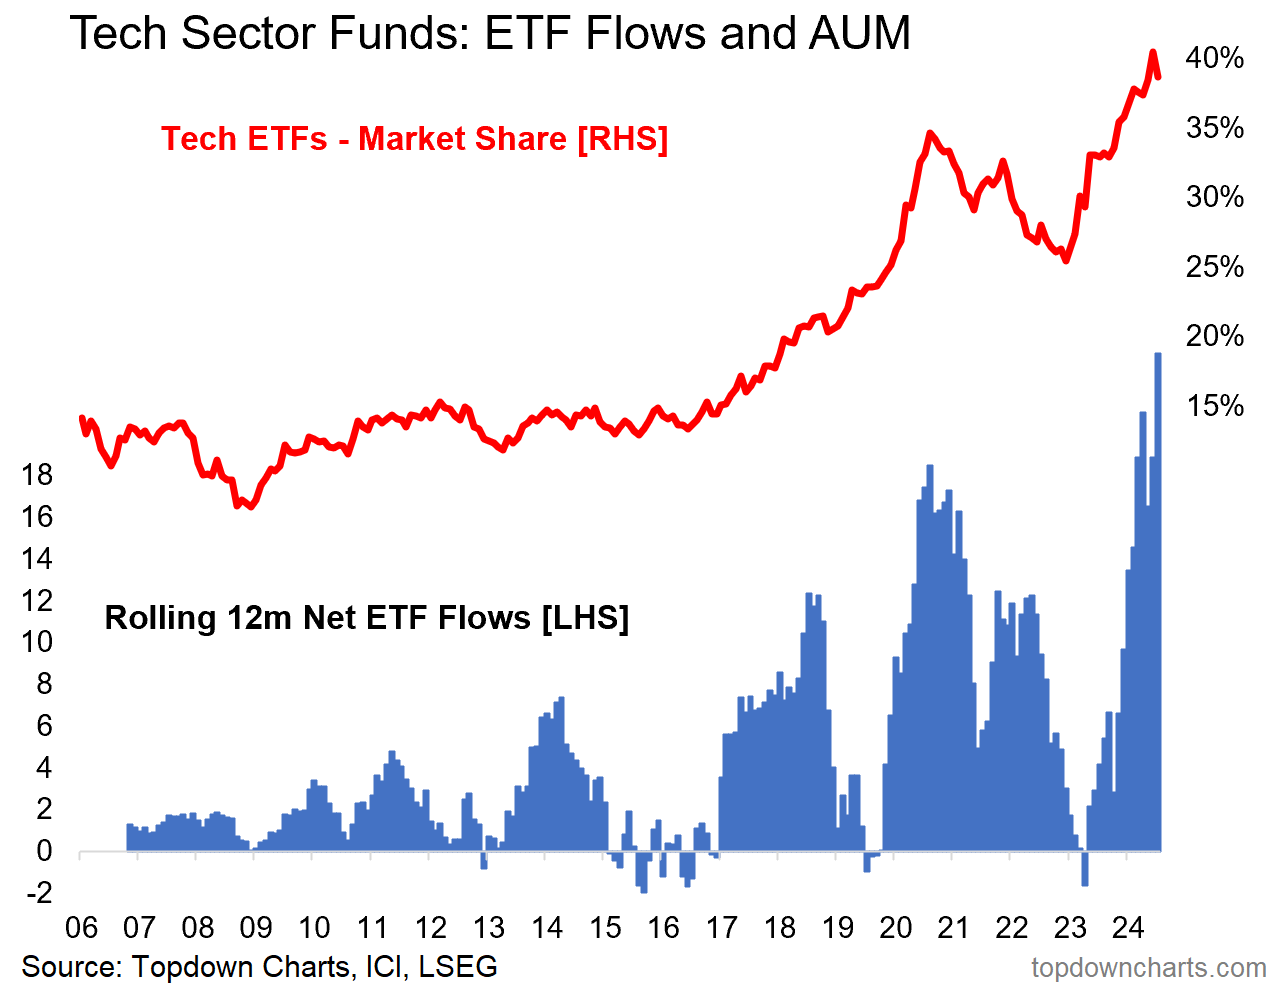
Source: Topdown Charts + Topdown Charts Professional
- The other issue of course which I have gone on about at length is the valuation side of things, and it’s very clear that tech stocks are extremely expensive, which again speaks to the confidence that folk are expressing in their future revenue potential. The problem is, while people might be right that tech will turn in ever higher earnings, it’s kind of already in the price, and it sets a very high bar for upside surprise… and again makes it all vulnerable to any even minor disappointment or rattling of eternal exponential earnings expectations. (Callum Thomas)
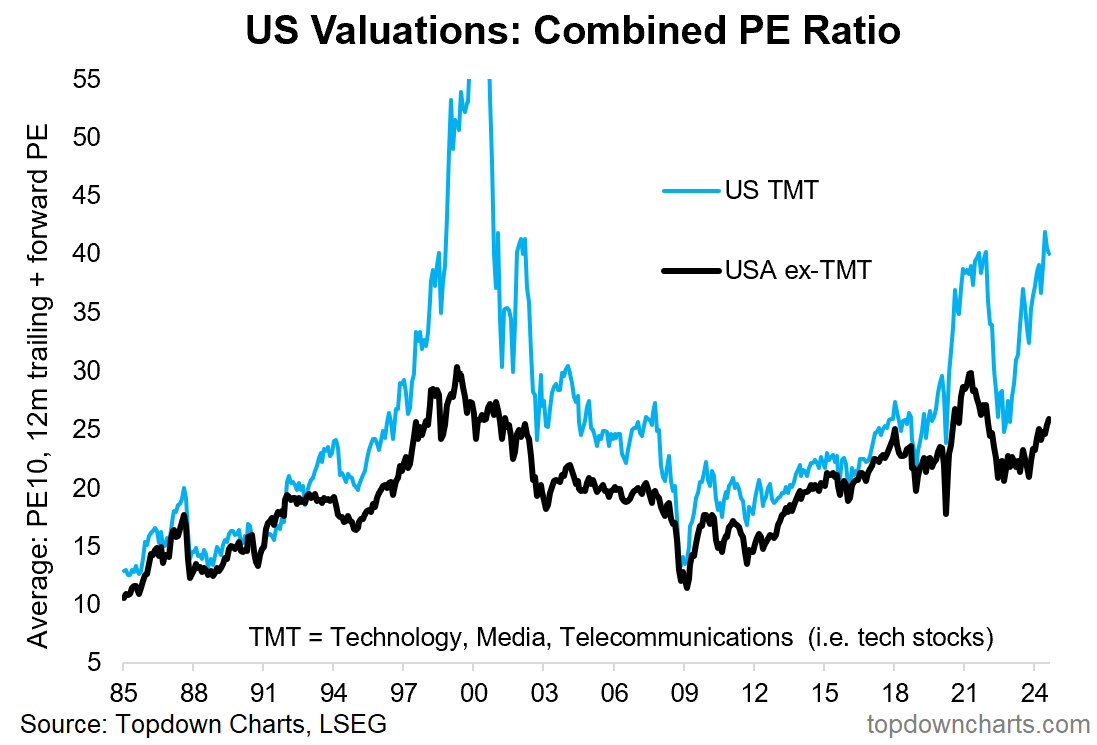
Source: Chart of the Week – Tech Value Echo
- On the bright side, it’s still entirely possible that you could see some virtuous rotation — that previous chart even actually shows US stocks ex-tech valuations starting to play catch-up. Meanwhile the chart below shows seasonally speaking, we’re heading into what has traditionally been a very strong period for rotation (Dow tends to outperform the S&P500).
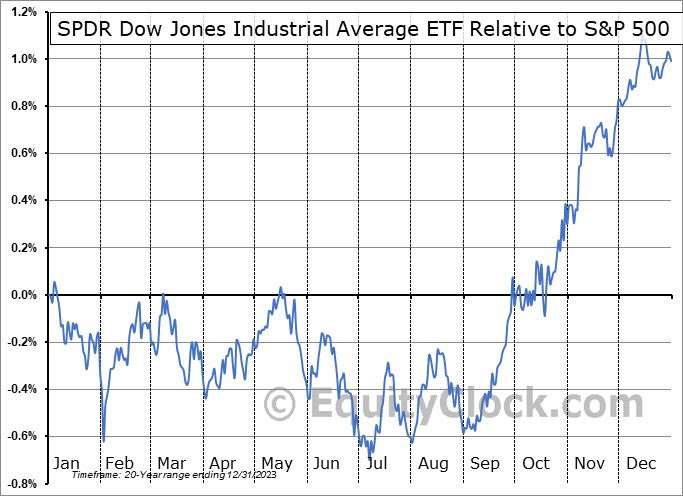
Source: @EquityClock
EARNINGS WATCH
From LSEG IBES:
498 companies in the S&P 500 Index have reported earnings for Q2 2024. Of these companies, 79.1% reported earnings above analyst expectations and 16.3% reported earnings below analyst expectations. In a typical quarter (since 1994), 67% of companies beat estimates and 20% miss estimates. Over the past four quarters, 79% of companies beat the estimates and 16% missed estimates.
In aggregate, companies are reporting earnings that are 4.6% above estimates, which compares to a long-term (since 1994) average surprise factor of 4.2% and the average surprise factor over the prior four quarters of 7.3%.
Of these companies, 59.6% reported revenue above analyst expectations and 40.4% reported revenue below analyst expectations. In a typical quarter (since 2002), 62% of companies beat estimates and 38% miss estimates. Over the past four quarters, 62% of
companies beat the estimates and 38% missed estimates.In aggregate, companies are reporting revenues that are 1.1% above estimates, which compares to a long-term (since 2002) average surprise factor of 1.3% and the average surprise factor over the prior four quarters of 1.2%.
The estimated earnings growth rate for the S&P 500 for 24Q2 is 13.0%. If the energy sector is excluded, the growth rate improves to 13.8%.
The estimated revenue growth rate for the S&P 500 for 24Q2 is 5.5%. If the energy sector is excluded, the growth rate declines to 5.2%.
The estimated earnings growth rate for the S&P 500 for 24Q3 is 5.7%. If the energy sector is excluded, the growth rate improves to 7.3%.

IT and Communication Services companies contributed 37% of the S&P 500 earnings growth in Q2. They are estimated to contribute 74% of the growth in Q3.
Trailing EPS are now $232.84. Full year 2024e: $242.51. Forward earnings: $260.60e. Full year 2025e: $279.74, +15.4% on revenues up 6.0%.

Trends in Job Openings have been well correlated with S&P 500 earnings growth… until now.

Pre-announcements for Q3 are good:

The trailing P/E is 23.2 and the forward P/E is 20.8.


VALUE?
The Chinese market looks relatively attractive value-wise. But is has for quite a while now and money keeps leaving it as investors increasingly fear another Japanesation of China.
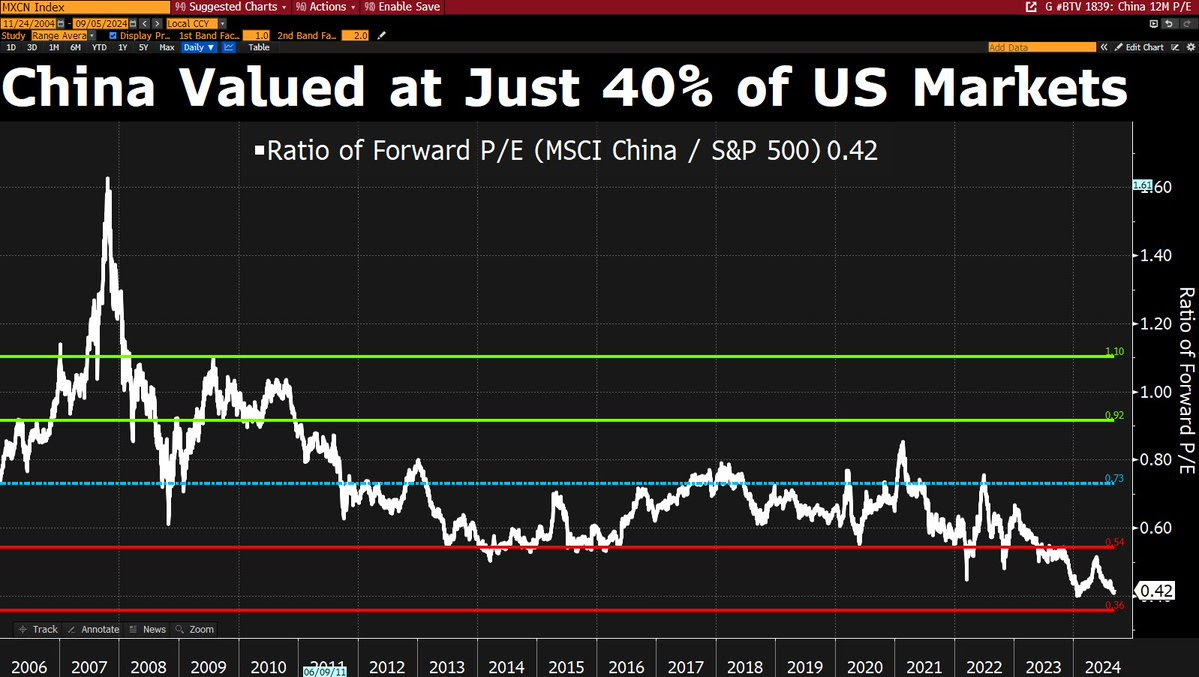
The problem is that Beijing fails to understand the balance sheet recession underway. Chinese households have been so shocked by the housing mess that they could stay on the sidelines quite a while and keep saving at a high rate. The Chinese government needs to offset such high savings to maintain growth but it also seems to be shying away from boosting its deficit.

Xi Jinping has a strong understanding of technology but it is becoming obvious that economy and finance are not his strong suits. His aversion to debt could be an economic blunder. With rising tariffs and a high dependence on real estate and construction, nearly 25% of the economy, the balance of risk is clearly toward slower for longer in China.
The central bank has been cutting interest rates but nobody is borrowing in a balance sheet recession.
The message from the Chinese bond market is ominous to all but to Beijing.
- China Deflation Risk Grows as Signs of Economic Weakness Mount Slowest core CPI since 2021 boosts case for stronger stimulus
The consumer price index excluding volatile food and energy costs rose just 0.3% in August from a year earlier, the least since March 2021, the National Bureau of Statistics said Monday. The broader CPI increased 0.6%, missing expectations even though it was buoyed by higher food costs due to bad weather last month.
Taken together, the figures provide further evidence of weak consumer demand in the world’s second-largest economy, prompting calls for more measures to stave off a negative cycle of declining corporate revenue, wages and spending. (…)
Weak consumption and investment demand have led to intense price wars in sectors including electric vehicles and solar. This is denting China’s chances of hitting its growth goal of about 5%, as consumers delay purchases and businesses slash wages.
Prices of vehicles fell 5.5% while those of phones and other communications equipment dropped 2.1%, according to official data. (…)
Factory-gate prices remained stuck in deflation, as they’ve been since late 2022, with the producer price index sliding 1.8% from a year earlier, more than economists’ forecast of a 1.5% drop. (…)


ING:
Non-food inflation painted a more concerning picture for those worried about deflation. Non-food inflation fell to 0.2% YoY [-0.3% MoM in August], the lowest level since July 2023, and there is a risk that it could move toward negative levels in the next few months if there are no new stimulus measures to boost consumption activity.
The transportation and communications category was the biggest drag on non-food inflation at -2.7% YoY. Heavy competition in the auto sector continued to lead to deflation in the transportation facility category, which registered at -5.5% YoY in August. Communications facilities also saw a -2.1 % YoY decline amid price competition and limited appetite for smartphone upgrading in an environment of heightened household caution over discretionary spending.
The property market weakness also continued to translate to lower rent prices, which fell -0.3% YoY in August, unchanged from July’s level.
(…) the data showed that weak consumption momentum is starting to translate into deflationary pressure in various categories.
‘Super Mario’ Draghi Pitches Big Spending to Fix Europe’s Economy The 77-year-old former ECB chief delivered his prescription for jump-starting Europe’s sluggish economy and strengthening its defense industry.
Draghi, among the continent’s most respected figures, was tapped by the European Union’s top official last September to create what has become a much-anticipated report amid escalating worries about how far Europe is falling behind the U.S. and China economically. (…)
His report calls for a far more aggressive industrial policy and subsidies, changes to the bloc’s competition policy and a reshaping of European capital markets to attract investment.
The report will likely trigger intense arguments across the bloc, with some countries worried about Europe becoming too protectionist. It comes as political crises in Germany, France and other big European economies complicate agreement on EU-wide changes.
Some of the ideas Draghi is pushing, from expanding the single market to building a pan-EU capital union to boost investment, have been on the table for years. The EU’s 27 national governments have failed to advance them. (…)
Draghi said failure to implement reforms would leave Europe in an existential crisis.
“If Europe cannot become more productive, we will be forced to choose. We will not be able to become, at once, a leader in new technologies, a beacon of climate responsibility and an independent player on the world stage,” he said in the report. “We will not be able to finance our social model. We will have to scale back some, if not all, of our ambitions.”
Draghi said that EU countries need hundreds of billions of euros of additional investment annually, amounting to roughly 5 percentage points of the bloc’s output, to create a competitive digital and carbon-neutral economy. He said public investment in areas like breakthrough innovation, defense procurement and energy is critical for promoting private investment that would boost the continent’s productivity.
The bloc’s competition policy should change so that the rules don’t become a barrier to economic growth. He said the EU’s antitrust authorities should put more weight on whether a merger can boost EU innovation and can help create globally competitive companies.
Prompting the report is 15 years of European economic underperformance that leaders are struggling to address. (…)
Draghi said Europe needs to focus on closing an innovation gap with the U.S. and China.
The U.S. Inflation Reduction Act, which offers hundreds of billions in tax breaks and other subsidies to the clean-tech sector, has lured some European companies to shift investment plans to the U.S. (…)
Funding industrial subsidies would be challenging since European governments are already financially strapped and face pressure to boost social and military spending. One proposed solution, issuing pan-EU bonds to finance investment, faces strong opposition in Berlin and elsewhere. (…)
To address rising global tensions, Draghi advocated greater EU funding of defense research, changes in competition policy to allow industry consolidation and, as spending rises, a preference for buying European products.
European countries have significantly increased military spending in recent years, but much is for imports from the U.S. or other non-EU countries.
“Security is a precondition for sustainable growth,” Draghi said.
Boeing Reaches Deal With Biggest Union Boeing agreed to increase wages by 25% for its largest union in a four-year pact aimed at preventing a crippling strike.
Solar and Wind Power Projects Under Construction




 .