May CPI: Confidence Boost
Consumer prices were flat in May, a tenth softer than the consensus forecast and the first month in which the headline CPI did not increase since July 2022. A 2% decline in energy prices in May restrained inflation in the month, with gasoline prices sliding 3.6% and energy services prices falling a smaller 0.2%. Food prices posted a meager 0.1% increase, with flat grocery store prices partially offset by a 0.4% increase in prices for food consumed away from home.
It is still early in the month, but so far there are preliminary signs that the slide in gasoline prices continued in June, which bodes well for another tame increase in headline inflation when the next CPI report comes around. The headline CPI has increased 3.3% over the past year, which marks an improvement on the 4.0% increase registered in May 2023 but is still about a percentage point faster than the pace prevailed on the eve of the pandemic.
May’s downside surprise versus our expectations can be chalked up entirely to a softer-than-expected core reading. Excluding food and energy, prices rose a “low” 0.2% (0.16% before rounding) versus expectations for a 0.3% gain. Goods prices were flat over the month as a jump in prescription drugs and rebounds in used autos, motor vehicle parts & equipment and tobacco products offset price declines for new vehicles, apparel, and communication commodities.
Although overall goods prices were somewhat firmer than expected (we looked for a decline of 0.1%-0.2%), the drivers of May’s relative strength suggest there may still be scope for additional deflation in the goods sector. Auction prices point to used autos resuming their decline over the next couple of months, while prescription drug pricing and prices for tobacco products tend to move idiosyncratically.
More encouraging for the inflation outlook was a sharp slowdown in core services. Core services rose 0.2% in May [0.22%], the smallest monthly gain since September 2021. Shelter disinflation remains painfully slow, with rent of primary residences and owners’ equivalent rent each rising 0.4%, the same as in April [actually the former was up 0.33%, the latter 0.43%].
However, signs of services inflation cooling off more meaningfully were evident elsewhere. Excluding primary shelter, core services were flat over the month. While price increases for medical care were little changed, travel-related prices fell 1.4% over the month amid declines in airfare, lodging and car rentals. Meantime, motor vehicle insurance prices slipped 0.1%—the first outright decline since 2021 and a marked slowdown from the 1.7% average monthly increase over the past year. We view this as a sign that the more benign environment for goods inflation over the past year is finally feeding into services.
On balance, inflation continues to edge lower. Consumer prices have increased 3.3% over the past year compared to 4.0% this time last year. Similarly, the core CPI has eased to a year-over-year pace of 3.4% versus 5.3% last May.
After strengthening in the first quarter, inflation appears to be back on a downward path, but there is still a bit more distance from its desired destination. Even with today’s softer report for May inflation, the core CPI has increased at a three-month annualized rate of 3.3%.
Details of today’s report also point to the core PCE deflator—the Fed’s preferred measure of inflation—not slowing as sharply in May given that some of the major drivers of the soft core CPI, such as airfares and motor vehicle insurance, are derived from the Producer Price Index. With today’s data in hand, we estimate the core PCE deflator rose 0.24% in May, essentially on par with the 0.25% rise in April, but we will refine after tomorrow’s release of the May Producer Price Index.
We see inflation pressures continuing to subside amid a cooling jobs market, an increasingly stretched consumer, and smoother-functioning supply chains, which should drive the monthly pace of inflation lower as the year progresses even if unfavorable base effects leave the year-over-year pace stuck near current levels.
However, we think the FOMC will need to see at least a couple more inflation reports like this one before it feels confident enough to reduce the fed funds rate.


Goldman Sachs:
The composition was not quite as soft because airfares and car insurance prices declined at an unsustainable pace and shelter categories reaccelerated marginally. That being said, prices generally fell for discretionary consumer goods, reflecting increased discounting and price cuts that likely continued during June. (…)
Labor-reliant services categories generally rose at a moderate pace (food away from home +0.35%, car repair +0.3%, personal care services +0.2%), though hospital services (+0.5%) and daycare (+0.6%) prices were relatively strong. Lodging prices edged down 0.1%. Non-housing services inflation was weak at -0.04%, down sharply from +0.42% in April and +0.66% on average in Q1.

Atlanta Fed’s Sticky-Price CPI Remained Elevated in May
The Atlanta Fed’s sticky-price consumer price index (CPI)—a weighted basket of items that change price relatively slowly—rose 2.4 percent (on an annualized basis) in May, following a 4.6 percent increase in April. On a year-over-year basis, the series is up 4.3 percent. The Core-Sticky CPI is up 4.0% annualized, down from 4.7% in April and 5.4% in May.

But, as John Authers shows,
In the case of the trimmed mean, its rise last month was equivalent to an annualized rate of less than 2%, back below the Fed’s target for the first time in three years:
Source: Federal Reserve Bank of Cleveland, Federal Reserve Bank of Atlanta
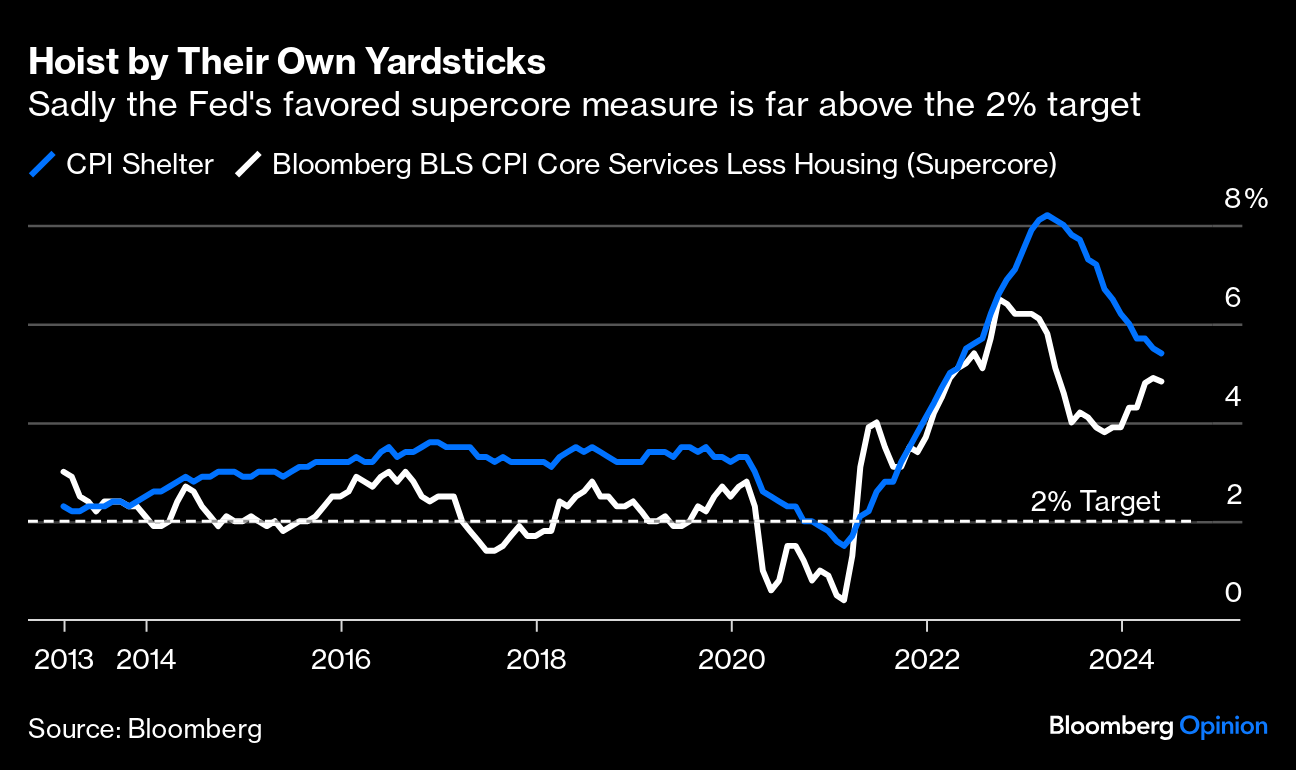
Meanwhile, the central problem, as far as the Fed is concerned, is barely alleviated. Shelter insurance, which many complain is compiled with too great a lag, remains obdurately high. Higher interest rates should affect house prices and rents quite directly, but the market’s post-pandemic bottlenecks seem to be stopping that from happening. To account for the ongoing questions over measuring shelter prices, Chair Jerome Powell and his colleagues chose to focus on the so-called supercore of services excluding housing, a measure particularly influenced by wages. The good news is that both indexes fell last month — a bit. The bad news is that they’re still far too high for comfort and continue to make it hard to cut rates:
Source: Bloomberg
In all:
- Zero monthly inflation, outside of recessions, less than 6% of the time since 1970.
- Rare to get a soft core (0.16%) along with negative energy and food prices all at once.
- We almost got a doughnut (+0.08%) on my CPI-Essentials (food, energy and shelter) in spite of shelter’s stubborn +0.4%.
- CPI-Food-at-Home has declined each of the last 4 months. Only twice outside of recessions since 1970. American consumers are getting a big inflation break.
Temporary, transitory?
Stung by Past Mistakes, a Wary Fed Takes Its Time Jerome Powell’s approach on inflation forecasts and rate cuts amounts to ‘trust, but verify’
Most officials projected they could lower rates once or twice at four remaining meetings this year, suggesting a start to cuts no sooner than September—even after an inflation report earlier in the day suggested price pressures moderated last month.
“We’re looking for something that gives us confidence that inflation is moving sustainably down,” Powell said at a press conference in which he used the word “confident” or “confidence” 20 times.
The European Central Bank and the Bank of Canada cut interest rates last week and indicated additional reductions were possible even though inflation remains above their targets—because they expect inflation to keep declining. “Overall, our confidence in the path ahead, because we have to be forward-looking, has been increasing over the last months,” said ECB President Christine Lagarde last week. (…)
To be sure, the trust-but-verify approach risks putting the Fed in a catch-22. Powell and his colleagues are waiting until they have more convincing evidence that the Fed’s interest-rate setting is as restrictive as they think it is. But that raises the risk it will be too late to avoid a more serious employment downturn by the time they see that evidence, a point Powell acknowledged on Wednesday.
“We completely understand that that’s the risk—and that’s not our plan, to wait for things to break and then try to fix them,” Powell said.
A series of inflation readings that are persuasively benign would liberate them from this trap. The alternative is for the Fed to wait to see more economic weakness before initiating rate cuts. (…)
Powell on Wednesday said the decision to cut rates would be a “consequential” one because it could ignite substantial market rallies that boost spending and investment. But he played down the idea that the exact month in which the Fed starts lowering rates by a quarter-percentage point, or 25 basis points, would matter as much. (…)
- Jerome Powell Is a Happy Federal Reserve Chief He thinks the central bank’s policy is working, though is it really ‘restrictive’?
(…) In their famous “dot plot” estimates of future economic conditions, the Fed governors and regional bank presidents lifted their projections for “core” inflation this year to 2.8%, up from 2.6% in March and 2.4% in December. They also downshifted their expected cut in rates to a single 0.25 point reduction through the rest of this year, down from three in March. (…)
Does the May CPI contradict the more hawkish FOMC projections? The Fed press corps tried to poke at this point at Mr. Powell’s press conference but came up mostly empty. It’s only one month, he explained, and after the first quarter’s inflation surge he and his mates want more evidence that inflation is on a path to being vanquished.
It isn’t dead yet, as consumer prices remain 3.3% above what they were 12 months earlier, even after May’s good news. Service prices (excluding energy) are up 5.3% in the last 12 months, and “core” CPI (less food and energy) is up 3.4%. The Fed’s target is 2%. (…)
The Fed is hardly oblivious to politics, but Mr. Powell is right to avoid the pressure for easier money.
All the more so because it isn’t clear that Fed policy is as “restrictive” as Mr. Powell says. He repeated that more than once on Wednesday, but we have a hard time finding that in the financial or economic data.
The job market has slowed somewhat but remains strong, consumer spending has slowed but continues to be solid, and financial conditions are far from tight. Equities keep hitting new heights, Bitcoin and gold are investor favorites, and commodity prices remain high. If there’s evidence of a looming recession, we don’t see it (…).
The Dot Plot:
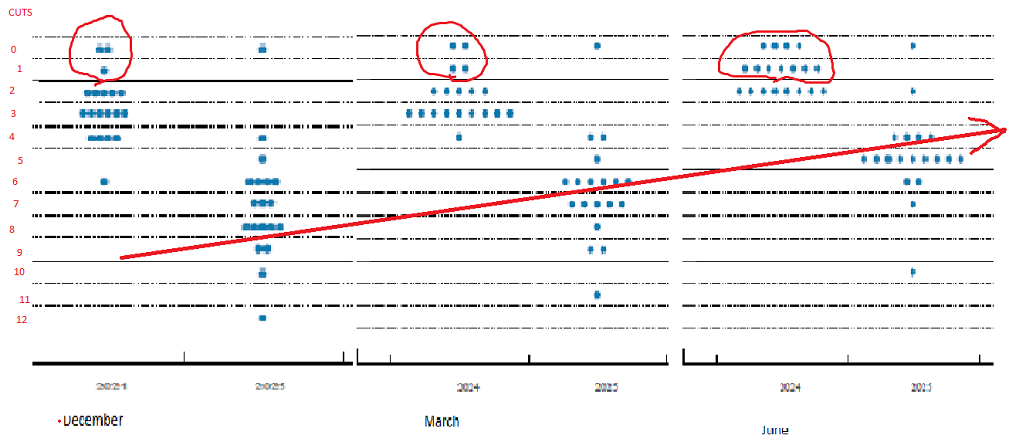
The “dot plot” showed seven officials expected one rate cut this year, while eight saw two and four expected none.
Officials also lifted their estimates of where rates will settle in the longer term to 2.8%, from 2.6% at the March gathering, according to the median projection. The increase, following a slight bump in March, has been fueled in part by the recent resilience of the economy.
“People have gradually been writing it up because I just think people are coming to the view that rates are less likely to go down to their pre-pandemic levels,” Powell said. (Bloomberg)

NBF observes that
The Summary of Economic Projections (SEP) showed no revision to the growth outlook, with GDP still forecast to grow by 2.1% in 2024 and 2.0% in 2025 and 2026. The unemployment rate forecast, for its part, was revised slightly upwards in both 2025 and 2026, moving from 4.1% to 4.2% and from 4.0% to 4.1%, respectively. Notably, policymakers expect unemployment to hold steady at 4% for the balance of this year. Supporting the upward shift in the dots, the headline and core PCE inflation outlook was marked up 0.2% in 2024 and 0.1% in 2025. (…)
Policymakers have assumed that the economy remains rock solid this year. They see the steady rise in the jobless rate halting and growth remaining strong into the end of year. We disagree on both of these fronts. Should the data released over coming months come closer in line with our expectations, it’s possible that the next iteration of the dot plot could add a cut back in.

Note that the unemployment rate is already at 4.0% in May, up from 3.7% in January, a period during which Initial Unemployment Claims rose 10.7% through June 1.
Here follows my usual self-drawn compilation, made by snipping the images in the Fed press release and then playing around in Paint. The December dots for 2024 and 2025 are on the left, with March’s in the middle and the latest on the right. The lower the dot, the more cuts that FOMC member is predicting:
Last time around, a slight majority thought there would be at least three cuts this year. Now nobody does. A majority expects one cut or fewer. It’s not surprising, but it is interesting to quantify how much opinion has moved. Meanwhile, two things are evident about projected rates for the end of 2025; they’re steadily moving upward, and there is still a wide range of opinion. The two outliers think there will be 10 cuts by then, and zero.
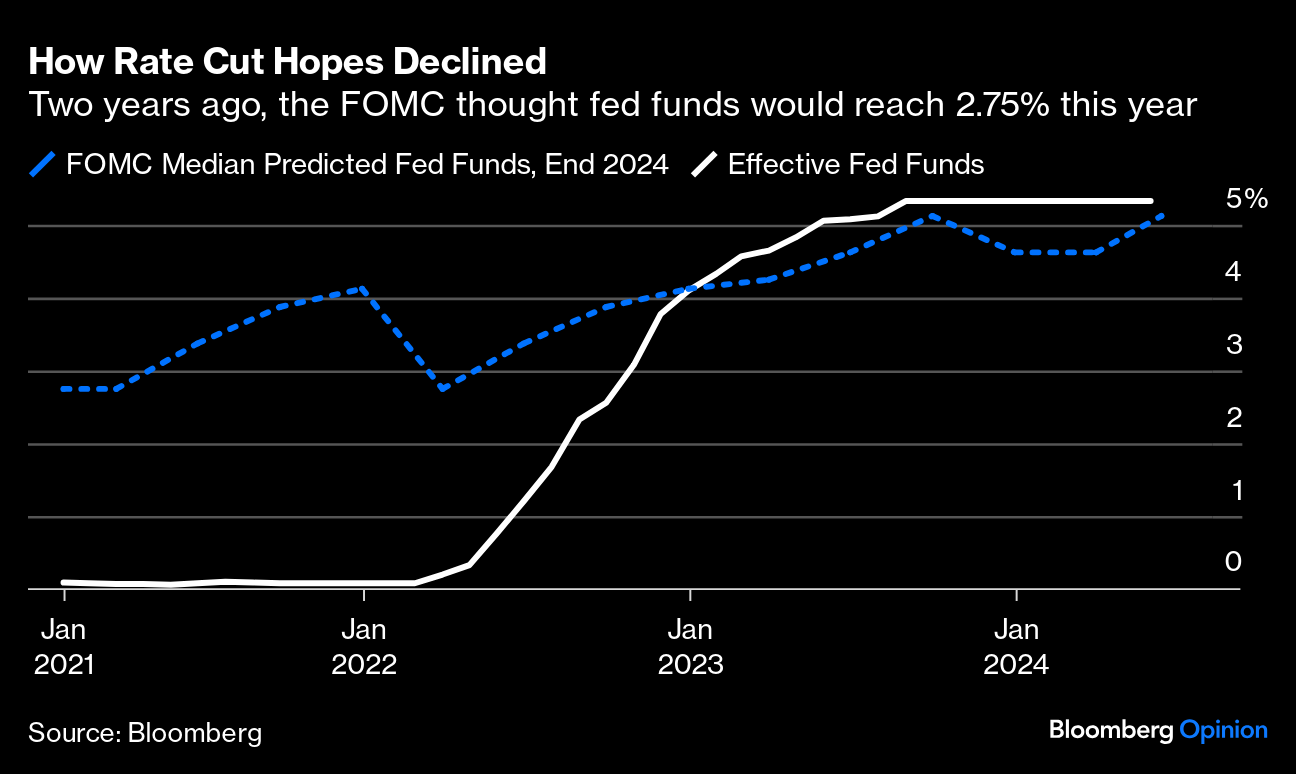
If we look at how the median dot for the end of this year has moved, the loss of confidence in cuts is clear. At the notorious “pivot” meeting last December, when Powell surprised almost everyone with a far more dovish assessment, FOMC members brought down their forecasts. They have now reversed completely — a decision more notable because they eschewed the chance that the May data gave them to declare victory with falling inflation and strong employment:
Source: Bloomberg
(…) Perhaps the most awkward moment of Powell’s press conference came when he was asked whether members had placed their dots before or after the inflation numbers, and he revealed that they had had the opportunity to change them. While surprisingly good, the May data still didn’t move the odds on monetary policy in the minds of the central bankers.
Another development deserves more attention. FOMC members also give their estimate for the long-term fed funds rate. That number dropped to 2.5% before the pandemic, implying belief in a distinctly lower inflation environment as the norm for the future. The estimate is now back up to 2.8%, the highest since 2019, and chances are that it has further to move.
Powell left the Fed’s options wide open. A negative take is that it doesn’t have a clue what’s happening next. A more positive interpretation is that the Fed isn’t the only one baffled by the economic data at present, and that it’s wise to remain reactive. Either way, the May inflation data were undeniably good, and are consistent with rate cuts later this year, perhaps as early as September. But there’s still too much unknown to go further than that.
Is it time to be max bullish?
The distinction between equity allocation (what percentage of the portfolio should be held in stocks) and equity selection (which types of stocks to hold) is a critical component to portfolio construction. Currently, we are broadly bullish in our outlook for most sectors and regions of the market, but we do not view it is the appropriate time to be max overweight stocks as an asset class.
Perhaps the most important near-term support for the stock market is the ongoing acceleration of corporate earnings. Earnings growth has been accelerating since the end of 2022, and we forecast further acceleration over the next several quarters. Not only is growth accelerating, but critically, it’s also broadening out.
Accelerating profit growth and ample liquidity strongly argue for investors to be overweight cyclicality within their portfolios, particularly in the areas of the market likely to generate superior earnings acceleration in the coming quarters. While this has also historically been a good time to be overweight stocks, there are other considerations that play into the asset allocation decision:
Selection vs. allocation: Historically, it has paid to separate the asset allocation decision from the equity selection decision. During the past three cycles, the optimal time to rotate away from the cycle’s dominant leadership has been anywhere from eight months to four years removed from the optimal time to go all-in on equities.
1. The Late 80s/Early 90s: The time to shift equity selection away from Japan and toward the rest of the world was around the peak of the Japanese stock market bubble in November 1988 after which Japan drastically underperformed other equity markets. However, the ideal time to be max weight in one’s equity allocation as a whole was much later, in January 1993 (Chart 2). While stocks did rise between 1988 and 1993 with some parts of the equity market doing quite well (i.e. defensive US stocks), the bond market trounced the broad global equity markets during this period (59% vs. 10%). (See Chart 3)
2. The Tech Bubble: At the end of the Tech Bubble, the ideal time to shift out of Tech and into just about everything else was in March 2000, but the ideal time to overweight the equity asset class was over 2.5 years later, at the bottom of the bear market in October 2002 (Chart 4). Between these two periods, bonds drastically outperformed equity markets broadly (Chart 5).
3. The Global Financial Crisis: The optimal time to rotate equity selection away from the prior cycle’s leadership in energy stocks came in June 2008, marking the beginning of the sector’s subsequent decade of underperformance (Chart 6). However, the biggest equity allocation opportunity came eight months later after global stocks had fallen another 50% (Chart 7).
In each of these instances, the excitement over the cycle’s dominant leadership created incredible investment opportunities in other parts of the equity market. In terms of selection, investors should have been wildly bullish US Tech stocks in 1990, Energy stocks in 2000 and US Tech stocks again in 2008. But in each of these instances, there were much better opportunities to increase equity allocations.
Sentiment/valuation: With returns greatest when capital is scarce, the time to be most overweight an investment is when nobody wants to own it. Fifteen years into this secular bull market in US stocks, that is clearly not the situation today. Household equity allocations are at record highs (Chart 8), and the only month in the Conference Board survey’s history where survey participants were more bullish on stocks than they’ve been recently is at the start of 2018 (Chart 9). Meanwhile, the S&P 500® valuations in this post-pandemic period rival levels seen in the Tech Bubble. In addition to being strong predictors of long-term returns, valuation/sentiment are important risk indicators, suggesting that all else equal, the downside potential if the growth and liquidity environment were to weaken is higher today than normal.
Relative attractiveness: The decision to overweight equities cannot be made in isolation, as it can only be achieved by underweighting another asset class. We expect that we are in the early stages of a period of higher inflation and higher interest rates. Structurally, this argues for a lower weight in traditional fixed income compared to stocks and cash. But comparing valuations across asset classes suggests that some of this may already be reflected in markets. While some may take issue with comparing equity earnings yields to bond yields, the comparison gives you a sense for how the relative valuations have trended over time. Interestingly, the S&P 500® earnings yield is now lower than 10-year Treasury yields for the first time since the Financial Crisis and lower than cash yields for the first time since the Tech Bubble. Similarly, the S&P 500® dividend yield hasn’t lagged cash yields by this much since the 1980s!
We see enormous opportunities within the stock market despite some challenges for the asset class.
Given the bifurcated equity market, equities as an asset class are not particularly attractive relative to bonds and cash. However, specific equity themes seem very appealing.


Can China’s Export Machine Run Without the West? Beijing looks to developing markets after facing new tariffs in the U.S. and Europe
The question for Beijing is whether a pivot to the developing world will be enough to keep its export machine humming.
China’s latest trade data released last week said a lot. Exports in May increased 7.6% from a year earlier in dollar terms, while imports rose 1.8%. The implosion of China’s housing market has dragged down domestic demand, so Beijing has revved up its export engine to drive growth. (…)
Some of the recent strong growth could be due to manufacturers trying to front-run potential trade restrictions. China’s exports to the U.S., for example, rose 3.6% on-year in May, contrary to the trend of the past couple of years. But overall, China has been selling less to the West and more to Southeast Asia and Latin America. Exports to Southeast Asia in the first five months of this year rose 12% from the same period two years earlier. Over the same time, China exported 17% less to the U.S. In 2023 alone, China’s exports to the U.S. dropped 14%.
This could partly be because Chinese companies are rerouting their trades through countries like Vietnam or Mexico, though those countries have also been building up lower-end manufacturing while China moved up the value chain. (…)
But more important, China is selling different types of products than before. New segments including EVs, batteries, solar panels and mature chips accounted for 8.5% of China’s total exports last year, compared with 4.5% five years earlier, according to Morgan Stanley. (…)
Chinese goods with affordable prices might, however, be welcomed in many lower-income countries. Brazil’s sales of EVs and hybrids nearly doubled in 2023, according to dealer association Fenabrave. China’s BYD accounted for more than half of the sales in pure EVs while Chinese automakers were also among the top sellers of hybrids.
Southeast Asia is now a bigger destination for China’s exports than the U.S. or the European Union. Southeast Asia and Latin America together have made up nearly a quarter of China’s exports so far this year, still smaller than the combined 29% share of the U.S. and the EU, but altogether a sizable market with good growth potential. (…)
Many Latin American countries have raised tariffs on steel to protect domestic industries. Brazil has recently reimposed tariffs on EVs to encourage domestic production, starting at 18% and rising to 35% in 2026. In a move that could ameliorate some tensions, Chinese companies have been setting up local manufacturing that could create jobs. BYD, for example, is building an EV factory in Brazil.
China’s export pivot toward developing countries has worked out so far. But in an increasingly protectionist world that playbook will also face limits.
- A New Chinese Megaport in South America Is Rattling the U.S. The Peru project could speed trade with Asia and plant Beijing’s flag in Washington’s neighborhood.
China EV Makers Have Room to Absorb EU Tariffs, Find New Markets
(…) EVs made in China, such as BYD’s Dolphin compact crossover and the MG 4, fetch roughly double on average in Europe compared to their home region, customs data show, giving the manufacturers a cushion against the new tariffs.
“BYD will likely be able to absorb most of the burden from EU import duties, since its cars carry peer-beating profitability,” Bloomberg Intelligence analyst Joanna Chen said. The company was also hit with a lower tariff rate of 17.4% versus the industry average of 21% and as high as 38.1% for SAIC, which owns the British brand MG.
Even with the added tariffs, BYD’s profit per car in Europe could still be around one-and-a-half times higher than the same car sold in China, JPMorgan Chase & Co. analyst Nick Lai said in a note.
BYD has also pushed aggressively into other export markets, from Mexico and Brazil — where it’s investing around $550 million to build its first EV hub outside Asia — to Thailand and Australia. It has also picked Hungary for its first European car factory, which would allow it to avoid the new tariffs by producing locally.
Other automakers are also looking to diversify production to outside China. SAIC told its dealers last year that it’s started seeking potential production sites in Europe, and Chery Automobile Co. has signed a deal with Spain’s EV Motors to produce cars in Barcelona. Geely, which acquired Sweden’s Volvo in 2010, potentially has more flexibility to adjust production. (…)
The Middle East has emerged as a new market for China’s EV makers too, including Chery Auto, Xpeng Inc. and Geely’s premium Zeekr brand. Nio Inc. Chief Executive Officer William Li earlier this month said the EU’s tariff push was going in “substantially the wrong direction” and the company will start expanding to the Middle East later this year.
A survey by AlixPartners released earlier this month found 71% of Saudi residents are “very” or “moderately” likely to buy an EV this year, with brand awareness of Chinese manufacturers higher than in Europe, the US and Japan.
Europe’s tariff hikes will have a “minor impact” on Chinese manufacturers because the region accounts for only a fraction of their total sales, according to Daiwa Securities analyst Kevin Lau. Europe contributed between 1% to 3% of overall sales for BYD, Geely and SAIC in the first four months of this year, he estimated.

 Most of the world will enjoy lower transportation costs (cars, trucks and buses) while the U.S, and the EU “protect” their higher costs manufacturers, which will eventually find that Chinese brands are occupying most of the space in S.E. Asia, the Middle-East, Africa and South America.




 Can China’s AI Technology Compete With the US?


