The enemy of knowledge is not ignorance, it’s the illusion of knowledge (Stephen Hawking)

It ain’t what you don’t know that gets you into trouble. It’s what you know for sure that just ain’t so (Mark Twain)

Invest with smart knowledge and objective odds

THE DAILY EDGE: 16 FEBRUARY 2023

US retail sales surge on stark weather contrast US retail sales jumped 3% month-on-month as warm weather encouraged people to go out and spend after harsh conditions depressed activity in December. Household incomes remain under pressure and with weather patterns normalising a correction is likely in February

This is the fourth biggest MoM rise in retail sales over the past 20 years. Importantly, the “control” group which excludes volatile categories and better correlates with broader consumer spending was also much stronger than anticipated, rising 1.7% MoM versus the 1% consensus.

We knew autos would be strong (+5.9% MoM) given unit volume figures jumped 18%, but there were huge gains elsewhere with clothing up 2.5% MoM, general merchandise up 3.2% (within which department stores saw a 17.5% MoM jump) and eating & drinking out, which surged 7.2%. The one real surprise was the flat gasoline station sales despite prices having risen by more than 4%. (…)

Remember that December experienced very cold temperatures with heavy snowfall disrupting travel in many parts of the nation. This also depressed spending with November and December both posting 1.1% MoM declines. Therefore we should expect a rebound in January anyway, but then very warm temperatures providing an additional stimulus that tempted more people to leave their homes and spend.

However, we have to be a little cautious that with weather patterns returning to more seasonal norms in February we could get a significant correction next month – especially with household finances remaining under pressure from high inflation and slowing wage growth. Consequently, today’s numbers back the case for a March and probably a May hike, but it shouldn’t push the case for Fed tightening beyond that.

The WSJ Justin Lahart details possible reasons for the strength:

There are several likely factors behind the strength in sales. The first is the job market: With the Labor Department reporting that the economy added a seasonally adjusted 517,000 jobs last month, and that the unemployment rate fell to its lowest level in more than 50 years, more people are drawing paychecks. Despite all of the recent layoff headlines, they aren’t worrying much about getting fired, either, with the Federal Reserve Bank of New York’s monthly survey of consumers still showing that people continue to put low probabilities on the possibility of losing their job.

Another factor: Social Security checks were 8.7% bigger last month, as last year’s jump in inflation led the Social Security Administration to put through its largest cost-of-living adjustment in four decades. That means that roughly 70 million people suddenly had more money coming in the door.

Then there is the pandemic. Unlike last year,  the U.S. wasn’t beset by a big Covid-19 wave in January. To the contrary, there were fewer recorded cases last month than in December. As a result, people continued to re-engage in activities such as in-person shopping, heading into the office, and travel. Month-to-month retail-sales growth isn’t benchmarked to last year’s pandemic January, but the drop in cases and contrast in mood certainly could have had a psychological effect on spending. The category that saw the biggest gains in Wednesday’s report was food services and drinking places, where sales rose by 7.2% from December. That is notable because it is the only services category within the report, and Americans spend more on services than they do on goods. If restaurants were busier, maybe nail salons and hotels and dentists were, too.

But:

  • Some economists believe the January jobs numbers are a statistical mirage that will dispel itself when February and March data are released.
  • Bigger social security checks are merely adjusting for past inflation.
  • Lahart omits the weather factor which was obvious in January:
    • Department store sales jumped 17.5% in January after -6.5% in December. Last 3 months: -3.3% or -12.5% a.r. (+0.7% YoY).
    • Restaurants and bars rose 7.2% MoM in January but that came after 0% in December and declining real sales in 6 of the past 8 months. Nonetheless, this particular revenge spending is impressive being up 17.1% YoY in the past 3 months while prices rose 8.3%. Real sales at grocery stores are down 4.2% in the last 3 months.

fredgraph - 2023-02-16T071009.226

Nearly a third of the monthly increase in January retail sales came from restaurants and bars. Control sales, which feed into GDP, rose 2.8% MoM (+8.1% YoY) in January. Excluding restaurants and bars, control sales were up 1.7% (+4.4%).

Americans continue to slow their spending on goods. Labor income was up 8.5% YoY in January but total retail sales were up 6.4% and 4.4% excluding restaurants and bars.

Combining data from the latest retail sales and CPI reports, Goldman Sachs estimates that real core retail sales increased 1.2% MoM in January and only +0.4% on a 3-month annualized basis.

  • Latest Atlanta Fed GDPNow Q1: 2.42% (was 2.16%)

Image

Year-Ahead Inflation Expectations (12)

Current Sales Levels (3)

Current Profit Margins (9)

Year-over-Year Unit Costs (12)

  • Capital One Financial yesterday said that net charge-offs in its credit card division jumped to 3.81% of loans in January from 2.03% in the prior year period, approaching the pre-pandemic baseline of 4.31% in January 2020. 
  • Discover Financial Services predicted that its net charge-offs will range from 3.5% to 3.9% across 2023 vs 1.82% and 1.84%, respectively, in 2022 and 2021. 
China’s new home prices rise in Jan for first time in a year

New home prices in January were up 0.1% month-on-month, versus a 0.2% slide in December, according to Reuters calculations based on National Bureau of Statistics (NBS) data released on Thursday.

More major cities among the 70 surveyed by NBS reported increases in new home prices last month, with prices rising in 36 cities, up from 15 in December. (…)

Prices were down 1.5% year-on-year in January, with the rate of decline unchanged from December. (…)

TECHNICALS WATCH

From CMG Wealth:

Pointing up S&P 500 Large Cap Index – 13/34–Week EMA Trend

  • S&P 500 Index Daily MACD Indicator: Sell Signal – Short-term Bearish for U.S. Large Cap Equities

YIELDS

Data: FactSet; Chart: Axios Visuals

(…) Treasury bills are rarely cast as a route to riches, but right now their payouts are nearly as high as a similar marker in the equity space: profits generated by S&P 500 companies. While the comparison isn’t quite apples-to-apples, it’s a model sometimes employed to get a sense of relative value across asset classes.

Specifically, six-month Treasury bills currently yield a hair below 5%, the highest since 2007. Meanwhile, the S&P 500 earnings yield clocks in at about 5.08%. The gap between them is the slimmest advantage that stocks have held since 2001. (…)

Image

Given what short-term debt is yielding right now, the risk-reward of owning them versus the earnings yield of stocks looks better than seen at any time since the great financial crisis, according to JPMorgan Chase & Co.’s Marko Kolanovic. In other words, the spread between the two-year and the equities earnings yield is at the narrowest since 2007. (…)

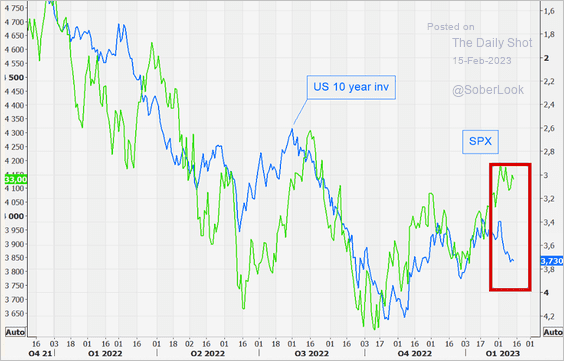
  • Stocks have been remarkably resilient in the face of rising bond yields and higher Fed rate hike expectations.
Source: @themarketear

  • CBO Increases Deficit Forecast, Projects Debt Limit Deadline “Between July and September”

CBO is projecting much larger deficits. CBO is projecting a deficit of $1.41 trillion (5.4% of GDP) for FY23, and $1.58trn (5.8%) and $1.75trn (6.1%) for FY24 and FY25 (…), substantially larger than CBO’s prior projection from May 2022, which showed an average deficit of just under 4% of GDP for 2023-2025. (…)

Higher interest rates and lower asset prices (and lower capital gains taxes) were the main factors behind the upward revision to the current year deficit forecast, along with reduced near-term growth assumptions. (…)

CBO projects that the Treasury will exhaust its resources under the debt limit between July and September. (…)

China Hits Back at US with Sanctions on Lockheed, Raytheon

Lockheed Martin Corporation and a subsidiary of Raytheon Technologies Corp were added to a list of “unreliable entities” due to their participation in arms sales to Taiwan, China’s Ministry of Commerce said Thursday. The companies were fined twice the contract value of their arms sales to Taiwan since September 2020 when the list first came into effect and would be required to pay within 15 days, according to the statement.

China considers the democratically self-ruled Taiwan as part of its territory and has long complained about the US supplying weapons to the island. (…)

As with previous sanctions announced against the firms and other US defense companies, these measures are likely to be largely symbolic given both have little direct exposure to China. (…)

This action “shows that China’s retaliation remains very targeted and refrained, responding to US’ arms sales towards Taiwan, over which China has lodged its protest many times in the past,” said Feng Chucheng, a Beijing-based partner at independent consultancy Plenum. “China is not weaponizing its sanctions, which is consistent with China’s longstanding policies.” (…)

THE DAILY EDGE: 15 FEBRUARY 2023: Gimme Shelter!

Annual Inflation Cooled Slightly in January as Pace of Moderation Levels Off Americans paid more for shelter, gasoline and food last month

Still-elevated inflation cooled slightly at the start of 2023 to 6.4% in January from a year earlier, with energy, housing, food and other items keeping some pressure on prices.

The increase in the consumer-price index, a closely watched measure of inflation, edged down from 6.5% in December, the Labor Department said Tuesday. That marked the seventh straight month of easing inflation since peaking at 9.1% in June, the highest reading since 1981.

But the cooling trend is moderating. On a monthly basis, CPI rose 0.5% in January from December, compared with a previous 0.1% increase. (…)

Core CPI, which excludes volatile energy and food prices, rose 5.6% from a year earlier, down from 5.7% in December. (…)

Grocery prices rose 11.3% in January from a year earlier. (…) Restaurant prices, which some economists watch as a signal of labor-cost pressures, increased 8.2% in January, from a year earlier, around the same as the average gain in the second half of 2022. (…)

The latest data “illustrates that inflation is still declining only gradually,” said Andrew Hunter, senior U.S. economist at Capital Economics. “We still expect that downward trend to accelerate soon, as easing goods shortages feed through and housing inflation starts to turn down.”

Composition of US inflation (YoY%)Source: Macrobond, ING

Source: Macrobond, ING

Note Gimme Shelter Note (The Rolling Stones)

           Ooh, a storm is threatening
          My very life today
          If I don’t get some shelter
         Ooh yeah I’m gonna fade away

The media narrative is all about shelter. To wit, from Bloomberg at 9:43 am yesterday:

“It could’ve been worse,” said Stephen Stanley, chief US economist at Santander US Capital Markets LLC, noting declines in used-car prices and airfares. However, “as long as shelter costs are going up as rapidly as they have been, it’s going to be tough to get inflation down anywhere close to where the Fed would like to see it.” (…)

The details of the report showed shelter was “by far” the largest contributor to the monthly advance, accounting for almost half of the rise. Used car prices — a key driver of disinflation in recent months — fell for a seventh month. Energy prices rose for the first time in three months.

Shelter costs, which are the biggest services component and make up about a third of the overall CPI index, rose 0.7% last month. Owners’ equivalent rent and rent of primary residence increased by the same amount, while hotel stays also climbed.

Advance in US Consumer Prices Points to Persistent Inflation | Overall CPI rises most in three months, boosted by firm shelter costs

The facts:

  • CPI-Used car prices did decline 1.9% MoM, against Manheim’s +2.5% jump (SA). On a non-seasonally adjusted basis, the BLS data was -1.6% vs +1.5% for Manheim which says January data indicate “that the month saw sellers with more pricing power than what is typically seen for this time of year.” Which one is wrong?

image

  • Shelter inflation is unrelenting: +0.6%, +0.8%, +0.7% in the last 3 months respectively for +8.7% a.r. during that period, up from +8.5% and +7.1% in the 2 previous 3-month periods.

fredgraph - 2023-02-14T112856.098

  • The Apartment List rent index has been declining MoM in each of the past 5 months. A Cleveland Fed analysis found that “new-tenant rents lead official CPI rents by about 4 quarters”.

MoM rent growth jan23

  • The “obvious coming decline” in CPI-Shelter has become the official FOMC narrative, widely echoed by just about everybody. I would humbly submit a few observations:
    • Apartment List’s NRI tends to decline in the last 4 months of a year and rise in subsequent months. Coincidences or seasonality?
    • The MoM decline in the NRI peaked in November and was only -0.3% in January, a slowing pattern also seen in 2018, 2019, 2020 and 2022. An increase in February or March would be rather inconvenient.
    • Since 1953 (828 months), CPI-Shelter has only declined 22 times (2.7% of the times) MoM. Since 1983 (480 months), it has only declined 9 times (1.9%) MoM. Rents are very resilient.
    • Since 1953, CPI-Shelter has never declined YoY, except in 2010 post GFC (April 2010 was the worst month at -0.6%!).
    • In fact, CPI-Shelter is intimately correlated with rental vacancy rates, a very basic supply/demand reality. This next chart, which plots the 6-month change in CPI-Shelter with the vacancy rate (inverted), suggests that much, if not all, of the current CPI-Shelter inflation is actually explained by the lowest vacancy rate since 1984.

fredgraph - 2023-02-14T121638.365

    • While it is true that apartment construction rose rapidly in the last 2 years, far outpacing household growth like in the mid-1980s when rental vacancy rates jumped…

fredgraph - 2023-02-14T123800.574

    • … the very limited increase in single-family housing supply after the GFC has significantly restrained total housing availability

fredgraph - 2023-02-14T124757.040

    • …at a time when it is much, much cheaper to rent than to own. Rental demand should thus remain strong for some time:

Fannie Mae estimates that the U.S. is short nearly 4 million housing units while building 1.3M units annually (down from 1.8M one year ago).

The recent sharp jump in mortgage rates totally killed single-family starts (-38% or 500k units/yr in the last 2 years) AND reduced the number of existing homes for sale by 43% or 600k units compared to pre-pandemic levels (per realtor.com) since most existing owners can’t afford to lose their existing low rate mortgage.

In effect, the Fed’s own policies are simultaneously boosting rental demand and exacerbating the housing shortage, a no-fail recipe for higher rents which, ironically, the same Fed wants to see slowing before easing. Confused smile

(…) Richmond Fed President Thomas Barkin, speaking in a Bloomberg TV interview, said that “if inflation persists at levels well above our target, maybe we’ll have to do more.”

Speaking at Prairie View A&M University in Texas, Dallas Fed President Lorie Logan said: “We must remain prepared to continue rate increases for a longer period than previously anticipated, if such a path is necessary to respond to changes in the economic outlook or to offset any undesired easing in conditions.” (…)

Philadelphia Fed President Patrick Harker, speaking later in the day, said he believes policymakers will need to raise interest rates above 5% and possibly higher to counter inflation that is easing only slowly. (…)

New York Fed President John Williams said Tuesday afternoon that having the federal funds rate in a range of 5% to 5.5% by the end of the year — as listed in Fed officials’ estimates in December — is the appropriate framing.

“I do think with the strength in the labor market, clearly there’s risks that inflation stays higher for longer than expected or that we might need to raise rates higher than that,” he told reporters, following a speech at the New York Bankers Association. (…)

While all Fed officials participate in meetings of the Fed’s policy committee, Logan and Harker are voting members this year and Barkin is not. Williams, as New York Fed president, is a permanent voting member, along with the Fed’s seven governors. (…)

The other bad news for the Fed in the CPI report is that CPI-Services ex-shelter jumped 0.8% MoM (+7.2% YoY) in January after 3 very subdued months. While wage increases have slowed below 4.5% a.r. in recent months (+5.1% YoY in January), energy costs jumped 2.0% MoM (+8.4% YoY).

fredgraph - 2023-02-15T065424.793

Today we get January Retail Sales. Americans are still fighting high inflation on “essentials”, up 0.8% MoM (8.4% YoY):

fredgraph - 2023-02-15T070516.585

Oil Demand to Hit New Record This Year as China Reopens, IEA Says The energy watchdog raised its forecasts for oil demand this year to a record level, as China fueled a surge in air travel and Russian production remained surprisingly resilient to Western sanctions.
Strong dollar fuels wave of emerging market currency devaluations

The chase for EM assets has been extreme. Latest relative under performance is slightly concerning for the “all in “EM crowd (chart 2). (The Market Ear)

BoA

Refinitiv

BofA

The crowd is all in on the EM long trade, but EM assets have performed relatively poorly lately. EEM (full of China tech that is trading offered) has been fading. Same goes for the EMB (EM bond ETF). You watch closely when EM assets start showing this type of under performance.

Refinitiv

SURVEYS SAY:

The Conference Board Measure of CEO Confidence™ in collaboration with The Business Council stands at 43 to start 2023, up from 32 in the final quarter of 2022. A total of 142 CEOs participated in the Q1 survey, which was fielded between January 17 through 30.

image

The Measure’s improvement early in Q1 2023 represents an uptick from the extreme weakness seen last year, which brought it to lows comparable to the depths of the COVID-19 recession in 2020. However, it is still below a reading of 50, indicating more negative than positive responses.

Downturn still likely: In the survey, 93 percent of CEOs still report they are preparing for a US recession over the next 12-18 months (compared to 98 percent in the Q4 2022 survey). They also still expect that the recession will be brief and shallow with limited global spillover (86 percent).

However, the percentage who are preparing for a deep US recession dropped from 13 percent in Q4 2022 to 7 percent in Q1 2023, signaling that some CEOs are somewhat less pessimistic. Nonetheless, 55 percent of CEOs believe that a global recession is the greatest challenge for their companies.

  • About 16% of CEOs reported economic conditions were better compared to six months ago, up from 5% in Q4.
  • 55% said conditions were worse, down from 81%.
  • 23% of CEOs reported that conditions in their industries were better compared to six months ago, up from 15%.
  • 43% said conditions in their own industries were worse, down from 52%.
  • 18% of CEOs said they expected economic conditions to improve over the next six months, up from 5% in Q4.
  • 48% expected conditions to worsen, down from 73%.
  • 26% of CEOs expected conditions in their own industry to improve over the next six months, up from 19%.
  • 33% expect conditions to worsen, down from 54%.
  • 37% of CEOs expect to expand their workforce over the next 12 months, down from 44% in Q4.
  • 81% of CEOs expect to increase wages by 3% or more over the next year, down slightly from 85% in Q4.
image
  • NFIB

From Bespoke:

(…) Hiring plans remain at the low end of the pandemic range even after a slight rebound versus the December reading. Meanwhile, compensation plans have plummeted to a new low and the weakest level since April 2021. That was in spite of actual employment changes showing net hirings at the highest level since March 2020 with a coincident uptick in compensation to the highest level in six months. (…)

(Bespoke)

  • Investors are now less certain about an impending recession.

BofA Global Research via The Daily Shot