January’s Hiring Boom Caught Economists by Surprise The U.S. added more than a half million jobs last month. Forecasters had expected less than 200,000.
(…) The January figures can be particularly hard to predict, economists say, because seasonal adjustment factors play a big role. Statistical agencies adjust all sorts of figures to make them comparable month-to-month and help people better understand what is going on with the economy. It is no surprise that employers let go of holiday workers in January or that Americans buy more hot dog buns before July 4. The question is how much more or less than typical.
On an unadjusted basis, the U.S. shed 2.5 million jobs in January. A year earlier they shed 2.8 million.
Nela Richardson, chief economist at payroll processor Automatic Data Processing Inc., said seasonally adjusted figures might be skewing true results because the current period could be different from the prepandemic economy. The seasonal adjustments are based on models developed over many years. (…)
The Labor Department considers the latest figures to be preliminary numbers and will revise them in the next two monthly reports. Then once a year, the department uses an expanded data set relying on tax records to more finely tune its estimates. It releases that update each February, alongside January numbers.
The revisions can be large. For example, a year ago, the Labor Department initially estimated 467,000 jobs were added in January 2022, on a seasonally adjusted basis, but after the latest revisions the gain was cut to 364,000.
On Friday the department said it revised the employment level for March 2022, the benchmark month, by more than 500,000 jobs, or an increase of 0.3%. The average adjusted revision over the past decade has been 0.1%, the agency said. (…)
“It is completely confusing,” said Douglas Porter, chief economist at BMO Financial Group. “We have to all be humble in how well we can forecast what lies ahead.”
Recall that last December, the Philly Fed said that the BLS’ Q2’22 payrolls numbers were overstated by 1M workers annualized, or 0.6%. Two weeks ago, the BLS Business Employment Dynamics stats concurred.
Now, the BLS tells us that March ‘22 employment level was 506k more than reported but that its Q2’22 original number was ok.
Go figure!
In the meantime, some people set monetary policies, others investment policies, often based on the former, focusing on this very statistic.
Consider:
- The establishment survey sill suggests a slowdown trend:

- Not so for the household survey:

- Establishment employment is up 3.3% YoY vs +1.9% for the household survey. Which will adjust to which?

- Lay-off announcements suggest that growth in establishment employment (payrolls) is about to turn negative:
Surging lay-offs suggest employment will weaken
Source: Macrobond, ING
- Average weekly hours also bounced back in January. They had steadily declined from a record 34.9 hours in May 2021 to their 2011-2019 normal level of 34.4 hours. At 34.7 in January, weekly hours exceed their best levels between 2011 and 2019.
- Even manufacturing hours jumped a huge 0.4 hours in January.
- Manufacturing production overtime rose 0.2 hours in January.
Increased hours may be due to good weather. The SF Fed’s model suggest the weather added about 120k jobs in January.
This while PMIs all point to recessionary conditions in manufacturing:
Production levels at goods producers also decreased at a solid pace. The rate of contraction was among the fastest since the global financial crisis, despite slowing slightly from December. (…) new orders fell at a steep rate. (…) The rate of job creation eased for the fourth month running.
The ISM said that only 2 industries reported growth in January vs 15 reporting contraction. Seventeen of 18 industries reported a decline in new orders in January.
The jump in payroll employment was especially strong in services, +471k vs +46k for goods-producers. Weekly hours were also up 0.2 hours, well above their 2011-2019 levels.
But purchasing managers surveys only add to the confusion with S&P Global’s signalling “a solid contraction [to 46.8] in business activity across the US service sector at the start of 2023 (…) [and the] pace of employment growth slowed further amid reports of cost-cutting efforts” while the ISM survey jumped 6 points to 55.2 even though “employment was unchanged for the month”.
Jay Powell is slated to speak tomorrow at the Economic Club of Washington, D.C.. The latest data confirm his view of a “very, very strong labor demand”.
However, that very, very strong demand is not translating in stronger wage growth which slipped well below 4.0% annualized in January.

Strange world!
So this data dependent Fed, dedicated to slow demand, looks at this next chart and wonders what to do: the combination of solid jobs growth (blue, +0.33% MoM), a +0.3% gain in wages (black) and a 0.9% increase in hours worked produced a 1.5% MoM jump in payroll income which is now up 8.5% YoY, accelerating from +7.3% in December:

PCE inflation in the 4.5-5.0% range could result in real consumer expenditures rising 3.5-4.0% YoY at a constant savings rate, twice the Q4’22 growth rate.
The FOMC will get one more job report before its next meeting March 21-22. More or less confusion?
The WSJ’s Nick Timiraos:
Fresh signs of a hot U.S. labor market leave the Federal Reserve on course to raise interest rates by a quarter percentage point at its meeting next month and to signal another increase is likely after that. (…)
The department not only reported unusually large job growth in January but—more important for the Fed—it revised previous months’ reported gains higher, suggesting the economy had more momentum than previously anticipated.
Wage growth also was revised higher in November and December. Hourly pay for private-sector workers grew at an annualized rate of 4.6% during the three months through January, up from 4.1% for the prior three-month period.
(…) signs of any reacceleration could prompt officials to delay decisions about a pause into the summer. (…)
(…) “It’s as difficult an economy to read as I can remember,” Summers told Bloomberg Television’s “Wall Street Week” with David Westin. A key question after the jump in US payrolls is whether this is all “going to be income that’s going to be spent, that’s going to lift the economy up a bunch?” or do companies at some point conclude they have too many workers and too much inventory “and we’re going to see a fairly sudden stop.” (…)
Summers concluded, “we have to maintain a lot of agnosticism about where headed.”
What the real world is saying (FT and others):
- More than 500 tech companies have announced layoffs since July (Axios).
- Challenger Gray & Christmas estimates that U.S. employers announced more than 100,000 job cuts in January, up from less than 44,000 in December and 19,000 a year earlier.
- Ford, McDonald’s, UPS and US Bancorp have told investors that they are preparing for at least a mild US recession.
- PayPal blamed a “challenging macroeconomic environment” in announcing 2,000 lay-offs.
- FedEx said it would cut 10% of its senior ranks to align better with customer demand.
- Intel cited “macroeconomic headwinds” to explain why it was cutting the pay of its CEO and other executives and managers.
but
- Mastercard and Visa still see “a resilient consumer”.
- Same with McDonald’s and Mondelez Intl.
- Procter & Gamble sees little evidence of trading down.
- Caterpillar, the industrial machinery group that is considered an economic bellwether, said that its US market “remains relatively strong to date”.
The slowdown in Amazon trailing 12-m revenues per share growth from 35% pre-pandemic to 7% over the last 12 months (and the collapse in margins) clearly reflects the recession in goods as this CPMS/Morningstar chart shows.

And growth in real expenditures on services, expected to offset the goods recession, has slowed to a crawl at the end of 2022.

This jibes with S&P Global’s Services PMI survey:
U.S. Services PMI: Business activity contraction eases at start of 2023, but cost pressures strengthen once again
January data signalled a solid contraction in business activity across the US service sector at the start of 2023, according to the latest PMI™ data. Although easing, the fall in output stemmed from further weak domestic and external demand conditions, as new business and new export orders declined.
Firms continued to expand their workforce numbers despite another fall in backlogs of work, but the pace of employment growth slowed further amid reports of cost-cutting efforts. Nonetheless, business confidence strengthened and was buoyed by increased spending on marketing and investment in cost efficiency.
At the same time, cost inflation picked up for the first time in eight months. A sharper rise in input prices was not reflected in a quicker increase in output charges, however, as selling prices rose at the slowest pace since October 2020.
The seasonally adjusted final S&P Global US Services PMI Business Activity Index registered 46.8 in January, up from 44.7 in December and broadly in line with the earlier released ‘flash’ estimate of 46.6.
Weak client demand hampered business activity, as output fell at a solid pace. Firms noted that inflation and high interest rates weighed on customer spending, with further reports of hesitancy in placing new orders. The rate of contraction softened to the slowest in three months, however.
New business fell for the sixth time in the last eight months, albeit at only a marginal pace. The decline in new orders was linked to lower purchasing power among customers amid strong inflationary pressures.
Alongside subdued domestic sales, new export orders also decreased in January. The rate of contraction in new business from abroad quickened and was among the sharpest since May 2020. Service sector firms stated that global economic uncertainty and high inflation in key export markets weighed on export sales.
Cost pressures intensified in the opening month of 2023, thereby bringing an end to a seven-month sequence of easing input price inflation. Higher cost burdens were often linked to increased material prices, but service providers also commonly mentioned upticks in wage bills. The rate of cost inflation was historically elevated, but the second-slowest since November 2020.
Efforts to boost sales and remain competitive reportedly hampered firms’ ability to hike output charges in January, despite a marked rise in input prices. The rate of charge inflation was broadly in line with the long-run series average, and the slowest since October 2020. The pace of increase in selling prices moderated for the ninth successive month.
Employment across the service sector increased further during January, thereby extending the current sequence of job creation that began in July 2020. That said, the pace of growth slowed to only a slight pace. Efforts to rein in costs and challenges retaining staff at the current salary level reportedly hampered workforce numbers.
Meanwhile, service providers registered another monthly decline in backlogs of work in January. The rate of contraction was modest overall and matched that seen in December.
Finally, business optimism improved at the start of the year. Service sector firms recorded stronger expectations regarding the outlook for output over the coming year. Hopes of greater new orders, investment in cost-saving methods and increased spending on marketing were often linked to positive sentiment.


 But it does not jibe with the ISM Services PMI: Outside the pandemic, the ISM Services has never risen so much in one month.


New Orders

Employment

Confused? Join the club!
S&P Global explains how its PMI-Services survey differs from the ISM in this article. The main points in my view:
The first, and most striking, difference between the two surveys is that of sector coverage. While the S&P Global PMI for the service sector only includes data provided by companies operating in the US services economy, encompassing a variety of consumer, business and financial services which are provided by the private sector (or otherwise charged for), the ISM services PMI in fact covers any activity other than manufacturing.
The ISM definition therefore includes construction, utilities, agriculture, retail and various aspects of government administration, many of which can blur, dampen or distort the picture of the health of the services economy. Public sector activity, in particular, will tend to dampen any business cycle trend, especially any downturn in private sector activity, hence its exclusion from the S&P Global survey. (…)
Survey respondent bases are different in terms of company size, with S&P Global stratifying its panels not only by sector contribution to GDP but also ensuring an appropriate mix of small, medium and large firms within each sector. In contrast, ISM data are based on ISM members and as such are likely to be biased towards larger companies, with small- and medium-sized firms under-represented.
As smaller firms often behave differently to larger firms during different stages of the economic cycle, or in response to policy changes or international economic conditions, it is important for any survey to ensure robust representation of all different enterprise sizes.
FYI, government employment has been very volatile since mid-summer. It jumped by 74k employees in January after -9k in December, +62k in November and +15k on average in Sep-Oct.
What about earnings, guidance and revisions, investors’ real world?
EARNINGS WATCH
From Refinitiv/IBES:
Through Feb. 3, 250 companies in the S&P 500 Index have reported earnings for Q4 2022. Of these companies, 69.6% reported earnings above analyst expectations and 27.2% reported earnings below analyst expectations. In a typical quarter (since 1994), 66% of companies beat estimates and 20% miss estimates. Over the past four quarters, 76% of companies beat the estimates and 21% missed estimates.
In aggregate, companies are reporting earnings that are 1.3% above estimates, which compares to a long-term (since 1994) average surprise factor of 4.1% and the average surprise factor over the prior four quarters of 5.3%.
The actual earnings growth of the 250 companies that have reported so far is -4.5%. After the first 263 Q3 reports, earnings were up 2.4%.
Of these 250 companies, 65.2% reported revenue above analyst expectations and 34.8% reported revenue below analyst expectations. In a typical quarter (since 2002), 62% of companies beat estimates and 38% miss estimates. Over the past four quarters, 73% of companies beat the estimates and 27% missed estimates.
In aggregate, companies are reporting revenues that are 0.9% above estimates, which compares to a long-term (since 2002) average surprise factor of 1.3% and the average surprise factor over the prior four quarters of 2.5%.
The actual revenues growth of the 250 companies that have reported so far is 5.3%. After the first 263 Q3 reports, revenues were up 11.7%.
Inflation averaged 7.1% in Q4’22 (core +6.0%) vs 8.3% in Q3 (core +6.3%).
For Q4’22,
- the estimated earnings growth rate is -2.7% [-2.2% on Jan. 6]. If the energy sector is excluded, the growth rate declines to -7.0% [-6.7%].
- the estimated revenue growth rate is 4.6% [4.1%]. If the energy sector is excluded, the growth rate declines to 3.7% [3.3%].
For Q1’23,
- the estimated earnings growth rate is -2.5% [1.0%]. If the energy sector is excluded, the growth rate declines to -4.3% [-1.1%].
- the estimated revenue growth rate is 1.5% [2.5%]. If the energy sector is excluded, the growth rate declines to 2.0% [2.6%].
Analysts are thus saying that a 1.5% gain in revenues will result in -2.5% decline in earnings when, in Q4, +4.6% revenue growth translated into -2.7% in profits.
This while inflation on both revenues and costs is well above 4%. Morgan Stanley’s Mike Wilson says that “80% of S&P industry groups are seeing cost growth in excess of sales growth”. He continues:
“We think margin pressure is what will drive the downside we are expecting in 2023 earnings—as inflation falls companies will struggle to cut costs as quickly as pricing power erodes. We have already seen margin trouble for a number of companies that have reported 4Q earnings and we only expect the issue to heat up as we move further into the year. EBIT margins for 2023 have fallen 1.2% for the S&P 500 since the end of last year. The industry groups that have seen the biggest margin downside are Autos, Energy, and Capital Goods. Net margins for 2023 have fallen 1.5% for the S&P 500 since the end of last year.”
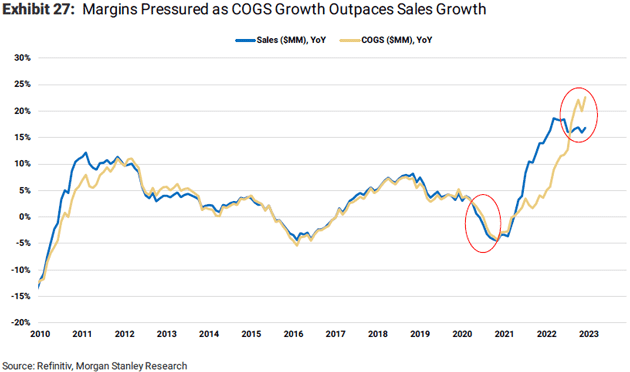 Source: Morgan Stanley via John Mauldin
Estimates are slowly being revised down across the board since mid-December…


…increasingly encouraged by official corporate guidance. Thirty-nine companies have pre-announced Q1’23, substantially fewer than the 52 that had pre-announced at the same time during Q4. But more companies have guided negatively whereas many others have simply decided not to offer any guidance at this time. Not a good sign.

Note that Factset’s compilation shows that 43 companies have offered guidance for Q1’23 with 37 negative and 6 positive (86% negative vs 5 and 10-year averages of 59% and 67% respectively).
Factset also says that 251 companies have issued guidance for the current fiscal year with 129 negative and 122 positive (51% negative).
The Hottest Sectors of the Reopening Are Now Driving a Wage Slowdown Things are starting to look more normal
(…) Here’s a look at the annualized pace of change in average hourly earnings for production and nonsupervisory employees across various time frames:
So what’s behind this decline?
Sectors that exerted the fastest upward pressure on overall wages during the economic reopening over the last two years are now driving the deceleration.
As you can see in the chart, there were massive spikes in leisure and hospitality, education and health services, professional and business services, retail trade, and transportation and warehousing. Those five categories have now come sharply off the boil. Meanwhile the categories where the contribution to total wage growth was always more muted — for example construction or wholesale trade — are still somewhat elevated, but don’t change the picture much for overall wages. (…)


States Are Flush With Cash, Which Could Soften a Possible Recession Rapid recovery, federal stimulus leave state finances in historically strong shape
States will hold an estimated $136.8 billion in rainy-day funds this fiscal year, according to the National Association of State Budget Officers, up from $134.5 billion a year earlier, when they represented 0.53% of gross domestic product, the highest in records going back to 1988. This year’s figure would represent roughly 12.4% of their total spending.
Unlike the federal government, most state and local governments must balance their budgets every year. That means that a fall in tax revenues must be offset, most often by cutting spending and laying off workers, which exacerbates economic downturns. Healthy reserves could make such cuts unnecessary. (…)
Moody’s Analytics estimates 39 states have the reserves necessary to offset all the revenue expected to be lost in a relatively mild recession. Four more are within striking distance.
City and county governments have also been able to pad their reserves thanks to recovery and stimulus programs. Comprehensive data on local government finance isn’t available yet, but New York City boosted its reserve funds to $8.3 billion in fiscal year 2023, or 11.1% of revenues. Both figures are the highest ever. Los Angeles and Chicago have also directed more money to rainy-day funds.
State and local governments together make up 11% of total spending in the U.S. economy. They account for about 13% of total payrolls, more than manufacturing, construction, retail, or leisure and hospitality. (…)
A broader measure of state reserves, which includes all unspent funds, whether stored in specified rainy day funds or not, will amount to 24.7% of total spending this fiscal year, down from 31.7% in 2022, according to NASBO forecasts. By contrast, states held just 8.9% on average between 2000 and 2020. Most state fiscal years run from July 1 to June 30. (…)
State and local governments are 505k employees short vs pre-pandemic. State and local government wages rose 8.8% since 2019 but remain about 8% lower than private wages which have risen 12.3% since 2019.

SENTIMENT WATCH
Goldman Sachs remains in the no-recession camp but David Kostin sees the need for what-if scenarios:
The combination of limited upside in our base case and substantial downside risk if the economy dips into recession makes for a challenging distribution of outcomes for US equity investors, especially relative to the alternatives. If resilient economic activity data catch down to the more negative recent survey data and investors assign increased likelihood to a hard landing scenario, US equities would face meaningful downside.
We estimate the S&P 500 would fall to 3150 in a recession scenario, driven by a combination of falling earnings estimates and a much lower P/E multiple (14x vs. 18x today). This would represent a nearly 25% decline from the current level.
Beyond recession, another downside risk is that inflation continues to slow, but fails to approach the Fed’s target. This dynamic could lead to even tighter monetary policy and higher interest rates. Finally, as we discussed last week, the debt ceiling represents a potential risk to US equities later this year. While the reaction to debt limit “close calls” has been mixed, the 2011 experience witnessed a sharp 17% drawdown in US stocks.
FOMC/Powell
National Bank Financial produced the best summary of last week’s FOMC/Powell event: A gentle hike with an end in sight


 Constant Currency (The Information)


 US accuses China of flying spy balloon over sensitive military sites