Latest ‘flash’ PMI™ data from S&P Global signalled a strong, but slower increase in business activity across the US economy in April. Although still faster than January’s Omicron-induced slowdown, overall growth was dampened by a softer rise in service sector output following pressure on customer spending as prices continued to increase markedly. Manufacturers, on the other hand, indicated a stronger expansion in production on the back of rising demand.
The headline Flash US PMI Composite Output Index registered 55.1 in April, down from 57.7 in March. The latest data indicated a strong rise in private sector output, but one that was subdued by the impact of inflation on customer spending. Although service providers recorded a softer upturn in activity, manufacturing firms noted the quickest uptick in production since last July.

| Private sector businesses signalled a sharp increase in new orders at the start of the second quarter, though the rate of expansion in new business eased from March’s nine-month high. Service providers recorded the softest rise in new sales for three months as a series-record increase in selling prices dampened customer demand. Goods producers, however, indicated a marked upturn in new work that was the fastest for seven months. Nonetheless, new export orders expanded sharply and at the steepest pace since the series began in September 2014. New business from abroad was reportedly boosted by stronger foreign client demand as key export markets continued to reopen. |
April data indicated a series-record rise in input costs across the private sector as raw materials, fuel, transportation and wage bills ticked higher. Service sector firms registered the fastest rise in cost burdens since October 2009, when data collection began, while goods producers recorded the sharpest uptick in expenses since November 2021’s record rise.
In an effort to pass through higher cost burdens to clients, businesses signalled the steepest rise in output charges on record. Manufacturers and service providers alike reported series-record increases amid soaring input prices. Some companies also stated that surcharges were added to selling prices to account for more frequent upticks in operating expenses.
Employment across the private sector continued to increase strongly in April, albeit at a slightly softer pace than in March. The rate of job creation was the second-fastest since May 2021, as manufacturers registered a sharper rise in workforce numbers. Companies noted that greater staffing numbers were linked to increased business requirements, however, some stated that hiring remained a challenge.
Difficulties retaining and acquiring new staff were often linked to a further rise in backlogs of work. The rate of growth in outstanding business eased from March’s record high, but was still the second-sharpest since data collection began in October 2009. Material shortages also hampered firms’ ability to clear work outstanding, with suppliers’ delivery times lengthening in April at an increased rate.
Firms also indicated a dip in business confidence at the start of the second quarter. Although remaining optimistic of a rise in output over the coming year, the level of positive sentiment slipped to a six-month low. Softer expectations were broad-based, as firms highlighted concerns regarding spiralling costs and evidence of less robust demand conditions, due in part to higher selling prices.
At 54.7 in April, down from 58.0 in March, the S&P Global Flash US Services Business Activity Index indicated a solid rise in service sector output at the start of the second quarter of 2022. That said, the rate of activity growth eased to the slowest since January’s Omicron-induced knock to demand.
Demand conditions remained buoyant, however, as new orders rose sharply. The uptick in new sales was linked to the loosening of COVID-19 restrictions, especially for client-facing businesses. That said, the pace of expansion in new business also eased to a three-month low amid reports of labor and supply shortages and inflation dampening customer willingness to spend. The easing of travel restrictions allowed new export orders to tick higher again, as the rate of growth reached the fastest since data collection began in September 2014.
Meanwhile, cost burdens continued to soar, as the rate of input price inflation accelerated in the service sector to a series-record pace. Higher wage and input bills stoked the increase in costs. In response, service providers hiked their selling prices at the steepest rate on record in an effort to pass-through greater cost burdens.
Employment rose strongly as firms sought to boost workforce numbers and clear backlogs of work amid greater business requirements. The rise in outstanding business was the second-fastest on record, as some services companies continued to highlight challenges fulfilling hiring requirements.
Concerns regarding inflation and its impact on customer demand weighed on business confidence in April, which dipped in the service sector to the lowest level since October 2021. Nonetheless, services firms were broadly optimistic of a rise in output over the coming year.
The S&P Global Flash US Manufacturing PMI posted 59.7 in April, up from 58.8 in March, to signal a marked improvement in operating conditions across the manufacturing sector. Overall growth was the strongest for seven months.
Contributing to the overall upturn were faster rises in output and new orders during April. Despite another marked deterioration in vendor performance, firms were able to increase production amid stronger client demand and the acquisition of new customers. Total new sales growth was supported by a steep increase in foreign client demand, as new export orders rose at the fastest pace in almost a year.
Inflationary pressures remained marked across the goods-producing sector in April. The rate of increase in costs quickened again to the sharpest since last November’s series record amid reports of hikes in fuel, material and transportation prices. Frequent increases in costs resulted in the sharpest rise in output charges on record as firms sought to pass-through greater input prices to clients.
Although firms stepped up their input buying and efforts to build safety stocks, backlogs of work rose steeply. Manufacturers also expanded their workforce numbers, and at the quickest pace since July 2021. Nonetheless, many firms noted that hiring needed to increase further to satisfy incoming new work.
Finally, output expectations remained positive in April, with factories anticipating greater output over the next year due to hopes of supply chain stability and greater capacity. That said, the degree of confidence in the manufacturing sector slipped to a six-month low following greater geopolitical uncertainty and inflation concerns.
Inflation does not seem about to ease in April as manufacturers and service providers alike keep translating their “series-record rise in input costs” into the “steepest rise in output charges on record”, even with “surcharges to account for more frequent upticks in operating expenses”.
More from IHS Markit:
Inflation is already running at multi-decade highs in the US, eurozone and UK, and with the PMI survey data signalling a further surge in companies’ costs in April, such elevated inflation readings look likely to persist in coming months. Average input costs across manufacturing and services rose at a record rate in both the US and Japan in April, with near-record rates seen in the eurozone and UK.

These higher costs fed through to another surge in prices charged to customers. New record rates of increase for average prices levied for goods and services were reported in the US and eurozone, with a near-record high also reported in the UK (where an easing in the rate of increase was often linked to customers kicking back on price hikes). Japan likewise saw rate of selling price inflation accelerate, reaching the highest since the consumption tax hike of April 2014.

However, I note, for the first time, “concerns regarding spiralling costs and evidence of less robust demand conditions, due in part to higher selling prices.”
Employment remains strong with “many firms noted that hiring needed to increase further to satisfy incoming new work.”
But maybe labor tightness is easing a little as only “some [firms]stated that hiring remained a challenge”, rather than “firms” or “most firms”.
But its getting complicated!
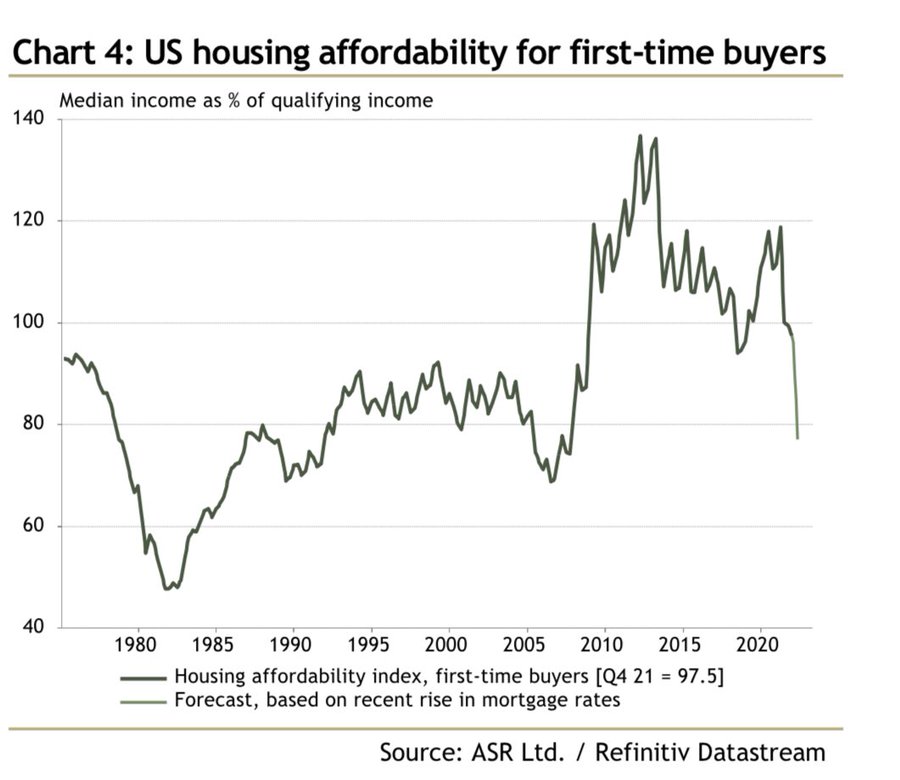
- For one, the housing sector will necessarily slow down:
Dom White
(…) There has been an unexpectedly sharp downturn in demand to truck everything from food to furniture since the beginning of March and rates in the overheated segment that deals in on-demand trucking jobs – known as the spot market – are skidding.
“It basically just dropped off a cliff,” said Fuller [chief executive of transportation data company FreightWaves], who is concerned that the United States is at the start of a trucking recession that could decimate truckers’ ability to dictate prices and push some small trucking firms into bankruptcy. (…)

And now, trucking’s most demand-sensitive sector – the spot market – is in correction territory. (…)
But demand tumbled in March, when retail sales excluding purchases of gasoline fell 0.3%. Online sales, which surged during the pandemic, declined for the second month in a row. (…) How’s April?
- On April 17, the Chase consumer card spending tracker was 0.9% below its pre-COVID trend. Not inflation adjusted!


Next thing we’ll learn is that demand at the end of the pipe is balking at higher prices, rising costs are getting more difficult to pass on and business inventories may be too high…
It’s difficult to think that the red line below can keep rising given what the blue line is doing:

Asda, Britain’s third largest grocer after market leader Tesco (TSCO.L) and Sainsbury’s (SBRY.L), said it would invest over 73 million pounds ($93 million) to cut the prices of over 100 items, including fruit and vegetables, meat and rice, and has “locked in” those prices until the end of 2022.
The group, owned since February last year by brothers Mohsin and Zuber Issa and private equity company TDR Capital, said that on average, prices for the 100 items will drop by 12%.
Meanwhile Morrisons, the fourth biggest player, said it was lowering prices on more than 500 essential products, which together cover 6% of its total volume sales. (…)
It’s been a long time since the last price war.
Moreover, the net share of panelists reporting an increase in materials costs rose to the highest since the question was first asked in 1984. In the next three months, some 71% anticipate costs to keep climbing. The survey of 84 NABE members was conducted April 4-12.
The majority of businesses are successfully passing along higher costs to consumers. Some 45% of respondents reported passing on some of those cost increases to consumers, while 15% reported passing along all or nearly all of them. Looking ahead, about half of respondents expect their firms to raise prices in the next three months while nearly all the rest anticipate prices to remain unchanged.
Panelists largely anticipate sales at their firms to remain strong over the next three months, and nearly half of them saw the odds of recession in the coming year at 25% or less. Some 13% put the probability at more than 50%.
Overall, panelists said shortages are improving, with nearly a third of respondents indicating their firms are having no shortages. About half of firms are still reporting shortages of skilled labor, but the share of firms reporting skilled and unskilled labor shortages declined from the January survey.
Traders around the world watch the yen’s rise and fall not just to follow Japanese markets but also to gauge how investors globally are feeling. Usually, when markets are rallying, the yen tends to weaken against other currencies. When markets get turbulent, the yen tends to gain ground.
That dynamic has been upended this spring. (…)
If the yen were a smaller currency, its slide might have less importance to financial markets. But the yen is key to global finance, ranking as the third-most-traded currency in the world.
The Federal Reserve is poised to begin winding down its extensive bond-buying program as early as next month. The central bank is counting on investors like Japanese institutions—the biggest foreign buyers of U.S. Treasurys—to step in and help absorb the increased supply of Treasurys on the market.
But the yen’s rout might cut into Japanese demand for Treasurys. That is because as the yen weakens, Japanese investors with dollar-denominated assets will have to pay more to hedge against the risk of currency fluctuations cutting into their returns.
In theory, relatively generous U.S. yields should make Treasurys still attractive to Japanese investors. The 10-year U.S. Treasury has a yield of 2.905%; the 10-year Japanese government bond has a comparatively paltry yield of 0.25%.
But hedging has gotten so expensive that the extra yield a Japanese investor would get from holding Treasurys instead of Japanese government bonds has almost disappeared. After factoring in the cost of taking out currency protection, the difference between the 10-year Treasury yield and the 10-year Japanese government bond yield is just 0.2 percentage point, a Goldman Sachs Group Inc. analysis using 12-month rolling hedges found. (…)
Traders betting on sustained yen weakness were burned by rapid and violent unwinds of that bet during the Asian financial crisis in 1998, as well as the great financial crisis in 2008.
Data shows Japanese investors have been trimming their foreign bondholdings. They have been net sellers of foreign bonds in all but one month since November, according to Japan’s Ministry of Finance, selling a net 2.36 trillion yen ($18.4 billion) in overseas bonds last month. (…)
Hedge funds are still betting heavily on the yen falling further, with net positions against the yen recently hitting their highest in more than three years, according to recent data from the Commodity Futures Trading Commission. (…)
How low is low?

How high is high?

(…) Ticket prices increased 11% in 2021 relative to 2019, and 14% in North America, according to Live Nation Entertainment Inc., the world’s largest concert promoter. And demand remains strong, the company says, with concert ticket sales up 45% through mid-February compared with 2019. (…) They are also able to adjust prices dynamically based on demand. (…)
Meanwhile, on-site spending for merchandise, food and beverage is up more than 10%, Live Nation says. (…)
China Wants to Reopen Factories After Covid-19 Lockdowns. It Isn’t That Easy. Manufacturers face component shortages and logistics woes as Beijing tries to kick-start the economy.
(…) The number of positive cases in the provinces around Shanghai have been rising in the past two weeks. Jiangsu province, a major manufacturing hub, recently reported the most new Covid cases after Shanghai and the Northern province of Jilin.
On Tuesday, Tesla display supplier AU Optronics Corp. forecast the supply-chain impact to last for another three months, even if the lockdowns end soon. The Taiwanese electronics maker has suspended production at its factories in Kunshan, a city in Jiangsu near Shanghai’s east coast, since April 8. (…)
More than 160 companies listed in Taiwan with operations in Shanghai and Kunshan have had to freeze production, according to Taiwan’s finance regulator last week. Several were suppliers to Tesla and Apple. (…)
Honda Motor Co. said it had to trim some production in Japan owing to a shortage of parts from China. The auto maker said Thursday that one of its major plants in Japan is operating at half-capacity this month and into the first part of May. (…)
- Shanghai Covid Cases Bounce Back as Strict Lockdown Persists There were 23,370 new local infections reported in the financial hub Friday, compared with 17,629 cases the day before, the Shanghai Health Commission said Saturday morning. (…) Meanwhile, Beijing’s municipal government said late Friday that 14 people had tested positive for Covid-19. The Chinese capital ordered a school shut as officials race to stop the virus spreading, calling the situation “urgent and serious.”
EARNINGS WATCH
From Refinitiv/IBES:
Through Apr. 22, 99 companies in the S&P 500 Index have reported earnings for Q4 2021. Of these companies, 77.8% reported earnings above analyst expectations and 20.2% reported earnings below analyst expectations. In a typical quarter (since 1994), 66% of companies beat estimates and 20% miss estimates. Over the past four quarters, 83% of companies beat the estimates and 13% missed estimates.
In aggregate, companies are reporting earnings that are 7.7% above estimates, which compares to a long-term (since 1994) average surprise factor of 4.1% and the average surprise factor over the prior four quarters of 13.3%.
Of these companies, 69.7% reported revenue above analyst expectations and 30.3% reported revenue below analyst expectations. In a typical quarter (since 2002), 62% of companies beat estimates and 38% miss estimates. Over the past four quarters, 80% of companies beat the estimates and 20% missed estimates.
In aggregate, companies are reporting revenues that are 1.4% above estimates, which compares to a long-term (since 2002) average surprise factor of 1.2% and the average surprise factor over the prior four quarters of 3.7%.
The estimated earnings growth rate for the S&P 500 for 22Q1 is 7.3% [vs 6.4% on Apr. 1]. If the energy sector is excluded, the growth rate declines to 1.6%. The estimated revenue growth rate for the S&P 500 for 22Q1 is 11.4%. If the energy sector is excluded, the growth rate declines to 8.7%.
The estimated earnings growth rate for the S&P 500 for 22Q2 is 6.6% [6.8%]. If the energy sector is excluded, the growth rate declines to 1.0%.
Trailing EPS are now $212.24. Full year 2022e: $227.80. Forward 12ms: $234.04e.


Net earnings revisions so far in April are up only 1.9%, down from 5.1% in February and 3.9% in March, and the slowest NERI since March 2020.
Revisions are negative in Communication Services (-11.9%), In Consumer Discretionary (-2.8%), Staples (-5.1%), Health Care (-0.9%), Industrials (-0.8%), Materials (-1.2%) and Utilities (-0.1%).
They are positive in the 4 other sectors, including IT (+6.9%), Financials (+4.6%) and Energy (+32.8%).
VALUATIONS WATCH
As of Friday’s close, 337 S&P 500 stocks (67%) were down 10% or more from their 52-week high and 212 (42%) were down 20% or more including 104 (21%) down 30% or more.
While this was happening, the S&P 500 index rose 2.1% since last April while trailing EPS increased 38% to reach a level 29% above its pre-pandemic level.
As a result, the S&P 500 trailing P/E dropped from 27.8 at the end of March 2021 to its current 20.1. The median is 21.2.
Good value?
Merely “better” value, though it’s just back to the high end of its 20-15 long-term range:
On forward EPS, it declined from 22.6 to 18.2 (media: 19.2), also at the high end of its normal range. Keep in mind that the chart on forward earnings uses actual forward earnings up to the current reading which uses expected forward earnings of $234.

The problem with conventional measures of P/E ratios remains the same: inflation. The period when trailing P/Es sank below 15 is the period when inflation got out of control and stayed above 6% between 1974 and 1982.
When we add core inflation to trailing P/Es, we get a very consistent 15-25 range allowing us to objectively measure valuation risk around the 20 median Rule of 20 P/E. At its current 26.5 level, the R20 P/E remains well above its historical range:

At current trailing EPS, we need inflation of 5.0% to get the R20 P/E at its 25.0 normal high.
It has been argued that given the recent regime of very low interest rates, it is more appropriate to use 10Y Treasury yields rather than core inflation. By that measure, the R20 P/E would be 23.0 at the current 10Y yield of 2.9%, up from 1.5% last December.

Nominal interest rates remain historically very low but real rates are very abnormally low, just when most central banks are loosening their grip on interest rates to seriously fight inflation.

One needs to place a lot of faith on an FOMC that has totally misread inflation so far and is now focused on taming demand when most of the pressures come from the supply side. Rising interest rates do little to increase supply. Meanwhile, the war in Ukraine, the sanctions against Russia and China’s Omicron problems are further constraining supplies of most goods, including energy and foodstuffs.
Meanwhile, the labor situation is not improving at all. Mr. Powell last Thursday: “It’s too hot. It’s unsustainably hot. It’s our job to get it to a better place where supply and demand are closer together.”
Goldman Sachs illustrates the challenge with this Jobs-Worker Gap chart showing the tightest job market in post-war history:

Extrapolated before December 2000 using the newspaper help-wanted index based on methodology by Regis Barnichon, San Francisco Fed.
Source: Haver Analytics, Goldman Sachs Global Investment Research
We reach three conclusions. First, labor market tightening is broad-based across G10 economies, but more pronounced in the English-speaking countries. Second, labor force weakness drives most of the labor market overheating. Third, although the labor force should partly normalize further in a post-pandemic environment, the English-speaking G10 central banks will likely need to reduce labor demand enough to reduce the gap, and ensure that wage growth settles at a sustainable pace consistent with inflation targets. By the end of the year, our baseline expectation is that the policy rate rises by an additional 200bp in the US (to 2½-2¼%) and Canada (3%), 150bp in New Zealand (3%), 100bp in the UK (1.75%), and 90bp in Australia (1.0%). Our finding of significant labor market tightness and wage pressures points to upside risk to these forecasts.
And how have CBs reduced labor demand in the past? Only with a recession.

Goldman’s David Mericle searched for a Fed miracle:
We recently introduced an analytical framework for thinking about whether the Fed can restore balance to the labor market and tame inflation without a recession. Our approach to answering this question proceeds in a series of four steps.
First, we ask how much wage growth needs to slow to be compatible with the Fed’s projection that inflation will gradually fall toward the 2% target.
Second, we ask how much the jobs-workers gap needs to shrink to achieve that slowdown in wage growth.
Third, we estimate how far the elevated level of job openings would have to fall for reduced labor demand coupled with an assumed 1-1.5 million worker recovery in labor supply to shrink the jobs-workers gap sufficiently.
Finally, we ask how much GDP growth would need to slow to reduce job openings by that amount, based on the statistical relationship between the two.
Our conclusion is that we do not need a recession but probably do need growth to slow to a somewhat below-potential pace of about 1-1.5% for a year, a path that would raise recession risk above normal levels.
Joseph Briggs, also a Goldman economist, assessed the additional GDP deceleration “needed to reduce labor demand enough to slow wage growth to an acceptable pace?”
Our analysis suggests that this could be achieved by slowing GDP growth by another 75bp to 1-1.5% for a year, in combination with an increase in labor supply. Our rules of thumb imply that this would require an incremental 75bp of tightening in our financial conditions index, which in turn would require another 75bp of unpriced rate hikes.
Our analysis has two key implications. First, the low growth path required to calm the hot labor market raises the risk of a hard landing. Second, the additional tightening of financial conditions likely required to achieve that suggests upside risk to our terminal funds rate forecast of 3-3¼%, especially in light of the limited traction that the Fed’s hawkish pivot has had so far.
Since this blog focuses on odds, I looked at how many times since 1947 annual GDP slowed below 1.5% without a recession or resulting in a recession. Only once, in 2011 (the red line below is at 1.25% YoY growth).

The FOMC knows these odds: “I don’t think you’ll hear anyone at the Fed say that that’s straightforward or easy. It’s going to be very challenging,” Mr. Powell said.
Also, in prerecorded remarks (i.e. well thought out) at a separate conference on Thursday morning, Mr. Powell told us of his resolve to succeed :
Chair Volcker understood that expectations for inflation play a significant role in its persistence. He therefore had to fight on two fronts: slaying, as he called it, the ‘inflationary dragon’ and dismantling the public’s belief that elevated inflation was an unfortunate, but immutable, fact of life.
He had to stay the course.
This is when the market tanked.
BTW, if you skipped the flash PMI above, you missed a lot of hints that Mericle’s miracle is not about to appear before us just yet.
TECHNICALS WATCH
Testing this generally useful chart again:
In the proper order of speculation and overvaluation:
-
The Spac ETF (DSPC) is down 67% from its June 2021 high with a 40% slide this year.
-
The ARKK fund is down 67% from its 2021 high with a 44% slide this year.
-
The Renaissance IPO ETF is down 52% from its 2021 high with a 37% slide this year
-
The NYFANG is down 32%from its 2021 high with a 44% slide this year
-
The NDX is down 20.2%, also in bear market territory, like the Russell 2000 (-21%).
-
The S&P 600, all profitable small caps, is down 15% since its November 2021 high.
-
The S&P 500 is down 11.3% since its January high. Its moving averages are not encouraging…
Just about everything is in a bear market with investors clinging to the higher quality and liquidity. For how long?
Here’s the lay of the valuation land, courtesy of Ed Yardeni (my red lines):

(…) “With defensive stocks now expensive and offering little absolute upside, the S&P 500 appears ready to join the ongoing bear market,” said Morgan Stanley strategists in a note on Monday. “The market has been so picked over at this point, it’s not clear where the next rotation lies. In our experience, when that happens, it usually means the overall index is about to fall sharply with almost all stocks falling in unison.” (…)
(…) Despite the drawdown, investors haven’t fled ARKK. Instead, they have funneled more than $658 million into the fund this year, according to FactSet data through Thursday, including about $59 million in the latest week. That is even as investors yanked $2.3 billion year-to-date from the Invesco QQQ Trust, a prominent ETF tracking the Nasdaq-100 index, which is heavily invested in technology stocks. (…)
Investment research company Morningstar downgraded its rating of ARKK last month to negative. In a report entitled “Invest at your own risk,” strategist Robby Greengold wrote that Ms. Wood had increased the fund’s risk by reducing the number of stocks it holds to 35 from 60 about a year ago. The strategy has become more vulnerable to severe losses, he wrote.
Brett Winton, director of research at ARK Investment Management, said the firm tends to concentrate its portfolio during risk-off periods in the stocks in which it has the greatest confidence. (…)
ARKK is down 21% so far in April!
- Wall Street Finds New Value in Cash Worries about the war in Ukraine, China’s Covid-19 outbreak, a U.S. or European recession and surging global inflation are making cash an increasingly popular asset with Wall Street’s top money managers.
(…) Rick Rieder, managing director at BlackRock Inc., said the world’s largest asset manager is increasing cash holdings by more than 50% in many portfolios to a weighting that is “much, much higher” than it had been in years past. (…)
“For now, one of the most attractive things you can do is have patience, and if you can get paid to have patience that’s a pretty good place to be,” Mr. Rieder said. (…)
These developments are testing the long-held market view that there is no alternative to U.S. stocks, which is often referred to using the acronym “TINA.” The lack of alternatives was “one of the biggest bull mantras for the equity market,” said Ohsung Kwon, U.S. equity strategist at Bank of America. (…)
Bank of America is expecting the Federal Reserve to raise U.S. interest rates to 3% by early next year from their current level of 0.25% to 0.50%. That would produce a similar rate for cash-like assets such as money-market funds, which track short-dated Treasurys, high-quality investment-grade bonds and commercial paper. That rate would be more than double the current 1.4% dividend yield of the S&P 500. (…)
Bank of America’s April survey of global asset managers showed cash holdings are near the highest level since April 2020, which was the aftermath of the Covid-driven market selloff, and cash is one of the survey’s most popular trades. (…)
Meanwhile:
‘Mr. Lithium’ Warns There’s Not Enough Battery Metal to Go Around A mining company consultant with decades of experience doubts the industry will be able to support all the electric car production planned.
(…) The cost of the metal — mainly used to produce lithium-ion batteries, but also for pharmaceuticals and industrial lubricants — has been soaring. An index of key prices more than doubled in the first quarter, after surging 280% last year, according to Benchmark Mineral Intelligence. (…)
You can build a battery factory in two years, but it takes up to a decade to bring on a lithium project.
It’s not a commodity; it’s a specialty chemical. Lithium is often compared with iron ore or other major commodities, and it behaves nothing like that. The auto industry is just finally figuring that out. Lithium qualification for an auto company can take over a year. (…)
The additional production this year will be less than 150,000 tons. So then, it’s who gets the material? Whose EV models don’t get made?
In a 2050 scenario, there’s time for everything to happen that needs to happen. But in 2030, it just isn’t going to happen. Just look at the mess we’re in from a lithium supply standpoint with less than 10% EV penetration. (…)


 Funny note here: could it be that some of the demand Whirlpool is seeing is actually demand for semis as per ASML’s CEO’s anecdote above?

We’ve looked at this survey many times over the years, concluding that the managers can be a slight contrary indicator at extremes, but it’s not a decisive edge. While some of the market’s better long-term returns came after depressed sentiment, the S&P 500 performed better when managers were bullish and worse when they were bearish. (…)
Investors always seem to have a knee-jerk contrarian response to any survey of other investors. Maybe it’s an inherent need to feel superior to others, even though the vast majority are trend-followers when actually putting money to work. People want to feel superior, but they need to be comforted by a crowd. When it comes to the kinds of large money managers surveyed by Barron’s, there is compelling evidence that we should avoid this tendency in ourselves and not take their current pessimism as a sign that we should feel more optimistic. Quite the opposite, in fact. If those with influence over such large piles of money do not feel inclined to buy the dip, then stocks tend to struggle much more than when those people are feeling better about things. Add this to the pile of recent headwinds.


