Fed’s Powell Seals Expectations of Half-Point Rate Increase in May Jerome Powell also indicated similar rate rises could follow.
(…) “It is appropriate in my view to be moving a little more quickly” than the Fed has in the recent past, Mr. Powell said Thursday. “I also think there’s something in the idea of front-end loading” those moves. (…)
Fed officials including governor Lael Brainard, who is awaiting Senate confirmation to serve as the central bank’s vice chair, have almost unanimously signaled a desire to raise rates expeditiously to a more neutral setting that no longer provides stimulus. New York Fed President John Williams said last week that a half-point rate rise in May was a “very reasonable option.” (…)
Mr. Powell warned of growing supply-and-demand imbalances in the U.S. labor market that some economists worry could fuel a wage-price spiral that drives inflation higher as workers bid up wages. (…)
“It’s too hot. It’s unsustainably hot,” Mr. Powell said. “It’s our job to get it to a better place where supply and demand are closer together.” (…)
“Economies don’t work without price stability,” he said.
The Fed is trying to engineer a so-called soft landing in which it slows growth enough to bring down inflation, but not so aggressively that the economy slips into a recession. “I don’t think you’ll hear anyone at the Fed say that that’s straightforward or easy. It’s going to be very challenging,” Mr. Powell said.
In prerecorded remarks at a separate conference on Thursday morning, Mr. Powell extolled the example of former Fed Chairman Paul Volcker, who raised interest rates aggressively in the early 1980s to stamp out inflation.
“Chair Volcker understood that expectations for inflation play a significant role in its persistence,” said Mr. Powell. “He therefore had to fight on two fronts: slaying, as he called it, the ‘inflationary dragon’ and dismantling the public’s belief that elevated inflation was an unfortunate, but immutable, fact of life.”
“He had to stay the course,” Mr. Powell said.
- Bank of Canada’s Tiff Macklem won’t rule out even larger interest rate hikes
The Bank of Canada might consider hiking its benchmark interest rate by more than 50 basis points in a single move as it pushes borrowing costs higher to try to quell runaway inflation, Governor Tiff Macklem suggested on Thursday.
“I’m not going to rule anything out,” Mr. Macklem told reporters when asked whether the central bank would ever raise rates by more than half a percentage point in a single rate decision.
“We need to normalize monetary policy reasonably quickly, and we’re prepared to be as forceful as needed,” he said from Washington, where he is attending the spring meetings of the International Monetary Fund (IMF) and World Bank. (…)
“If we don’t keep inflation expectations well anchored, if we let them become unmoored, then inflation will just get stuck at a new higher spot, and we really will have to slow down the economy a lot to get inflation back to target. That will be much more painful,” he said. (…)
The challenge for the Bank of Canada and other central banks is to normalize borrowing costs without pushing their economies into a recession. Mr. Macklem said the Canadian economy is in relatively good shape. But he acknowledged that he will be walking a tightrope.
“I won’t pretend that this isn’t delicate,” he said.
ECB: Recent Comments Flag Possibility of July Hike
A number of Governing Council members have in recent days noted the possibility of a July hike given persistently elevated inflation pressures. President Lagarde, however, provided little news in her comments at the IMF, highlighting that the ECB’s normalisation path will depend on the incoming data. We maintain our baseline forecast for an end of APP in July and the first hike in September as evidence on second-round effects remains ambiguous. That said, we see risks skewed towards a hike in July which would signal more urgency to act and could imply a faster pace of tightening in light of the recent commentary and continued high inflation. (Goldman Sachs)
A 17-year extreme in investment-grade bond selling
One of the most challenging aspects of the last several months is the inability of investors to lift markets after pessimistic extremes. Nowhere is that more evident than in the bond market, where we’re seeing activity that two generations of investors don’t know how to handle. Bonds are simply not responding how they have in at least 30 years. It has many hallmarks of forced selling pressure, and trying to guess when that might end is a fool’s errand without some inside information.
Based purely on the level of selling pressure in corporate (and Treasury) bonds, it now appears to be an excellent risk/reward setup for buyers. The trouble is that that was the case two months ago, too, and yet here we are. With activity like this, buys are typically best left for people who dollar-cost average or wait for the selling pressure to end and the market to recover to a more healthy environment. There is no sign of that yet.
The biggest story in markets is the complete and utter devastation in the bond market. A market like this, a primary source of leverage, doesn’t make moves like this without wiping out some major players. It just hasn’t been reported yet.
The selling in investment-grade bonds is particularly severe. While often assumed to be one of the safest parts of the bond market, it has been anything but. Over the past 50 sessions, only about 40% of bonds have increased in price on an average day. We’ve never seen anything like this in at least 17 years.
Since February, there have been seven days, including Tuesday, when more than 60% of bonds traded at a 52-week low. This is an astounding figure beyond anything the current generation of investors has seen. It’s worse than the financial crisis, worse than the taper tantrum, and worse than the pandemic.
Selling has been prevalent in the high-yield corporate bond market, too. We saw that as early as February when many breadth metrics were hitting multi-year or multi-decade extremes.
Even though those bonds continued to sell off into March and are struggling to hold their lows, they’re still outperforming investment-grade bonds. This is curious because investors tend to dump junk bonds and head into investment-grade ones as a relatively safe haven when they panic.
We’re seeing the opposite of that, with an all-time low in the ratio between the Bloomberg Barclays total return on investment-grade and high-yield bonds. The ratio has just dropped more than 5% below its one-year average.


The truth is that most investors have never experienced inflation, a very hawkish Fed and sharply rising interest rates. They have no clue of the ramifications…
Last January 28, my Daily Edge post started with a Greg Ip piece in the WSJ (Prepare for an Unsettling Monetary Tightening Cycle Unlike in previous cycles, inflation is too high and the Fed isn’t holding the market’s hand) and ended with Steve Blumenthal’s Fixed Income Trade Signals that were all flashing red.
Today’s Daily Edge begins with the confirmation of a very hawkish Fed. Here are yesterday’s Fixed Income Trade Signals, still bloody bearish:

Nordea:
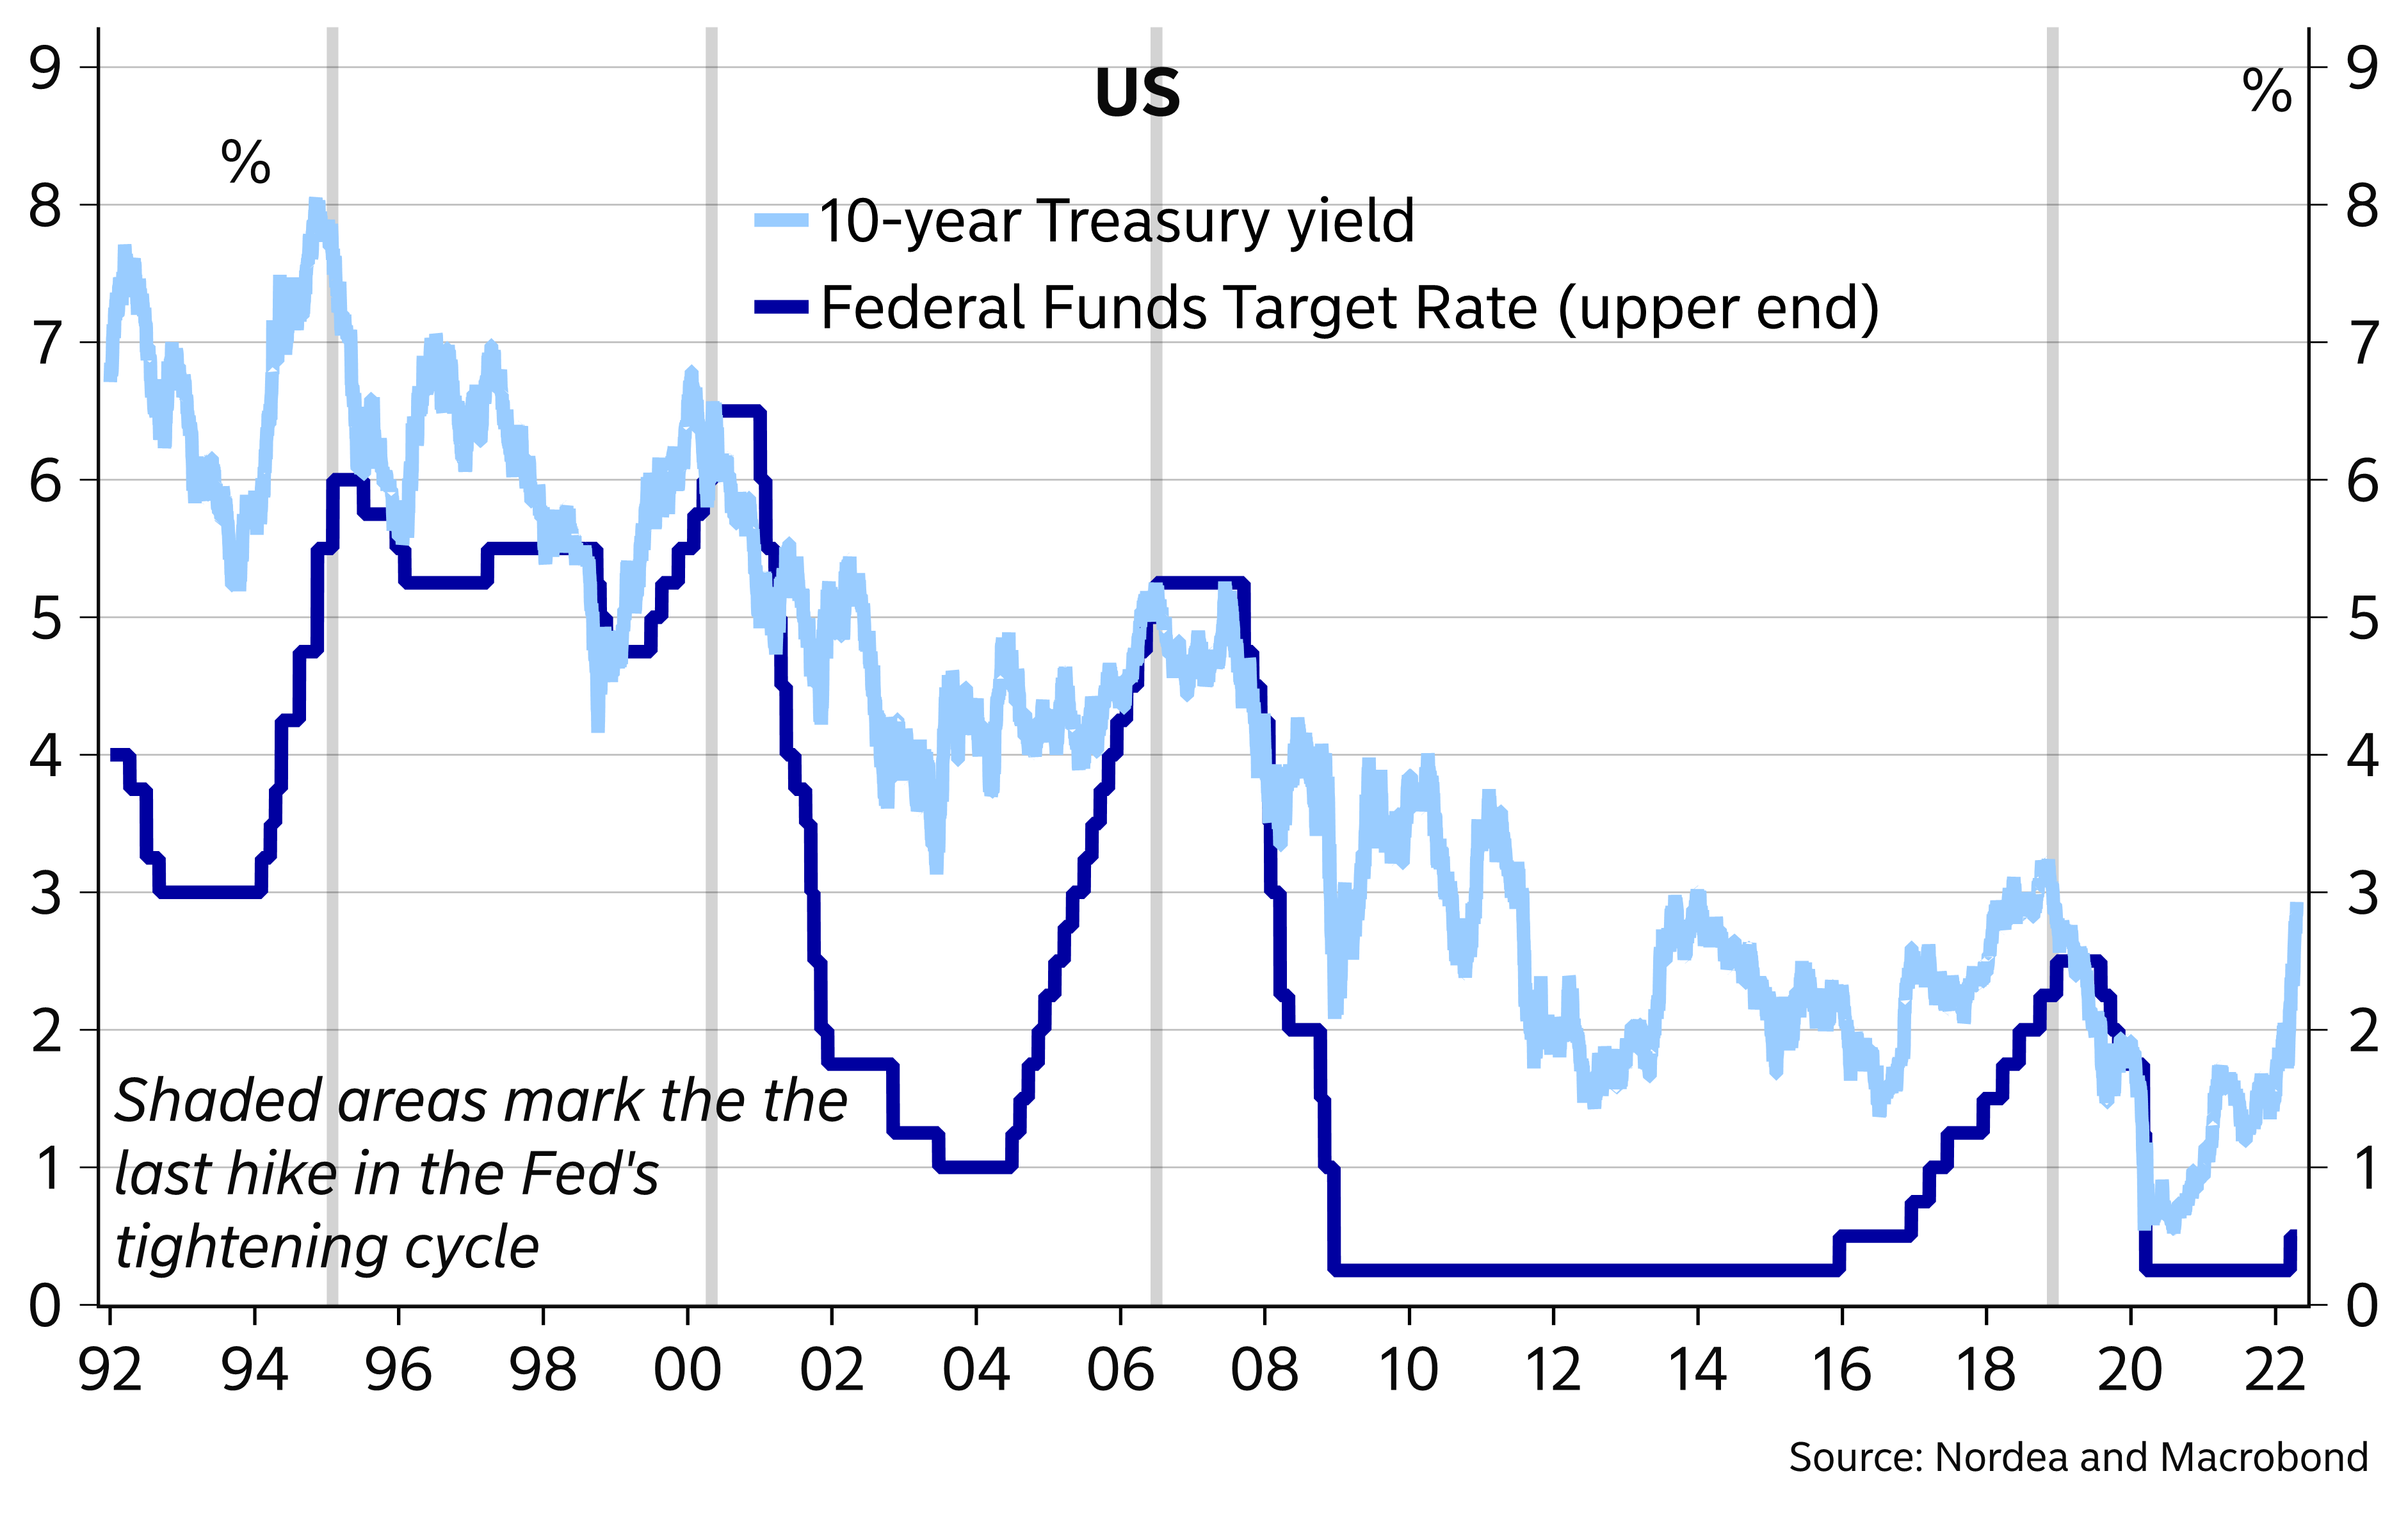
Long yields usually peak around the time of the last Fed hike in the cycle
Steve Blumenthal adds this for equity investors:
Watch Out For Minus 2
There is an immediate need for caution. Don’t Fight the Tape and the Fed indicator is at a -2 reading. What this is saying is that both the direction (trend) of the market (as measured by NDR’s Big Mo indicator) and the Fed (the trend in interest rates) are signaling negative readings. See the historical returns in the -2 grey-shaded boxes for the periods indicated. Historically, the bad stuff happens when the reading of this indicator reaches -2. Could it be different this time? Sure.

U.S. Initial Unemployment Claims Ease, Hover Slightly Above Record Low
Initial claims for unemployment insurance filed in the week ended April 16 eased by 2,000 to 184,000 (-67.5% y/y) from 186,000 filed the week before; that was revised modestly from 185,000 reported initially. The Action Economics Forecast Survey expected 178,000 claims for the latest week. The 4-week moving average of initial claims increased to 177,250 from 172,750 in the prior week.
In the week ended April 9, continued weeks claimed for unemployment insurance decreased 58,000 to 1.417 million, the smallest amount since February 21, 1970. The April 2 week’s amount was unrevised at 1,475 million. The insured unemployment rate wet a new record low of 1.0%, down from the previous record low of 1.1%, which had held for the previous four weeks.
In the week ended April 2, the number of continued weeks claimed in all unemployment insurance programs continued to fall, declining to 1.622 million from 1.710 million in the prior week. This total includes federal employees, newly discharged veterans, extended benefits and other specialized programs. (…)
FLASH PMIs
The seasonally adjusted S&P Global Eurozone PMI® Composite Output Index rose from 54.9 in March to 55.8 in April, according to the preliminary ‘flash’ reading, signalling the strongest rate of expansion since last September. New order growth likewise accelerated, despite a second successive monthly drop in exports of goods and services, pointing to reviving demand conditions across the eurozone.
Growth trends varied markedly by sector. Business activity among service providers rose at the fastest rate since last August amid falling COVID-19 case numbers and an associated relaxation of health restrictions. April has seen virus containment measures relaxed across the eurozone to the loosest since the start of the pandemic, according to S&P Global’s COVID-19 Containment Index. Inflows of new business in the service sector also picked up to the fastest since last August, buoyed by rising demand. The upturn was led by a boom in tourism & recreation activity, which reported an unprecedented surge in business activity.
In contrast, manufacturing output growth came close to stalling in April, registering the smallest monthly expansion since the initial pandemic downturn during the second quarter of 2020. The autos sector was particularly hard hit, recording a steepening and marked loss of output, though all other major manufacturing sectors barring tech equipment reported either slower growth, stagnation or outright falls in output.
Many companies suffered production curbs due to ongoing supply constraints, with April seeing further widespread reporting of longer supplier delivery times. Disruptions emanating from the Ukraine war and fresh lockdowns in China exacerbated existing supply issues.
However, demand was also reported to have cooled in the manufacturing sector. New orders for goods rose at the weakest rate since June 2020, registering only a modest increase. Lost orders were blamed on soaring prices, the cost of living squeeze and signs of increased risk aversion due to the Russia-Ukraine war, as well as the shift of spending to service sector activities.
Output trends also differed considerably across the region. Growth slowed to a three-month low in Germany as the first fall in manufacturing output since June 2020 offset an acceleration of service sector growth to the fastest since last August. However, growth picked up in France to the sharpest since January 2018 as sustained modest factory output growth was accompanied by the largest surge in services activity since the start of 2018.
Growth also accelerated across the rest of the eurozone as a whole, hitting a five-month high on the back of an improved service sector performance.
Employment rose at the sharpest rate for five months, albeit with hiring constrained in many firms by labour shortages, in turn often linked to the pandemic.
The prevalence of labour supply issues, combined with raw material shortages, meant backlogs of work continued to rise at a solid rate in April. Although the rise in manufacturing backlogs was the smallest for almost one-and-a-half years, the rise in uncompleted work in the service sector hit the highest since last July.
Supply constraints also put further upward pressure on prices. Although input cost inflation eased slightly, the rise was still the second-largest ever recorded by the survey since comparable data were first available in 1998, led by a new record high in Germany. In addition to rising raw material prices, firms widely reported upward pressure on costs from energy and wages.
Higher costs were passed on to customers resulting in the largest rise in prices charged for goods and services yet recorded by the survey, the rate of increase accelerating markedly from the prior all-time high seen in March. New record rates of inflation were seen for both goods and services.
Despite increasing inflationary pressures, supply chain disruptions and the war in Ukraine, business optimism about the year ahead improved slightly compared to March, albeit remaining considerably gloomier than at the start of the year. The brightening picture was led by the service sector, principally reflecting hopes of further growth benefits from pent up demand from the pandemic. While optimism also picked up in manufacturing, prospects in the factory sector remain far bleaker than seen over the past two years.
The eurozone has therefore started the second quarter on a stronger than anticipated footing, confounding consensus expectations of a slowdown. However, the weakness of the manufacturing sector is a major concern as it points to an economy that is not firing on all cylinders. Similarly, the ever-rising cost of living suggests that service sector growth could cool sharply once the initial rebound from the opening up of the economy fades.


- Bundesbank warns Russian gas embargo would cost Germany €180bn Central bank says sudden disruption of supplies to EU could dent economic output by 5% this year
Japan: Sharpest rise in private sector output for four months
The latest Flash PMI data showed that Japanese private sector activity improved at a sharper rate at the start of the second quarter of 2022. Services companies recorded an expansion in activity for the first time since last December, while manufacturers saw output levels rise for the second successive month. April data signalled the sharpest expansion in four months, though the pace of growth was only marginal. Moreover, growth in incoming business in the private sector stagnated amid increased headwinds.
Cost pressures were sustained and remained more acute at manufacturers, though the rate of input cost inflation at service providers accelerated to the highest since August 2008 on the month and pushed composite input cost inflation up for the third month running. Concurrently, firms passed these price rises to clients through the steepest rise in output charges for eight years.
Business confidence eased to an eight-month low amid increased headwinds as concerns over the impact the war in Ukraine and strict China lockdown measures would have on supply chains, costs and demand – especially at manufacturing firms where positive sentiment was the weakest since June 2020.
The headline au Jibun Bank Flash Japan Manufacturing Purchasing Managers’ Index™ (PMI)® posted 53.4 in April, down from 54.1 in March to signal a more moderate improvement in operating conditions. Manufacturers registered an expansion in output levels for the sixth time in seven months, while new order growth continued for a seventh month running, albeit at a softer rate. Concurrently, the rate of job creation dipped to a nine-month low amid a softer rise in backlogs. Sustained shortages of inputs contributed to a further rapid rise in costs however, while business confidence softened to the weakest since June 2020.
The au Jibun Bank Flash Japan Services Business Activity Index rose from 49.4 in March to 50.5 in April, signalling the first expansion in business conditions since last December. That said, overall new business fell for the third time in four months amid weaker domestic demand, while new export orders rose for the first time in four months and at the sharpest pace since October 2019. Service providers commented on a fresh acceleration in input prices, with the latest rise the steepest since August 2008. However, the rate of charge inflation broadly stagnated as firms looked to absorb rising cost pressures to support demand.

- Inflation in Japan Is Finally Rising, but the BOJ Will Take It Easy With Monetary Policy Central bank says with consumer demand still weak, higher interest rates could choke off economic growth
(…) On Thursday, the Japanese central bank resumed another bond-buying move aimed at keeping a lid on rates. It promised to purchase unlimited quantities of government bonds to cap the yield at 0.25%—less than one-tenth the return on the equivalent U.S. Treasury bonds. (…)
The Bank of Japan’s unusual stance has propelled the yen to its weakest level against the dollar in two decades, jumbling the calculus that underpins hundreds of billions of dollars in annual trade and investment flows between Japan and the U.S.
The weak yen is one reason prices are rising in Japan, with consumer-price inflation expected to approach the central bank’s longstanding 2% target in the next month or two. Japan is paying more in yen terms for imports such as oil and food, while global energy shortages and supply-chain bottlenecks also push prices higher. (…)
BOJ officials believe the current inflation is a one-time phenomenon driven by factors outside of Japan’s control. (…)
“Cost-push inflation caused by rising energy prices has negative effects on the Japanese economy by reducing households’ real income and companies’ earnings,” Mr. Kuroda said in Parliament on Monday. “It is appropriate to continue easy monetary policy so we can achieve the 2% inflation target in a stable and sustainable manner.”
Government numbers released Friday showed overall consumer-price inflation rose to 1.2% in March. Economists say the figure is likely to reach 2% in April or May, when the effects of price cuts last year for cellphone service taper off. (…)
In Japan, price increases are mainly triggered by companies trying to preserve profit margins amid higher costs for inputs such as fuel and raw materials. The economy remains smaller than its prepandemic level. (…)
Japan is closed to tourists because of Covid-19 restrictions, so a typical benefit of a cheap currency—luring bargain-hunting foreigners—doesn’t apply at the moment. Finance Minister Shunichi Suzuki labeled the recent moves a “bad weakening of the yen.” (…)
- British pound slumps to levels not seen since late 2020 as data reveals economic weakness Interest-rate hikes may be increasingly ineffective at supporting the currency, warns SocGen
Retail sales volumes slid 1.4% from February, the Office for National Statistics said Friday. Economists polled by The Wall Street Journal predicted a drop of 0.2%. Sales were revised to a 0.5% drop in February, higher than the 0.3% decline previously reported. (…)
Compared with a year earlier, March retail sales were up 0.9%. U.K. inflation has running at a 30-year high of around 7%.
Separately, confidence among British consumers fell a fifth straight month in April to the lowest level since the 2008-09 financial crisis, as high inflation cut into real incomes for households, according to a survey by research firm GfK. (…)
Bitcoin investors tend to have low financial literacy, according to BoC research
Based on a series of surveys, central bank researchers found that around 5 per cent of Canadians owned bitcoin between 2018 and 2020. That ownership was “concentrated among young, educated men with high household income and low financial literacy,” the researchers said in a paper summing up the survey results released this week.
The researchers found that bitcoin owners tend to have a greater knowledge of how bitcoin technology works than non-owners, but score lower on general financial knowledge questions. (…)
After reading the above, I came across that chart from The Market Ear and couldn’t avoid seeing a link…

The BoC research added:
Eighteen per cent of the current or past bitcoin owners surveyed by the bank said they had experienced a price crash, 14 per cent said they had lost access to their digital wallets, and 12 per cent said they had participated in an initial coin offering that ended up being a scam. (…)
- Crypto Thieves Get Bolder by the Heist, Stealing Record Amounts A hacker stole $182 million over the weekend, the fifth largest hack on record.
U.S. Blasts China’s Support for Russia, Vows to Help India
(…) Sherman also said the U.S. would work with India to help the country move away from its traditional reliance on Russian weapons, given the impact global sanctions are having on Russia’s arms industry.
“They understand that their military, which was built on Russian weapons, probably doesn’t have a future with Russian weapons anymore because our sanctions have pulled back the military-industrial complex of Russia — and it’s not coming back anytime soon,” she said. (…)
The administration of Prime Minister Narendra Modi, who spoke with President Joe Biden earlier this month, has told the U.S. it needs Russian weapons to secure its border with China and the alternatives are too expensive. (…)


