Advance Monthly Retail Trade Report, March 2022
Out this a.m.:
Advance estimates of U.S. retail and food services sales for March 2022, adjusted for seasonal variation and holiday and trading-day differences, but not for price changes, were $665.7 billion, an increase of 0.5 percent (±0.5 percent)* from the previous month, and 6.9 percent (±0.9 percent) above March 2021.
Total sales for the January 2022 through March 2022 period were up 12.9 percent (±0.7 percent) from the same period a year ago. The January 2022 to February 2022 percent change was revised from up 0.3 percent (±0.5 percent)* to up 0.8 percent (±0.2 percent).
Retail trade sales were up 0.4 percent (±0.4 percent)* from February 2022, and up 5.5 percent (±0.7 percent) above last year. Gasoline stations were up 37.0 percent (±1.8 percent) from March 2021, while food services and drinking places were up 19.4 percent (±4.6 percent) from last year.

Supplier Prices Rose Sharply in March, Keeping Upward Pressure on U.S. Inflation Key reading of producer-level inflation rose at an 11.2% annual rate, the fourth straight month of double-digit increases
The Labor Department on Wednesday said the producer-price index, which generally reflects supply conditions in the economy, increased a seasonally adjusted 1.4% in March from the prior month, a pickup from an upwardly revised 0.9% gain in February. (…)
The so-called core producer-price index—which excludes the often-volatile categories of food, energy and supplier margins—climbed 0.9% in March from a month earlier, after increasing 0.2% in February.
The price pipeline is full. Core PPI (yellow) is up 7.0% YoY but +7.8% a.r. in the last 3 months. Core Goods, supposed to bring the easing everybody is “forecasting” ar2 up 10.0% YoY and +10.2% a.r. in the last 3 months. Processed Goods are +21.7% YoY and +24.0% a.r.
PPI-Services is now up 8.7% YoY and in the last 3 months annualized.
 (Haver Analytics)
Yes, Goods inflation can be volatile, unlike Services, the one to watch and worry about:

- Business travel is still ailing. But leisure travel is outpacing pre-pandemic levels — despite a 10.7% increase in airline fares from February to March. (Axios)
- Amazon Fuel-Inflation Fee Has Sellers Poised to Raise Prices
Amazon.com Inc. will levy a 5% fuel and inflation fee on online merchants that use its shipping services, according to documents reviewed by Bloomberg, putting pressure on sellers to raise prices.
The surcharge, which is scheduled to kick in April 28, will apply to U.S. sellers who use the Fulfillment by Amazon service that stows, packs and ships products. (…)
Amazon merchants were already grappling with cost-related fee hikes that took effect in January and averaged 5.2%. (…)
“We absolutely will need to raise prices,” said Molson Hart, whose Viahart Toy Co. sells educational toys and other products on Amazon. “Some sellers cannot because customers are not accepting the new higher prices.”
Hart said he has already had to take lower profit margins on some larger toys that are more expensive to ship because consumers wouldn’t pay the higher prices. (…)
JFE Holdings Inc.’s steelmaking unit will raise prices by 20,000 yen ($160) a ton across all products from April to compensate for surging coking coal and iron ore costs, according to a spokesman at the company. Additional hikes are likely this year as transport costs are also rising, he said. JFE estimates its average steel prices were 115,000 a ton in the quarter through March.
Nippon Steel Corp., said it raised domestic prices of steel sheets — used in construction and electronics — by 10,000 yen a ton for May-delivery spot contracts. Japan’s biggest steelmaker, warned in a response to questions that more prices rises will be needed this year. Nippon has estimated its average steel prices at 130,000 yen a ton in the March quarter. (…)
Australian coking coal has jumped 45% so far this year, while iron ore prices in Singapore are up around 27%. More than 40% of the steel from the two companies is destined for export with carmakers the biggest customers.
“It’s hard to predict what demand for steel will look like in the future, but the supply-demand balance isn’t bad globally for now,” said Takeshi Irisawa, an analyst at Tachibana Securities Co. in Tokyo. That makes it “relatively easier for domestic steelmakers to pass on increased costs,” he said.
Takahiro Mori, Nippon Steel’s executive vice president, said in February that there would be an increase in longer-term contracts with domestic manufacturers in the half year starting April.
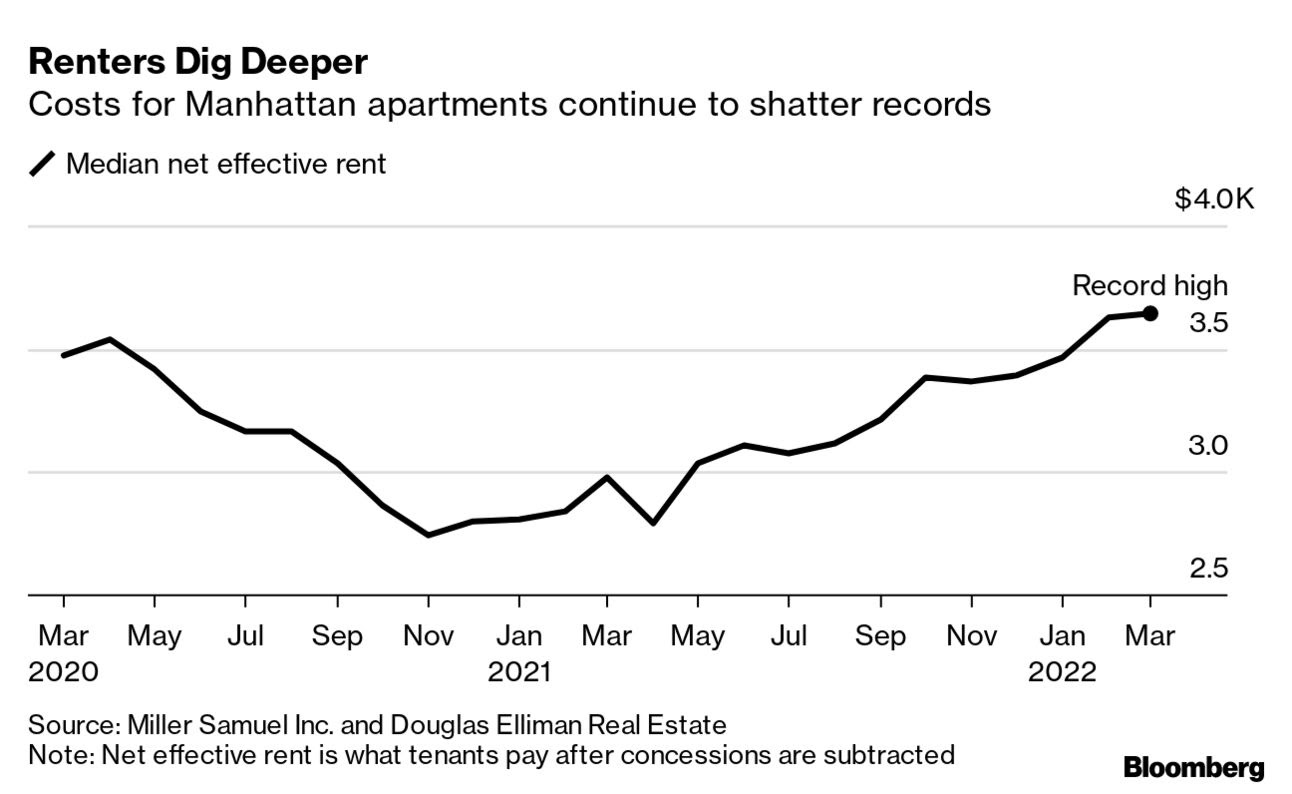
- Manhattan Apartment Rents Hit Another Record in Frenzied Market Rents jumped 23% from a year earlier and are up $14 from the previous record, set in February.
Mirroring the competitive sales market, nearly a fifth of leases were signed at rates above their asking prices — on average 9.7% more. The numbers were similar for February, the first month the firms tracked rental bidding wars. (…)
About 18% of new leases last month had a landlord concession, such as a free month or payment of a broker’s fee, down from 34% a year earlier. The value of sweeteners dropped to 1.5 months of rent, down from two months in March 2021.
Helping give landlords the upper hand is the vacancy rate, which remained below 2% for a fourth consecutive month. Vacancies averaged just over 2% before the pandemic but surged above 10% early last year, according to the firms. (…)
While listings are still down significantly from a year earlier, there were 35% more apartments available for rent in March than in February, Corcoran Group said in its own report.
Excerpts from the Cass Transportation Indexes report:
- Though the shipments component of the Cass Freight Index rose 2.7% from February, this was 1.0% below the normal seasonal pattern.
- The y/y growth in shipments slowed to 0.4% in Q1’22 from 4.3% in Q4’21 and 9.5% in Q3’21.
- The threat of freight recession has risen recently as services reopen, inflation presses up interest rates, and—though war-related effects are likely to be modest in the near-term—higher energy prices have an increasingly negative effect over time. We’re certainly seeing a freight slowdown and spot market correction, but in our view, it is too early to call it a freight recession.
- Using a normal seasonal pattern from March, the shipments component would be up about 3% y/y in April and down about 3% y/y in May.
- The freight rates embedded in the two components of the Cass Freight Index slowed to a 32% y/y increase in March from 37% in February.
- Cass Inferred Freight Rates rose 1.1% m/m on a seasonally adjusted basis in March, setting another new record, but it was the slowest m/m increase in the past seven months.
- we are seeing tangible signs of improvement in driver availability, which is disinflationary.
- After rising 23% in 2021, Cass Inferred Freight Rates are on a 23% trend again for 2022, though that seems unlikely to hold up.
- In early April, truckload spot rates inflected to y/y declines for the first time this cycle, but not the last. The ACT For-Hire Driver Availability Index has returned to levels where the rate turned down in late-2018 and 2019. Labor has recovered strongly from Omicron, which is deflationary for freight rates. Of course, spot rates are a leading indicator, so most of the effects of this change in the cycle will be felt further in the future.
- For now, there is a clear rebalancing happening, which should put us in the peak of the rate cycle.
Richmond Fed’s CFO Survey: Optimism Dips Amid Weaker Economic Outlook and Ongoing Labor Pressures
(…) CFOs’ optimism for the overall U.S. economy fell in our first quarter survey (fielded from March 7-18). Average optimism for the economy dropped from 60.3 (on a scale of 0-100) in the fourth quarter of 2021 to 54.8 in the first quarter of 2022. Interestingly, CFO optimism about their own firm’s performance remained relatively steady; the difference between respondents’ optimism about the economy and own firm performance widened notably from the last survey.
Digging deeper into these results reveals that optimism deteriorated largely among financial executives and business decision-makers at smaller firms (those with fewer than 500 employees). Average small firm optimism regarding the overall economy dipped from 60.6 to 53.9 in the first quarter. Focusing on the median respondent, small firm optimism fell from 65 in the fourth quarter of 2021 to just 55 in the current survey. (…)
Nearly 70 percent of repeat respondents downgraded their optimism about the economy while just one in seven repeat respondents upgraded their outlook. (…)
CFOs also see bourgeoning downside risks, with their worst case scenario [for equity markets vs +3.6% most likely] well below the fourth quarter, at -6 percent, on average. On a brighter note, their longer-run outlook for equities remained more or less intact.
A quick glance at CFOs’ open-text responses to their most pressing concerns highlights the most salient issues weighing on their minds and perhaps explains some of the deterioration in overall optimism. As a share of unique mentions, CFOs ranked “cost pressures/inflation” as their top concern this quarter, supplanting “labor quality/availability” for the first time since the second quarter of 2021.
Similar to last quarter, “supply chain concerns” continue to rank near the top of the list. Perhaps unsurprisingly, “geopolitical risks” — presumably tied to the invasion of Ukraine — rose to become a top-of-mind concern for financial executives. Interestingly, worries over “monetary policy” and the “financial health of customers” made the top 10 list, suggesting that demand conditions are beginning to trouble some CFOs. (…)
Among our respondents, almost three-quarters of those experiencing hiring difficulties (or roughly half of our panel) say that hiring challenges are negatively impacting their revenue. For a large swath of firms, these hiring difficulties are also affecting their ability to operate at full capacity. (…)
We further asked CFOs how their firms were responding to these difficulties. The figure below shows how panelists with hiring difficulties responded, given a list of options. (…)
When asked how much they are increasing wage/salary offerings for hard-to-fill positions, the variance was high, but roughly 80 percent of firms indicated they are raising starting offers by more than 5 percent, with an overall average starting salary increase of 10.4 percent.


In summary, costs are rising across the board, currently pressuring margins, but biz people expect to be able to raise prices to protect margins. This when the Fed is focused on slowing demand…
U.S. Households Face $5,200 Inflation Tax This Year
Inflation will mean the average U.S. household has to spend an extra $5,200 this year ($433 per month) compared to last year for the same consumption basket, according estimates by Bloomberg Economics. The excess savings built up over the pandemic, and increases in wages, will cushion those costs, and allow spending to expand at a decent pace this year. But accelerated depletion of savings will increase the urgency for those staying on the sidelines to join the labor force, and the resulting increase in labor supply will likely dampen wage growth.

Bank of Canada Increases Interest Rates by Half-Percentage Point, Biggest Jump in Decades Officials make a substantial upward revision to their inflation outlook, saying interest rates have further to climb until the consumer-price index moves closer to 2%
The Bank of Canada lifted its target for the overnight rate by half a percentage point from 0.50% to 1.0%. In its latest policy decision, the central bank also said it would begin reducing the assets on its balance sheet, which expanded as it made large-scale asset purchases for the first time to stabilize financial markets during the pandemic. That process would begin April 25.
Canada’s aggressive moves followed action hours earlier from the Reserve Bank of New Zealand, which also raised its policy rate by half a percentage point and left the door open to another similar oversized increase at its next meeting in May. New Zealand’s central bank said a half-point increase now would help reduce the risks of rising inflation expectations. (…)
[Mr. Macklem] added that households should expect the policy rate to rise “toward more normal settings,” which he set at between 2% and 3%—or the neutral rate of interest, a level at which the central bank believes monetary policy neither stimulates nor shrinks economic activity. (…)
The central bank expects inflation to average 5.3% this year, versus an earlier projection of 4.2%. Inflation is expected to average roughly 6% in the first half of the year and remain well above its 2% target in the second half. Inflation is forecast to ease toward 2.5% in 2023 and reach the 2% target in 2024. (…)
The central bank forecasts growth in 2022 of 4.25% before slowing next year to 3.25%. (…)
JPMorgan’s CEO Says ‘Powerful Forces’ Threaten U.S. Economy While CEO Jamie Dimon said the U.S. economy is growing, JPMorgan socked away funds to prepare for higher defaults in case of a recession, and its first-quarter profit fell 42%.
Chief Executive Jamie Dimon said the economy is strong and growing, citing double-digit growth in card spending, low delinquencies and healthy household and consumer balance sheets. But the bank surprised Wall Street by setting aside $900 million in new funds to prepare for economic turmoil; a year ago, it freed up $5.2 billion it had reserved for potential loan losses in the pandemic’s early months.
Those extra funds could cushion the bank if the economy tips into recession, sending loan defaults higher. Mr. Dimon said that risk remains remote but has grown following Russia’s invasion of Ukraine and as inflation has hit its highest level in 40 years.
“Those are very powerful forces, and those things are going to collide at one point,” Mr. Dimon said. “No one knows what’s going to turn out.”
A recession, he said, is far from a sure thing. “Is it possible? Absolutely,” he said. (…)
JPMorgan took total credit charges of $1.5 billion. Of the $900 million set aside for potential future losses, about one-third was tied to Russia, Chief Financial Officer Jeremy Barnum said. The rest, he said, is to account for the risk that interest-rate increases by the Federal Reserve could cause the economy to slow too much, resulting in a recession.
Consumer spending on credit cards rose 29%, with a 64% increase in spending on travel and entertainment. Consumers started carrying more debt as well, as credit-card loans increased 15%. Though card loans remain below prepandemic levels, the increase potentially signals that some customers have started to burn through stimulus funds that buffered them throughout the pandemic.
Still, a 15% increase in consumer and small-business deposits indicates that many remain flush with cash. (…)
Markets will get even choppier in the coming months as the Fed moves to tame inflation, Mr. Dimon said. (…) “I cannot foresee any scenario at all where you’re not going to have a lot of volatility in markets,” he said. “That could be good or bad for trading, but there’s almost no chance it won’t happen.” (…)
- Goldman Sachs: “Current levels of market-implied recession probability of between 20% and 30% (based on leading indicators) have historically been followed by a recession 28% of times within 12m. Only when the recession probability was above 60% were there almost no instances where a recession did not follow within 12m.”
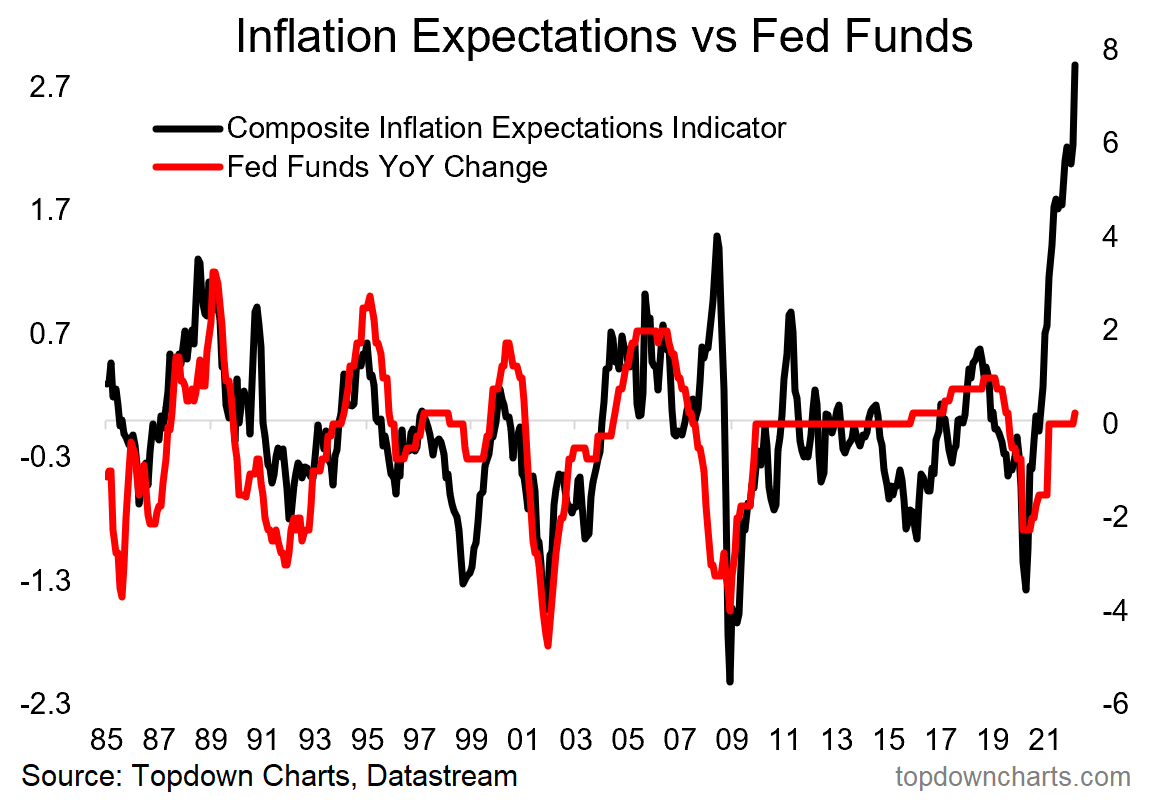
- Fed Behind The Curve: This chart has perhaps become the most important chart of the current macro moment. Inflation expectations have spiraled to 40-year highs, and are at risky of anchoring at persistently high levels. Meanwhile the Fed has now pivoted resolutely into catch-up mode and is talking up the prospects of an aggressive rate hiking and balance sheet normalization program. How this chart plays out will ripple across nearly every asset class. (Callum Thomas)
China’s Central Bank Vows to Use Policy Tools, Including RRR
(…) “Downward pressure on the economy has increased currently,” Sun Guofeng, head of the monetary policy department, said at a briefing Thursday. “We will use monetary policy tools including reserve requirement ratio reduction at the proper time” and keep liquidity “reasonably ample,” he said, referring to the amount of cash banks must keep in reserve. (…)
The PBOC is expected to cut a key policy interest rate — the rate on the one-year medium-term lending facility — for the second time this year on Friday, and reduce banks’ reserve requirement ratio within days to shore up the economy hit by Covid lockdowns. (…)
A total of 200 billion yuan ($31.4 billion) in the tech relending program will be available at a rate of 1.75%, Sun said. The funds will be relent to cover 60% of the principal of loans with at least six-month maturity that 21 national lenders would have granted to high-tech, innovative and leading manufacturing firms, he said. (…)
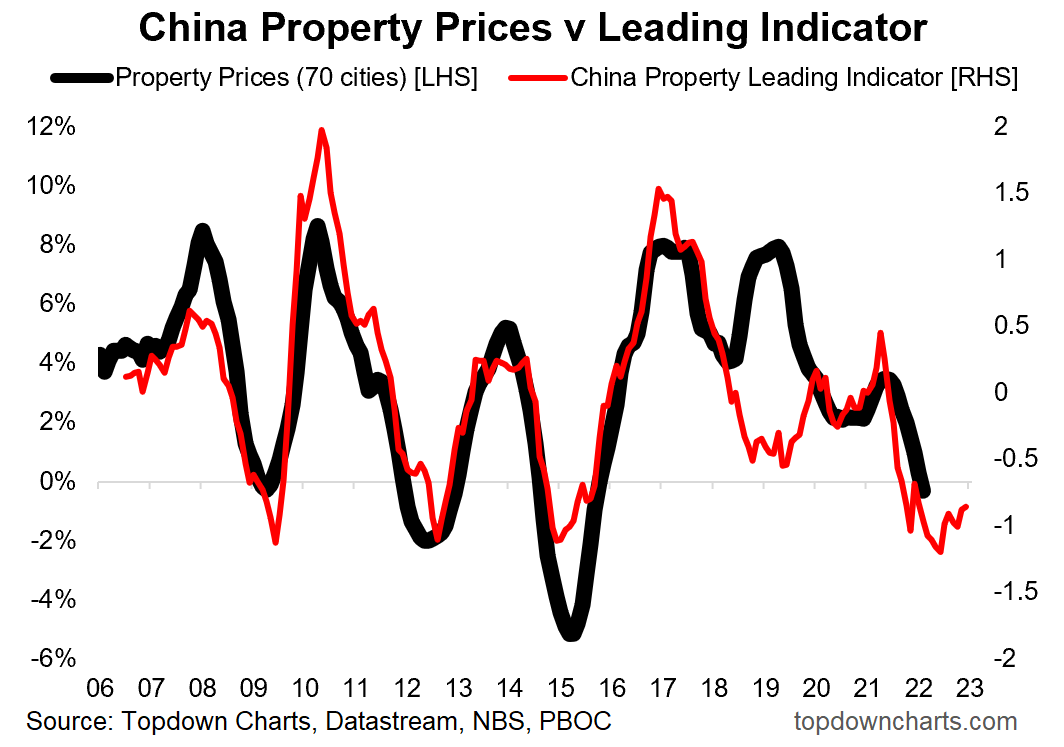
- China Property Downturn
My composite leading indicator for Chinese property prices (money supply, interest rates, funding) is pointing to an extension of the current downturn deeper and well into 2022. This is of critical importance in so far as the economic pulse and commodity demand is concerned, but also – for the policy outlook: the lower that black line goes, the greater the probability of monetary stimulus (and you know what that means!) (Callum Thomas)
- Xi Says China Must Stick to Covid Zero Even as Costs Mount
- Goldman Sachs: “We expect Q1 real GDP year-over-year growth to be 4.0% yoy, same as Q4 last year. This would imply a sharp slowdown in growth to 1.5% (quarter-over-quarter annualized) from 6.6% in Q4 last year.”
Bed Bath & Beyond Grapples With Supply Snags, Slowing Demand
(…) The retailer said Wednesday that an “abnormally high” level of inventory was in transit, unavailable or held at ports through the early part of this quarter. That contributed to a larger-than-expected drop in sales and has thrown a wrench into the company’s plans to reignite growth and improve profitability. (…)
The closely watched metric of comparable sales fell 12% in the period ended Feb. 26, missing the average analyst estimate. Trends have worsened in the current quarter with comparable sales down in the 20% range, Bed Bath & Beyond said on a conference call with analysts. That’s well below the 4.3% projected by analysts in a Bloomberg survey. (…)
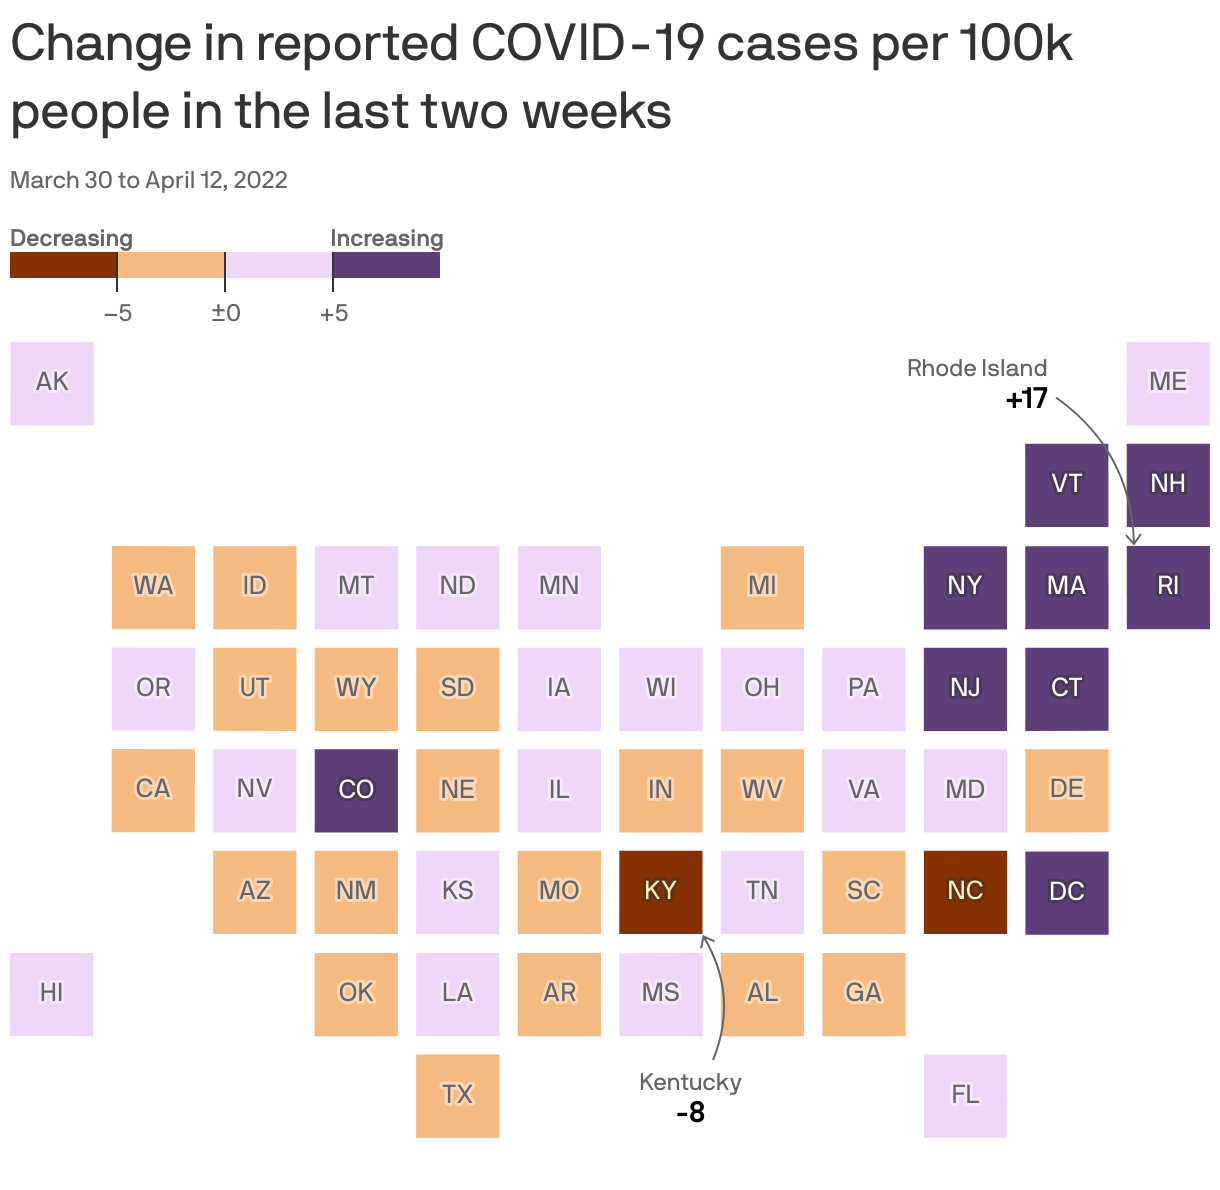
New York’s Surging Covid Cases Driven by New Omicron Subvariants
While there’s no evidence that either causes more severe disease, the department estimates they have a 23% to 27% growth advantage over the BA.2 variant that was itself more infectious than the original omicron. It’s the first reported instance of significant community spread due to the two subvariants in the U.S.
“We are alerting the public to two omicron subvariants, newly emerged and rapidly spreading in upstate New York, so New Yorkers can act swiftly,” State Health Commissioner Mary Bassett said in a statement. “While these subvariants are new, the tools to combat them are not.”
The discovery of the two new subvariants in the U.S. comes as both cases and hospitalizations increase nationwide due to the BA.2 subvariant. With more people using at-home tests, there is also concern the numbers could be an underestimate. On Wednesday, U.S. officials extended the pandemic public health emergency and the mask mandate for travelers, citing the rise in cases. (…)
State data released Wednesday show the seven-day average of cases per 100,000 people in Central New York, where the subvariants were identified, is higher than any other region. They are almost twice as high as those in New York City. (…)
 Data: N.Y. Times. Cartogram: Kavya Beheraj/Axios


