Hiring Strengthens, as Jobless Rate Nears Prepandemic Levels U.S. job growth continued at a robust pace in March while the unemployment rate fell, signs the labor market is booming as the Covid-19 pandemic recedes and more workers return to the labor force.
Employers added 431,000 jobs in March, as restaurants, manufacturers and retailers snatched up workers, and hiring in January and February was stronger than previously reported, the Labor Department said Friday. The report marked the 11th straight month of job gains above 400,000, the longest such stretch of growth in records dating back to 1939. (…)
Nearly 900,000 people were prevented from looking for a job due to the pandemic in March, down from 1.2 million in February, the Labor Department said. (…)
The labor-force participation rate—the share of people employed or looking for work—increased to 62.4% in March, up from 62.3% in February and from a pandemic trough of 60.2% in April 2020.
More than 300,000 women streamed into the labor force in March, accounting for the bulk of labor-force growth. There are still fewer women ages 16 and up in the labor force than before the pandemic hit. Meanwhile, male labor-force levels have fully recovered. (…)
The economy has about 1.6 million fewer jobs than in February 2020. Payrolls in some sectors that were hit hard at the onset of the pandemic—such as leisure and hospitality—remain below prepandemic levels. Other sectors, such as retail, have fully recovered. (…)
About 2.8 million people in early March said they were out of work because they were sick with or caring for someone with Covid-19 symptoms, down from 8.8 million in early January, according to a U.S. Census Bureau survey. (…)
Average hourly earnings grew 5.6% in March from a year earlier. (…) However, wage growth has slowed slightly in the past two months as the labor force has expanded, which could help ease inflation pressures. (…)
Almost one-third of employees who switched jobs during the pandemic are earning a compensation package—including a salary and bonus—that is more than 30% higher in their new role, according to a survey from the Conference Board, a private-research group. (…)
There are 1.6 million fewer people employed than in February 2020 but 2.8 million people are prevented from working being sick or caring for someone. Fully recovered!
However, in the 6 months prior to the pandemic, the U.S. economy was creating 144k jobs per month. At that rate, there would be 3.5M more jobs now than in February 2020. So still 2.3M short from what it should be. But there are 11.4 million job openings.
The more comprehensive U-6 unemployment rate, which also includes discouraged workers and those working part time who want full time, fell by 3 tenths MoM to 6.9%. It was 6.8% in December 2019 and it is just one tenth away from its lowest level since 1994 when they started to calculate this stat.
Hence the pressures on wages. Growth in hourly earnings did slow in the past 2 months as many will point out but, on a quarterly basis, we are still on track with the trend of the past 7 years:

Given where the job market is now, expecting a let down in wage pressures carries low odds, particularly considering inflation. And by-the-way, hourly earnings of production and nonsupervisory employees are still rising at a 6.0% annualized rate in Q1 (+6.7% YoY in March) compared to 5.1% for all private employees (+5.6%).
Pay gains are spread across all industries and companies big and small. The NFIB reported 49% of small businesses raised worker pay in the past three months alone, with 28% expecting to raise wages further in coming months. (Chart from ING)
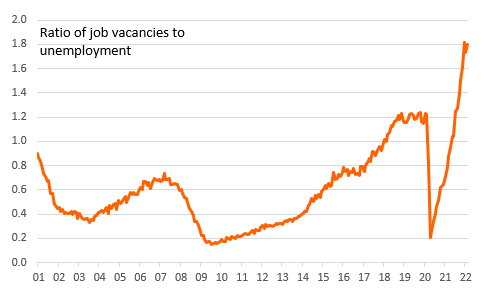
Sequentially, payrolls (employment x wages x hours) rose at a +8.7% a.r. in Q1, +9.1% in the last 2 months. On an economy-wide basis, labor income is still beating inflation, but that will change going forward as the base will jump sharply starting in April. The same negative base effect will start impacting consumer spending and retail sales in Q2.

- Eyes on Inflation, Shoppers Cut Back on Staples American consumers are starting to cut costs on mainstays from toothpaste to baby formula as inflation hits a swath of the economy that had thus far proven resistant to substantial price increases.
(…) Shoppers are buying staples in smaller quantities, switching to cheaper, store-name brands and more rigorously hunting for deals. The shift is especially pronounced among lower-income consumers who splurged on household products amid the heights of the pandemic, they say.
Private-label brands, after two years in which they lost market share to brand names, have begun to lure back buyers. In the three-week period ended March 20, edible private-label brands increased share slightly and nonedible store brands held steady, according to data from research firm IRI. (…)
Another telling sign: sales volumes have begun to fall in a number of categories, meaning people are buying mainstays in smaller quantities. Before and during the height of the pandemic, sales volumes of staples increased even as prices rose. On Feb. 22, volume sales of cereal were down 7.2% on a two-year compound basis; cleaning product volume sales fell 5.1% in that same period, according to a Bernstein analysis of Nielsen figures. Prices for those products rose 9.5% and 7.2%, respectively, for those categories. (…)
- Amazon NYC Warehouse Workers Support Union in Historic Labor Win The election at Amazon’s JFK8 fulfillment center in Staten Island wasn’t close, with the Amazon Labor Union winning 2,654 yes votes versus 2,131 no votes for the company.
(…) “This is a huge shot in the arm for the entire labor movement,” said Kate Bronfenbrenner, the director of labor education research at Cornell University. “This is going to inspire workers, not just throughout the U.S. In people’s eyes, Amazon and Walmart are interchangeable as the biggest private-sector employers that everyone thought couldn’t be beaten. It takes one of the biggest, and says you can organize anyone.”
Even before the Amazon upset, there were a spate of high-profile union election wins in recent months among sub-contracted Google Fiber staff in Missouri, sales employees at REI in New York, tech workers at the New York Times and baristas at Starbucks cafes in New York, Arizona and the company’s Seattle hometown. (…)
In an emailed statement, Amazon signaled a lengthy legal battle could lie ahead. (…)
 From SaaS to RaaS
Robot Subscription Services Let Companies Automate on the Cheap The plans cost as little as $8 an hour, helping smaller businesses dodge high wages and labor shortages.
(…) The robots are coming—and not just to big outfits like automotive or aerospace plants. They’re increasingly popping up in smaller U.S. factories, warehouses, retail stores, farms, and even construction sites. The pandemic has kicked orders for robots into high gear as companies deal with a labor shortage, rising wages, and a surge in demand for their products. U.S. robot orders jumped 28% in 2021 from the previous year, to an all-time high of almost 40,000 units, according to trade group Association for Advancing Automation, and they’re expected to increase again this year.
At the same time, advances in vision, mobility, machine learning, and dexterity have expanded dramatically the variety of tasks the machines can do.
Now, a nascent trend of offering robots as a service—similar to the subscription models offered by software makers, wherein customers pay monthly or annual use fees rather than purchasing the products—is opening opportunities to even small companies. That financial model is what led Thomson to embrace automation. The company has robots on 27 of its 89 molding machines and plans to add more. It can’t afford to purchase the robots, which can cost $125,000 each, says Chief Executive Officer Steve Dyer.
Instead, Thomson pays for the installed machines by the hour, at a cost that’s less than hiring a human employee—if one could be found, he says. “We just don’t have the margins to generate the kind of capital necessary to go out and make these broad, sweeping investments,” he says. “I’m paying $10 to $12 an hour for a robot that is replacing a position that I was paying $15 to $18 plus fringe benefits.”
Robotics providers, including Formic, Robex, and Rios, are designing and installing the equipment, providing maintenance, and charging customers a flat fee that competes and usually beats hourly worker wages. The automation providers take on the risk of the equipment operating as advertised in exchange for the steady stream of revenue. While the subscription automation trend is only getting started, it could expand quickly if it follows the same path software did.
The need to automate has never been more pronounced, because more companies are discussing moving manufacturing back to the U.S. to reduce the risks of supply chains stretched thin across the Pacific. The pandemic highlighted the U.S.’s dependence on foreign countries for key components, and the fourfold increase in maritime shipping costs and port delays have helped stoke the highest inflation since the 1980s. (…)
The U.S. lags manufacturing powerhouses such as South Korea, Japan, and Germany on robot density, or the number of robots as a percentage of a country’s workforce. China is by far the largest market for industrial robots, accounting for 44% of installed robots in 2020 and dwarfing U.S. installations fourfold, according to the International Federation of Robotics.
(…) “There’s no reason why America can’t be the biggest manufacturer in the world. China doesn’t have any structural advantage other than access to labor.” (…)
And more robots are coming to construction. There are already machines that apply plaster to walls and ones that drill holes in concrete ceilings to hang lighting and other fixtures. (…)
Robots are also moving into agriculture as vision and machine learning improve. Stout Industrial Technology Inc. in 2020 began selling a machine that’s pulled by a tractor and weeds large fields. The machine’s sensors distinguish between a desirable crop and the unwanted weeds after being fed thousands of photos to teach it the difference, and the device chops down the weeds with a hoelike blade. This is usually backbreaking work done by crews of about 25 people. “Growers have challenges with labor, and people just aren’t showing up for work,” says Brent Shedd, who was hired in November as CEO of Stout to boost production and sales of the machine. “Your crop is still growing whether the workers show up or not.” (…)
The mobile robots cut down on 95% of the walking required in a traditional fulfillment center, which means 250 workers can now handle the same volume as 1,000, he says. “What we bring to the table is that ability for an enterprise to solve for fulfillment problems with our platform, which is completely flexible and configured,” Vadera says. “It is not built for a particular business requirement.” (…)
The robots can save companies as much as 60% of labor costs while offering efficiency gains and eliminating production interruptions from workers calling in sick or quitting. “Everyone has been super interested, because essentially, from a customer standpoint, there’s zero risk associated with it,” Casse says. (…)
Universal Robots A/S, a pioneer of so-called collaborative robots that can do their jobs safely among humans, works with 300 companies that provide gadgets that attach to the robot arm of its machines, including sanders, grinders, riveters, welders, and grippers, says CEO Kim Povlsen. That explosion of innovation has made the robots much more versatile. “So you take your iPhone—anybody, if they have the know-how, can build an app for it,” he says. “We do the same thing around our robots. It’s a continuous investment to make it easier for anybody to build something on top of the robot.” (…)

RaaS will take off in this environment.
From the IFR:
Supply-chain issues lead companies to consider nearshoring with automation as a solution.
One particularly revealing statistic from the US shows how automation is helping businesses get back to business: According to the Association for Advancing Automation (A3), robot orders in the United States in the third quarter of 2021 were up 35% over the same period in 2020. More than half of the orders are from non-automotive sectors.
And this record growth isn’t just robotics either—machine vision, motion control, and motors are also seeing big increases.
With a robot’s ability to share tasks and learn through AI, companies can also adopt intelligent automation more easily in new environments, from construction to food and beverage packaging facilities to healthcare labs.
AI for robotics is maturing and learning robots are becoming mainstream. The industry is past the pilot phase, and we can expect to see a larger deployment of these technologies in 2022.
The trend for low-cost robotics also comes with easy setup and installation, with specific applications pre-configured in some instances. Suppliers offer standard programs combined with grippers, sensors, and controllers. App stores provide program routines for various applications and support lower-cost robot deployment.
U.S. PMIs
S&P Global US Manufacturing PMI: Output growth accelerates to fastest in seven months as supply disruption eases
March PMITM data from S&P Global signalled a sharp improvement in operating conditions across the US manufacturing sector. Overall growth was supported by faster increases in output and new orders, as domestic and foreign client demand ticked higher. Although backlogs of work rose at a sharper pace – largely due to greater new sales -firms noted that fewer supply bottlenecks allowed production to expand at a faster rate. Moreover, supplier delivery times deteriorated to the smallest extent since January 2021. Nonetheless, costs continued to soar, as the rate of input price inflation quickened to a marked pace.
Encouraged by stronger demand conditions, firms stepped up their hiring activity, with some also noting a greater ability to find suitable candidates. Meanwhile, expectations regarding the outlook for output reached the highest since November 2020.
The seasonally adjusted S&P Global US Manufacturing Purchasing Managers’ Index™ (PMI™) posted 58.8 in March, up from 57.3 in February and slightly higher than the earlier released ‘flash’ estimate of 58.5. The improvement in the health of the US manufacturing sector was steep overall and the sharpest since last September.
Contributing to the overall upturn was a sharper expansion in production at the end of the first quarter. The pace of growth continued to gain momentum and was the quickest since last August. Crucial to the increase were reports of improved availability of raw materials and inputs as supply chain disruption eased slightly. Companies also noted that higher output was supported by stronger client demand and a rise in new orders.
March data indicated a marked increase in new sales at goods producers, and one that was the sharpest for six months. Some firms linked the rise in new orders to stockpiling at customers amid steep increases in selling prices, whilst others mentioned the placement of larger order volumes.
(…) although price pressures remain elevated, with surging energy costs pushing firms’ costs higher at an increased rate in March, rates of inflation of both input costs and average selling prices have fallen from the record highs seen late last year to hint that consumer price inflation could likewise soon peak.

The ISM:
The U.S. manufacturing sector remains in a demand-driven, supply chain-constrained environment. In March, progress was made to solve the labor shortage problems at all tiers of the supply chain, which will result in improved factory throughput and supplier deliveries. Panelists reported lower rates of quits and early retirements compared to previous months, as well as improving internal and supplier labor positions.
March brought back increasing rates of price expansion, due primarily to instability in global energy markets. Suppliers are not waiting to experience the full impacts of price increases before negotiating with their customers.
Panel sentiment remained strongly optimistic regarding demand, with six positive growth comments for every cautious comment, down from February’s ratio of 12-to-1. Demand expanded, with the (1) New Orders Index remaining in growth territory, supported by weaker growth of new export orders, (2) Customers’ Inventories Index remaining at a very low level and (3) Backlog of Orders Index continuing in strong growth territory. (…)
The Employment Index expanded for a seventh straight month; panelists indicate their ability to hire continues to improve, to a greater degree than in February. Challenges with turnover (quits and retirements) and resulting backfilling continue to plague panelists’ efforts to adequately staff their organizations, but to a lesser extent compared to February. (…)
The Prices Index increased for the 22nd consecutive month, at a dramatically higher rate compared to February.
Five of the six biggest manufacturing industries — Food, Beverage & Tobacco Products; Machinery; Transportation Equipment; Chemical Products; and Computer & Electronic Products — registered moderate-to-strong growth in March. (…)
From the ISM: WHAT RESPONDENTS ARE SAYING
- “No letup yet in supply chain challenges, especially electronic components. Relying more and more on the broker market.” [Computer & Electronic Products]
- “Customer orders are brisk in the face of significant price increases, while we continue to struggle with inbound supplier service and raw material availability issues.” [Chemical Products]
- “Generally speaking, the business environment is slowly improving for aerospace component manufacturers. Supply chain disruptions and still-extending lead times continue to keep purchasing busy. This further causes reevaluation of the current year’s business plan and cost assumptions.” [Transportation Equipment]
- “Overall business conditions are challenging in both domestic and international transportation. The Russian invasion of Ukraine has created uncertainty in the grain markets, causing upward pricing pressure. In addition, inflationary pressures across all categories have made it challenging to manage cost and profitability.” [Food, Beverage & Tobacco Products]
- “Prices are increasing on steel and steel products after a slight decrease from highs last month. Transportation costs are going up significantly with the increase in fuel prices.” [Machinery]
- “Demand continues to be strong. Backlog is still increasing — currently at about three months of production. Availability of purchased material continues to constrain production, causing the increased backlog.” [Electrical Equipment, Appliances & Components]
- “Business continues to be strong, with incoming sales higher but still combating labor and material issues like availability and inflation. Still determining impact of the Russian invasion of Ukraine.” [Furniture & Related Products]
- “The supply situation is getting worse, with lead times extending over 12 months, material not available, and suppliers not quoting or taking orders. Prices on the rise daily.” [Miscellaneous Manufacturing]
- “Supply chain is still unstable. While we have seen improvements, there are still a lot of issues that have yet to be resolved.” [Primary Metals]
Fifteen of 17 manufacturing industries reported growth in new orders in March, compared with 16 in February, 11 in January and 13 in December.
- Commodities Up in Price: 45 vs 33 in February, 35 in January, 28 in December and 36 in November.
- Commodities Down in Price: 1 vs 6 in February, 7 in January, 8 in December and 5 in November.
- Commodities in Short Supply: 24 vs 13 in February, 16 in January, 10 in December and 21 in November
New Orders New Export Orders Customers’ Inventories


In all:
- Goods producers are benefitting from strong demand on inventory replenishment and stockpiling.
- Employment issues are easing somewhat, allowing increased production rates.
- ISM survey suggests continued broad inflation/costs issues. S&P Global’s survey notes some signs of easing.
More from S&P Global:
Inflows of new business also grew at the strongest rate for six months as customers looked to the further reopening of the economy amid signs that the disruptions from the pandemic continue to fade. Both domestic and export order book growth improved, with new export orders notably rising at the joint-fastest pace for almost a year.
The rise in demand meant new order inflows once again ran ahead of production to suggest that output growth could have been even stronger had it not been for ongoing constraints on production, though notably the output shortfall relative to demand was the joint-smallest seen over the past year.
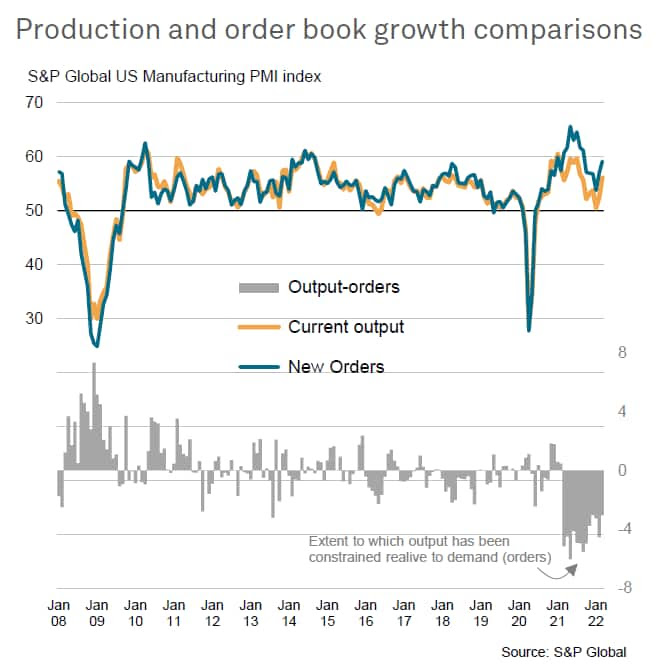
National PMI readings were above the neutral 50.0 mark for 23 out of the 30 nations for which March data were available. North America and the eurozone remained brighter growth spots. (… )
Manufacturing economies in the South America and Asia regions tended to fall towards the lower reaches of the PMI league table. Russia registered the lowest PMI reading, while China, Turkey, Mexico, Myanmar, Kazakhstan and Malaysia were the only other nations to signal contractions.
Only modest growth was signalled for South Korea, Brazil, Colombia, Thailand and Vietnam. (…)Global supply chains remained stretched during March. This was highlighted by a further marked lengthening of average supplier lead times. The extent of the increase in delivery times remained among the steepest in the survey history and was also slightly more marked than in the prior month.
Average input prices rose at the fastest pace in four months and at a rate well above the long-run average. Part of the increase was passed on to clients through higher charges, as output prices also rose at a faster clip (a five-month high).
A super-tight jobs market means the risk of a hard landing are high, says paper co-authored by Larry Summers
In a paper circulated by the National Bureau of Economic Research, Summers and Alex Domash, a research fellow at the Harvard Kennedy School, say the idea inflation can fall dramatically without a corresponding rise in labor market slack runs counter to standard economic theory as well as historical evidence.
Since 1955, there’s been a quarter with price inflation above 4% and unemployment below 5% that was not followed by a recession within two years, they note. (…)
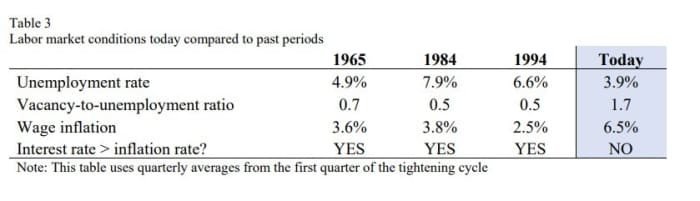
Historically, they note, the likelihood of a soft landing is very low based on current conditions. And the unemployment rate and wage inflation data is much different now than in the soft landings of 1965, 1984 and 1994.
Fed Chair Jerome Powell in a speech in March used those three periods as evidence of soft landings.
To bring the inflation rate down to 2.3% by 2024 and wage inflation down to 3%, the unemployment will have to surge to 8.4%, according to Summers and Domash economic model. Wage inflation of 4% would require a less painful 5.4% unemployment rate, according to their model.
EARNINGS WATCH
The Q2 earnings season has begun…with some companies reporting odd quarter ends:
17 companies in the S&P 500 Index have reported earnings last week. We are perhaps beginning to see signs of earnings troubles in Q2.
Of these companies, 70.6% reported earnings above analyst expectations and 29.4% reported earnings below analyst expectations. In a typical quarter (since 1994), 66% of companies beat estimates and 20% miss estimates. Over the past four quarters, 83% of companies beat the estimates and 13% missed estimates.
In aggregate, companies are reporting earnings that are 1.9% above estimates, which compares to a long-term (since 1994) average surprise factor of 4.1% and the average surprise factor over the prior four quarters of 13.3%.
Of these companies, 82.4% reported revenue above analyst expectations and 17.6% reported revenue below analyst expectations. In a typical quarter (since 2002), 62% of companies beat estimates and 38% miss estimates. Over the past four quarters, 80% of companies beat the estimates and 20% missed estimates.
In aggregate, companies are reporting revenues that are 1.1% above estimates, which compares to a long-term (since 2002) average surprise factor of 1.2% and the average surprise factor over the prior four quarters of 3.7%.
The estimated earnings growth rate for the S&P 500 for 22Q2 is 6.8%. If the energy sector is excluded, the growth rate declines to 2.4%.
Five of the 17 are Consumer Discretionary companies. Their beat rate was a low 40% with a -25.7% surprise factor. Four others are Consumer Staples companies and all of them beat with +9.9% surprise factor. Four of the five tech cos beat (+3.7% s.f.).


Last week, downward revisions hit 7 S&P 500 sectors vs 4 the previous week:


JPMorgan’s Dimon warns of potential $1 billion loss from Russia exposure Dimon did not provide details on JPMorgan’s potential loss number or a time frame but said the bank was concerned about the secondary impact of Russia’s invasion of Ukraine on companies and countries.
(…) Commenting on the macroeconomic environment, Dimon said the number of Federal Reserve interest rate hikes “could be significantly higher than the market expects.” He also detailed the bank’s rising expenses, in part due to technology investments and acquisition costs. Investments in technology will add $2 billion to expenses this year, Dimon said. (…)
Dimon said that the bank will be reducing stock buybacks over the next year to meet capital increases required by federal rules “and because we have made some good acquisitions that we believe will enhance the future of our company.” (…)
- Starbucks Suspends Buybacks as Schultz Returns as CEO The coffee giant said it is suspending billions of dollars in share repurchases, a move that interim CEO Howard Schultz said would free up cash to invest in cafes and employees.
TECHNICALS WATCH
S&P 500 Is Defying Skeptics on Run Toward Record, Charts Show Technical studies suggest naysayers risk missing out on a run to a record high.
(…) Wall Street strategists remain divided on whether the S&P 500 index is in a bear market rally — and, if so, how long it will last. The gauge is up about 9% from a low hit after Russia invaded Ukraine, leaving it about 5% off its record from early January. (…)
Last week, 80% of the roughly 2,000 constituents of the NYSE Composite Index — which spans all common stocks listed on the New York Stock Exchange — traded above their 20-day averages. That’s happened 56 times in the last decade, and over the subsequent 100 days after these occurrences, the gauge climbed an average 6%, according to data compiled by Bloomberg. (…)
The technology-heavy Nasdaq 100 index is also flashing some positive signals. In mid-March, it rallied more than 10% over four trading sessions. Four-day gains of at least 10% are rare, occurring 12 times in the last two decades, according to data compiled by Bloomberg. Over the subsequent 100 days, the index returned an average of 8%.
And this generally useful chart did a U-turn last week:
S&P 500 Large Cap Index – 13/34–Week EMA Trend 
My favorite technical analysis firm says that we haven’t had a conventional capitulation phase yet to truly exhaust supply like in March 2020 and January 2016 and 2018. It also notes that smaller cap stocks have not followed the recent upward rally, highlighting a lack of true appetite for risk. An April Fools’ rally.
Retail traders may also be playing a part in the latest gains. Options markets suggest at-home traders, who helped fuel last year’s ferocious equity rally, are back and buying. A key measure of call volumes on 23 retail meme story is rising to levels reminiscent of previous speculative bubbles. (Bloomberg)
 It’s pretty obvious a lot of investors don’t know what they are doing. Why would stocks jump after announcing a stock split, let alone only saying they are thinking about splitting their stock?
Short Sellers Bet Tether, Crypto’s Central Bank, Is Vulnerable to a Run Tether says it has conservative investments, while hedge funds question how much risk lies in the $82 billion investment portfolio that backs the currency.
A few investment firms, including Fir Tree Partners and Viceroy Research LLC, have placed substantial bets in recent months that the price of tether will fall, according to people familiar with the matter. Tether is the most popular currency for trading bitcoin and is supposed to have a fixed value pegged to the U.S. dollar. (…)
Tether isn’t a household name, but it is a cornerstone to the crypto ecosystem. Traders on big exchanges often use tether as an easier way to buy crypto than through bank accounts or wire transfers. (…)
Short sellers are betting that the $82 billion portfolio that underpins tether’s value, now the size of a big money-market fund, is at risk of losses that the parent company hasn’t disclosed, according to some of the people familiar with the short positions. (…)
Tether Holdings Ltd., its parent company, has promised a full audit of its reserves for years but never produced one. It took a yearslong investigation by New York’s attorney general, and an eventual $18.5 million settlement of accusations that Tether misled clients, for Tether to reveal what it holds in only broad terms each quarter through its accounting firm. To prevent more disclosure, even of mundane matters like the name of its chief investment officer, Tether has gone to court to block public-records requests about its business. (…)
Tether said that delivering a full audit remains a priority. It admitted no wrongdoing as part of its settlement with New York’s attorney general. Tether’s attorneys argued in court filings that additional disclosure of its reserve investments would harm its competitive position in the market and that revealing its chief investment officer’s name would “constitute an unwarranted invasion of privacy.”
(…)
EU, China Clash Over Ukraine Conflict European Commission President Ursula von der Leyen says Brussels and Beijing ‘exchanged very clearly opposing views’
(…) After a two-hour conversation with Chinese Premier Li Keqiang and a video call of less than an hour with President Xi Jinping, European Commission President Ursula von der Leyen made it clear Beijing had offered no assurances to Brussels about its stance on Ukraine.
In a press conference after the call, Ms. von der Leyen said, “We exchanged very clearly opposing views…China has an influence on Russia. And therefore we expect China to take its responsibility to end this war” by pushing Russia toward a peaceful solution.
Ms. von der Leyen warned that China would suffer “major reputational damage” among the European public and business community if it stayed on the fence or sided with Moscow over Ukraine.
China’s official Xinhua News Agency issued a summary of the virtual meeting between Mr. Xi and the EU leaders even while the call was still happening, the latest example of Beijing seeking to shape the narrative at a time of mounting questions about its political alignment with Russia during the invasion of Ukraine. A big question is whether Beijing would go beyond its political support for Moscow to provide it with any substantial assistance.
During the meeting, according to Xinhua, Mr. Xi underscored the need for China and the EU to increase communication on their relations and on major issues including the Ukraine war, saying both sides should “play a constructive role in adding stabilizing factors to a turbulent world.”
The Chinese leader also urged the EU to “form its own perception of China, adopt an independent China policy, and work with China for the steady and sustained growth of China-EU relations.”
Those remarks reflected growing worries among the Chinese leadership that Europe is following the U.S. in adopting an increasingly hardened policy toward China. With its relations with Washington shakier than in decades, Beijing is trying to salvage its ties with Brussels in a bid to keep the bloc as a buffer against heightened competition with the U.S.
A senior EU official briefed on the call said that while Mr. Li stressed the importance to China of a peaceful outcome of the conflict and called on the EU and China to work together to stabilize the global economy, Beijing made it clear this was primarily a European problem.
However, a second European official said China’s leaders did say they were doing more behind the scenes to press for an end to the conflict than was visible. Pressed on what they were doing, they provided no details, the official said.
European officials said that as a permanent United Nations Security Council member and a country with close political ties to Russia, Beijing had a responsibility to defuse the conflict, which they said not only posed a major threat to global order but also undermined global peace and security. (…)
China Variants and Omicron XE Put Fresh Focus on Covid Mutations
The World Health Organization said a hybrid of two omicron strains — BA.1 and BA.2 — that was first detected in the U.K. and dubbed XE could be the most transmissible variant yet. It is estimated to spread 10% more easily than BA.2, which itself was more transmissible than the original omicron famous for its ease of penetration.
Meanwhile in China, which is experiencing its biggest outbreak since Wuhan, authorities have disclosed two novel omicron subvariants that don’t match any existing sequences. It’s unclear if the infections were one-off events of little significance, or if they may be a sign of problems ahead. (…)


 NATO members are now also for the first time considering permanently stationing troops in members that joined after the end of the Cold War and were once Soviet satellites. Under an agreement struck between NATO and Russia in 1997, the alliance had agreed not to permanently station troops in those countries. NATO leaders say that Russia’s invasion of Ukraine rendered that agreement void, so the alliance can now deploy troops as it sees fit.