Personal Income and Outlays, February 2022
Just out at 8:30am:
Personal income increased $101.5 billion, or 0.5 percent at a monthly rate, while consumer spending increased $34.9 billion, or 0.2 percent, in February. The increase in personal income primarily reflected an increase in compensation of employees that was partly offset by a decrease in government social benefits. The personal saving rate (that is, personal saving as a percentage of disposable personal income) was 6.3 percent in February, compared with 6.1 percent in January.


Real Disposable Income has declined in each of the last 7 months. Ex-transfers, flat in the last 5 months. Last 4 months, real expenditures rose only 0.8% annualized. No meaningful dissaving to sustain consumption.

French Inflation Jumps More Than Expected to Hit New Record
European Union-harmonized consumer prices rose 5.1% from a year ago in March — the most since the data series began in 1997. The median estimate in a Bloomberg survey of economists was 4.9%. Out of 19 surveyed, 13 expected a lower reading.
Thursday’s data follow unexpectedly high readings the previous day from Germany and Spain, with the latter reporting a number approaching 10%. France, the euro area’s second-largest economy, has done more to shield consumers from spiking energy costs. (…)
Macron’s government has already earmarked about 25 billion euros ($27.9 billion) to cap electricity and natural-gas prices, and offer motorists a rebate on gasoline and diesel. While the Insee statistics office estimates that such measures have shaved about 1.5 percentage points off inflation, household expectations for future price increases have hit the highest level since records began in 1972.
ING:
(…) it is likely that the inflation peak is near and that inflation will start to fall again in a few months, probably as early as the summer. Indeed, the strong rise in inflation currently observed is weighing on household purchasing power and negatively impacting consumption. Combined with the confidence shock induced by the war in Ukraine, this will lead the French economy to slow down sharply. We believe that a quarter of negative GDP growth cannot be ruled out. Demand will therefore lose momentum, which will impact the pricing power of companies, limiting inflationary pressures. We expect inflation to average above 4% for the year 2022, but then to fall rapidly and remain below 2% in 2023.
- Italian Inflation Surges to 7% on Energy Prices Stoked by War For now, Italian inflation still is slower than in Germany, where it touched 7.6% this month, or in Spain, where readings are approaching 10%.
- Eurozone unemployment falls to fresh low
At 6.8%, the eurozone unemployment rate is now well below the European Commission’s natural rate of unemployment estimate. This is a rate below which wage growth should start to accelerate. We also expect that to be the case for this year given the current high level of inflation and the tight labour market that has emerged since the pandemic. Still, we haven’t seen much evidence so far of improving wage growth and the war is likely to dampen wage growth improvements further.
The rapid recovery of the job market is set to slow from here on. The war adds uncertainty to the employment outlook and could result in delayed new hiring. This is especially the case in manufacturing, as the industrial sentiment survey already revealed declining hiring expectations in March. Still, the labour market remains very robust at current levels of unemployment. (ING)
Biden Expected to Tap Oil Reserves to Control Gas Prices President Biden is preparing to announce the release of up to 1 million barrels of oil a day from the U.S. Strategic Petroleum Reserve, according to people familiar with the plans.
Oil dropped by more than $5 a barrel in a matter of minutes after a report that the Biden administration is considering releasing about 1 million barrels a day from its strategic reserves for several months. (…)
The U.S. currently holds about 570 million barrels in the reserves — the lowest since 2002 — and a 180 million barrel release without replacement would imply a more than 30% decrease. (…)
The release would help cap oil prices in the short-term, but it’s unlikely to make up for the losses of Russian oil exports, said Jeffrey Halley, a senior market analyst at Oanda Asia Pacific Pte. In the longer run, it means that the U.S. SPR will be substantially reduced when demand typically climbs over the U.S. summer driving season, a potential upside for oil prices. (…)
The move is likely to be insignificant, with the key focus still being Russian exports, said Victor Shum, vice president of consulting at S&P Global. A wide range of outcomes are possible on Russian crude, with up to 7.5 million barrels a day of exports at stake. Any loss of Russian shipments could be replaced through higher output from Saudi Arabia and the United Arab Emirates and release of government-controlled reserves, at least for several months. Should Russian exports fall 3 million barrels a day from pre-invasion levels from April to December, that would be 825 million barrels, well above the 575 million barrels currently held in the already-shrinking U.S. SPR, he said. (…)
- Oil Consumers Take Control of Market as OPEC+ Stands Back Consumers are taking matters into their own hands because the Organization of Petroleum Exporting Countries and its allies are resisting being drawn into the political crisis caused by the military aggression of Russia — one of the cartel’s leading members.
- The LNG Export Boom is Draining U.S. Natural-Gas Supplies and Lifting Prices Overseas shipments of shale gas are replacing Russian supplies in Europe and boosting prices at home.
Natural-gas prices usually decline into spring, when heating demand drops but before air-conditioning season begins. Gas producers and traders use the off-season to build up inventory for summer, socking away fuel in storage facilities until the weather turns and demand and prices rise.
This year prices climbed into spring, thanks to record export volumes and promises from the White House to support the shipment of even more liquefied natural gas, or LNG, to allies across the Atlantic to supplant Russian supply.
U.S. natural gas futures for May delivery ended Wednesday at $5.605 per million British thermal units, more than double the price from a year ago. So far in 2022, natural-gas prices have risen 50%. (…)
The amount of gas in storage in the lower 48 states is 17% below the five-year average for this time of year despite production that has eclipsed pre-pandemic highs, according to the Energy Information Administration. (…)
The bulk of oil and gas executives surveyed this month by the Federal Reserve Bank of Dallas said they expect natural-gas prices to end the year between $4 and $5.50. (…)
[Goldman Sachs] said it should be 2025, however, before enough additional LNG export terminals come online in the U.S. to really tighten domestic inventories and tether prices to more expensive international markets. (…)
Higher gas prices have contributed to inflation at home by boosting manufacturing costs for plastics, fertilizer, concrete and steel. They have also meant some of the highest electricity and heat bills in years for Americans this winter. (…)
The Energy Information Administration predicts LNG exports will average 11.3 billion cubic feet per day this year, up 16% from 2021. (…)
It Isn’t Just Tom Brady—More People Are Coming Out of Retirement In February, the share of retired workers re-entering the workforce climbed to around 3% of total retirees, its highest level since early March 2020, according to an Indeed analysis of federal labor data.
Covid-19 Outbreaks Slow Factory Activity in China Official surveys for March offered the first broad glimpse of the economic cost of efforts to contain Omicron outbreaks in some of the country’s most important industrial hubs.
(…) China’s official purchasing managers index for the manufacturing sector dropped to 49.5 in March from 50.2 in February, the National Statistics Bureau said Thursday. (…) A gauge of new export orders fell even further into contractionary territory, sinking to 47.2 in March from February’s 49.0.
A purchasing managers index for nonmanufacturing sectors, which includes both services and construction activity in China, tumbled to 48.4 in March from 51.6 in February, as Covid restrictions hammered industries that involve close personal contact, such as railway and air transportation, catering and accommodation, the statistics bureau said.
One brighter spot was construction, where activity rose in March as the weather improved and companies heeded Beijing’s call to expand infrastructure investment.
- The new orders sub-index fell to 48.8 from 50.7. NBS indicated the industry divergence was significant in March – the output and new order indexes of food, drinks and electrical machinery were above 50, while the output and new order indexes of textile, clothes and general machinery were below 45.0. The new export order sub-index fell to 47.2 in March vs. 49.0 in February, and the import sub-index decreased to 46.9 in March (vs. 48.6 in February).
- Price indicators in the NBS manufacturing survey suggest inflationary pressures picked up further in March – the input cost sub-index rose to 66.1 (vs. 60.0 in February), and the output prices sub-index rose to 56.7 (vs. 54.1 in February). (GS)
- Shanghai Will Lock Down 16 Million in Toughest Virus Test Yet Authorities are seeking to curtail a record outbreak that’s brought unprecedented disruptions to the city.
China Weighs Raising Billions to Rescue Troubled Financial Firms It’s seeking to shore up confidence in the $60 trillion financial system as the economy slows and a debt crisis in the property industry spreads.
(…) The stability fund would dwarf other pools available to bail out troubled institutions and their depositors.
China is moving to stem financial risks ranging from hundreds of weak rural banks to dozens of distressed developers saddled with at least $1 trillion of liabilities. Challenges are mounting as the debt crisis ripples through the property market and as a resurgence in Covid infections forces a partial shutdown in Shanghai, threatening to sap momentum in the world’s second-largest economy.
While the key mandate of the new fund is to rescue financial institutions, it could indirectly help too-big-to-fail entities in other sectors including real estate by providing financing through banks, said the people, asking not to be identified discussing a private matter. This would be the first fund dedicated to ensure broad financial stability, unlike previous funds that were more targeted. (…)
The capital will come from a variety of sources including local governments and major banks, as well as funds set up to insure retail deposits and bail out insurance and trust firms, the people said. (…)
The PBOC labeled 316 financial institutions as high-risk entities in the fourth quarter, most of them small rural banks. (…)
Setting up a stability fund signals regulators are taking “proactive steps to prevent the potential spill-over effect from developer default to the financial system, which can mitigate the credit risk facing banks” in the long term, Citigroup Inc. analysts led by Judy Zhang wrote in a March 7 note. (…)
- Home sales across China’s largest cities remained weak in March however, tumbling 45%, according to Bloomberg Intelligence. China Vanke Co. warned the housing market may have peaked in 2021 as population growth and the pace of urbanization slow. Vanke reported its first profit decline since the 2008 financial crisis.
FAT PROFITS
2021 was the most profitable year for American corporations since 1950. Profits surged 35%, according to the Commerce Department, driven by strong household demand, which was underwritten by government cash transfers during the pandemic. Workers got a bump too—though not as much as shareholders—with compensation rising 11%. (Bloomberg)
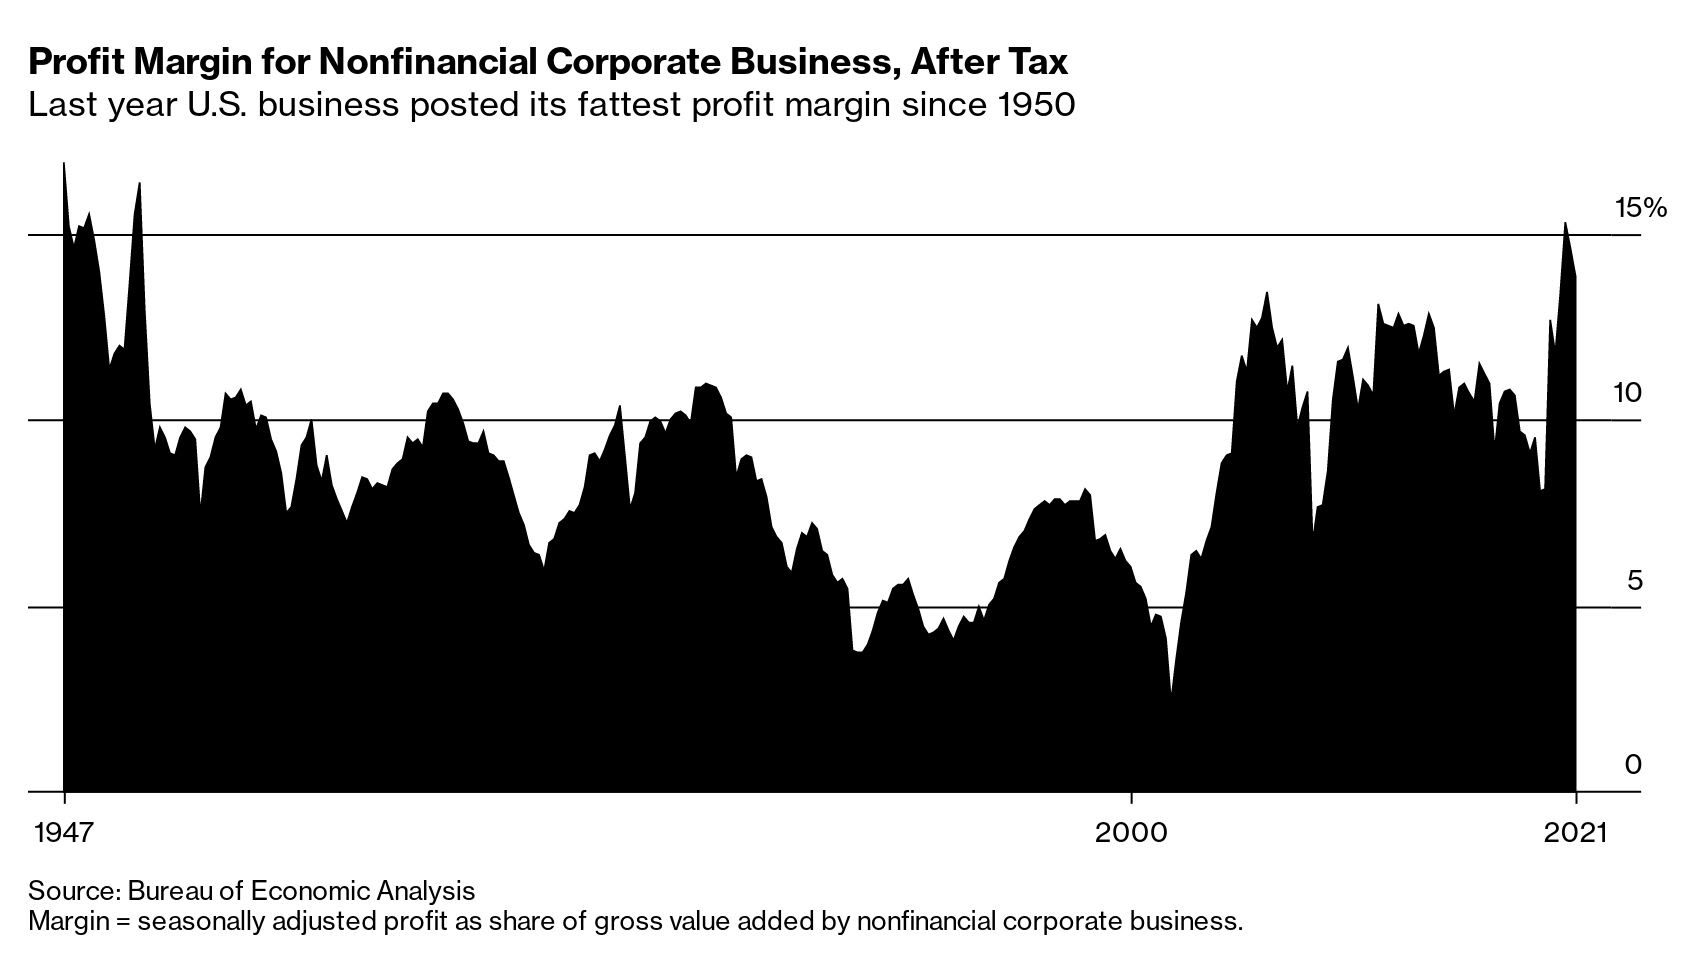
- MS US economists and equity strategists see structurally higher wages in the US. Wage gains are likely to outpace productivity on a structural basis, eating into corporate profits.
Real wages systematically undershot productivity growth for most of the last two decades, and the labor share of income fell notably as a consequence. Corporate profit margins were the prime beneficiaries of the falling labor share. The record-breaking pace of the economic recovery has come with very fast wage growth. If we are right, monetary and fiscal policy will henceforth create persistently tight labor markets, meaning that the case for a structural uptrend in wages — and therefore the labor share of income — is strong. In our top-down economic model, the full convergence of real wages with productivity implies that the economy-wide pretax profit margin declines to 10.7% from 17.8% today.
Corporate concern about wages has reached new highs, in line with our view that 2022 margins are at risk. Our analysis of transcripts from earnings calls, updates, and presentations shows a surge in labor-related phrases, while small business surveys show vacancies at a historical high and labor costs as a great concern. Price increases to offset higher wages may soon lose steam as demand destruction is emerging in consumer end markets, including household durables, autos, and homes. Importantly, higher wages are not just a function of the hot labor market but reflect structural shifts. (Morgan Stanley)
“FAT AND FLAT”
Goldman Sachs offers 7 reasons why equities are holding up well. But it may be all relative…
1. Real interest rates remain deeply negative and equities provide a real yield. As the [bond] yields no longer protect against inflation, and capital losses undermine their ‘risk free’ characteristics, we believe there is a growing desire to reduce bond holdings in favour of real assets.
2. Equities are a real asset as they make a claim on nominal GDP. In the post-financial crisis era, weak economic activity and lower inflation pushed down nominal GDP, raising the equity risk premium and reducing the bond term premium. So long as economies grow, revenues and dividends should also grow. The dividend yield can be thought of as a real yield. Equity risk premia have started to decline in the post COVID cycle but remain higher than in the pre-financial crisis era. (…)
While equities may not have much upside in absolute terms, the risk balance has shifted, thereby raising their relative attractiveness in portfolio allocation towards real assets and equities
3. Private sector balance sheets are strong.
4. Credit markets have been relatively stable – reducing systemic risks.
5. Fiscal spending/CAPEX are increasing.
6. Valuations have fallen to below long-run averages. While equities are only moderately below their lows, aggregate valuations have come down over the past year as markets have fallen behind the progression of earnings (typical in the ‘Growth’ phase of the equity cycle). (…) globally Equities have moved down to around the 50th percentile and, outside of the US, closer to the 20th percentile.
While the US remains expensive overall, the most expensive parts of it (unprofitable tech) have de-rated sharply as interest rate expectations have increased.
7. Positioning had been heavily reduced, raising the asymentry on risk assets. We have argued that positioning had become very cautious in recent weeks. Our risk appetite indicator, RAI, made up of 27 risk premia across the major asset classes, had reached very depressed levels. An unwinding of bearish positioning, in particular among fast money investors, has likely contributed to the recent price action. Our aggregate measure of cross-asset positioning and sentiment has turned increasingly bearish YTD, bottoming at 30% 2 weeks ago, which tends to indicate an improved asymmetry for risky assets.
While equities should provide a hedge against inflation over the medium term, and should outperform bonds, there remain risks to the downside and more volatility, particularly related to growth risks. We see three conclusions:
1. We continue to see this as a ‘fat & flat’ market environment – a wider trading range and lower returns than in the post financial crisis era (when lower yields pushed valuations ever higher). There remain risks of corrections in an environment in which equities continue to outperform bonds. We would be less focused on growth versus value and more on alpha – looking for companies that can innovate, disrupt, enable and adapt.
2. Focus on margins. In the past cycle, investors paid for scarce growth and lower interest rates pushed higher-revenue companies towards record-high relative valuations. In the current environment, it is high and stable margins that are scarce and therefore more valuable.
3. Protect portfolios through diversification and hedging. There are risks to equities on the downside, mainly around recessionary risks. In the short term, Q2 macro data and the upcoming earning season will be particularly important data points for investors. Our economists put the risk of recession in the US over the next year at around 25-30%, compared with an unconditional average of 15%. Under a recession scenario the S&P 500 could fall to 3,600, or 22% below today’s level. Client conversations reveal a notable lack of conviction or enthusiasm for US equities at current valuation levels (P/E of 21x our 2022 EPS forecast of $221) given the slowing economy and rising rate environment. We would see more downside risks in many other markets.
Implied volatility in equities has fallen below realised volatility, making downside protection more attractive in our view. The VIX remains below 20 and S&P 500 puts look attractive as a hedge.

Speaking of volatility risk, equity investors are not seeing what bond investors do:
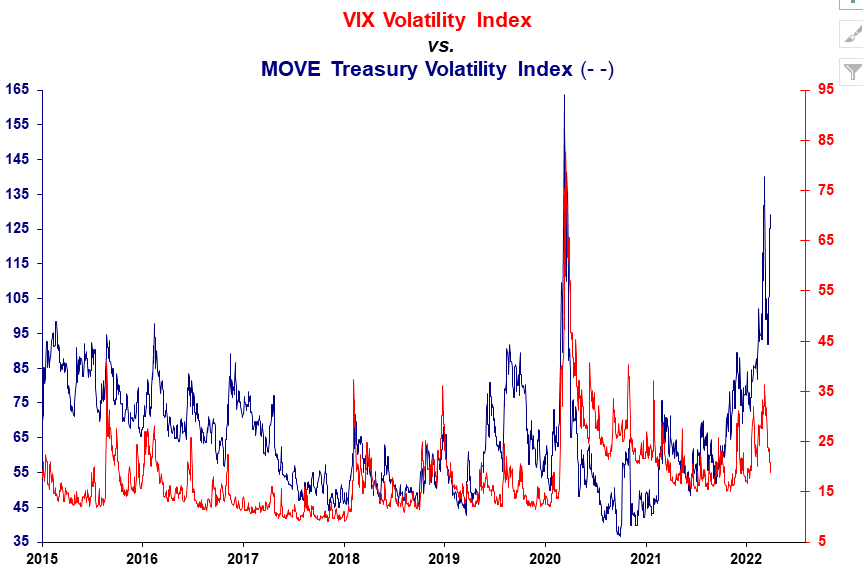
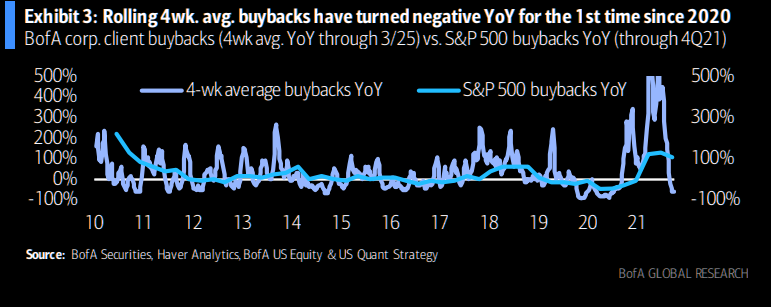
This buyer is taking a (long) pause
The buy back blackout period is kicking in. Note that a big majority of stocks are entering the black out period during the coming days. Forget the VWAP buyback bid for the coming month… (The Market Ear)

Russia Set for Steep Slump and Long Stagnation Russia’s invasion of Ukraine will cause their economies to contract this year by about 10% and 20%, respectively, the region’s leading development bank said in one of the most in-depth economic assessments to date of the war’s impact on the two countries.
The European Bank for Reconstruction and Development said the slump in Russia would likely turn into a long period of stagnation while neighboring economies would rebound next year as long as a sustainable cease-fire is secured over the coming months.
While Ukraine will suffer more in the short term because of the extensive damage to its physical infrastructure, Russia faces more long-term challenges from an exodus of well-educated workers and the loss of access to Western technologies under current sanctions, the bank said. (…)
Assuming that a cease-fire can be negotiated in the next two months, the EBRD expects Ukraine’s gross domestic product to contract by a fifth this year, compared with its previous estimate of 3.5% growth. The economy should then rebound and grow by 23% in 2023 if it receives reconstruction assistance.
“Even in the optimistic scenario of reconstruction going into full swing, it is still going to be a much poorer country simply because a lot of stock has been destroyed,” said Beata Javorcik, the EBRD’s chief economist. (…)
The EBRD expects those sanctions to contribute to a 10% contraction in the Russian economy this year, having previously anticipated growth of 3%. In contrast to its outlook for Ukraine, the bank doesn’t expect a rebound in 2023 and sees prospects beyond then remaining weak.
“There will be less investment, less international trade, less integration of Russia into global value chains, and this combined with people leaving Russia means lower long-term productivity growth,” said Ms. Javorcik.
The EBRD economist said that drag on growth would likely persist even if sanctions were lifted as part of a peace agreement.
“This effect, I would expect it to linger way beyond sanctions, if there’s no regime change,” she said. (…)
The EBRD estimates that money sent home by citizens working in Russia accounts for between 5% and 30% of annual economic output in Armenia, the Kyrgyz Republic, Tajikistan and Uzbekistan. Countries in the region rely on Russian banks for their connections to the global financial system, and much of their trade with other countries moves through Russia.
“They will need to reorient the flow of trade,” said Ms. Javorcik. “Not just because Russia will be poorer and buying less, but also to reach other markets.” (…)
U.S. Criticizes India on Russia Talks as Lavrov Visits Delhi
The U.S. and Australia criticized India for considering a Russian proposal that would undermine sanctions imposed by America and its allies, showing a deepening rift between the emerging security partners as Foreign Minister Sergei Lavrov traveled to Delhi for talks. (…)
India is the world’s largest buyer of Russian weapons, and has also sought to buy cheap oil as fuel prices surge. (…)
Bloomberg reported Wednesday that India is weighing a plan to make rupee-ruble-denominated payments using an alternative to SWIFT after the U.S. and European Union cut off seven Russian banks from using the Belgium-based cross-border payment system operator.
The Russian plan involves rupee-ruble-denominated payments using the country’s messaging system SPFS and central bank officials from Moscow are likely to visit next week to discuss the details. No final decision has been taken. (…)
India has pushed back against U.S. concerns by noting that it needs Russian arms to counter China, particularly after border clashes in 2020, and alternatives are too expensive. The strategic relationship between India and Russia dates back to the Cold War and remains robust, even as Modi has shifted the country more toward the U.S. orbit in recent years.


 SOME RALLY!
 (Bloomberg via