CONSUMER/RECESSION WATCH
CARTS: Chicago Fed Advance Retail Trade Summary
Thursday we get February’s consumer spending data. Here’s a preview of March:
In the second week of March, the Weekly Index of Retail Trade decreased 1.1% on a seasonally adjusted basis after decreasing 1.4% in the previous week. For the month of March, retail & food services sales excluding motor vehicles & parts (ex. auto) are projected to decrease 3.2% from February on a seasonally adjusted basis and to decrease 4.4% when adjusted for inflation.

On January 26, I showed that, from a real income viewpoint, the American consumer was in recession:

Now, if the Chicago Fed’s CARTS is right, the U.S retailing sector is technically in recession as real retail and food services sales ex-auto seem to be down 1.8% in Q1 after being down 2.9% in Q4’21.
A rather strange recession, however, with real retail sales (blue), while down since April 2021, remain 13.8% higher than in February 2020. A 4% setback in March would bring them up 9.4% from pre-pandemic levels.

Meanwhile, real expenditures on services (red) have stalled since last October, up less than 1.0% a.r., and 0.9% below their February 2020 level. To be updated Thursday.
The home buying market remains weak and disordered. The Pending Home Sales Index from the National Association of Realtors fell 4.1% in February (-5.4% y/y) following a 5.8% January fall, revised from -5.7%. It was the fourth consecutive monthly decline with sales down 18.0% from the August 2020 peak.
The Realtors Association indicated, “Pending transactions diminished in February mainly due to the low number of homes for sale. Buyer demand is still intense, but it’s as simple as ‘one cannot buy what is not for sale.'”
Pending home sales declined in most major regions of the country. Sales in the Midwest posted the largest decline, falling 6.0% during February (-5.2% y/y) to the lowest level since March 2021. In the West, sales fell 5.4% (-5.3% y/y) and were 21.5% below the August 2020 high. February sales in the South declined 4.4% (-4.3% y/y) to the lowest level since April 2020. Moving upward by 1.9% last month (-9.2% y/y) were sales in the Northeast. Pending home sales here, nevertheless, remained 24.0% below the August 2020 high.


- The share of prospective sellers surpassed that of homebuyers for the first time (Morning Consult)
The share of adults planning to sell their homes over the next 12 months rebounded to 14.1% in February, surpassing the share of adults planning to buy for the first time in Morning Consult tracking. Compared with the same month a year ago, there are more planned sellers and fewer potential buyers, possibly signaling an easing of supply pressures heading into the spring.

- Housing costs continue to climb, with renters bearing the brunt of spending growth (Morning Consult)
As housing prices continue to climb, renters report having increased spending over the past year by a wider margin than homeowners with mortgages. For renters hoping to buy homes, climbing rental costs will make it more difficult to accumulate savings for a down payment, adding yet another obstacle to homeownership on top of rising mortgage rates and low inventory.

Fed’s Williams: Fed Can Boost Rates By 50 Basis Points if Needed Federal Reserve Bank of New York leader John Williams said Friday that he is open to the central bank doing a half-percentage-point interest rate increase if the economy’s outlook calls for it, while stopping short of saying such an action is likely
(…) In her first speech since joining the bank’s governing council last summer, Ms. Kozicki said the central bank is “prepared to act forcefully” to bring high inflation under control. She also argued that Canadian households are better prepared to manage rising interest rates than they were during the last rate hike cycle in 2017 and 2018. (…)
“The reasons are straightforward: Inflation in Canada is too high, labour markets are tight and there is considerable momentum in demand,” Ms. Kozicki said. (…)
Financial instruments that track market expectations about rate hikes suggest the bank will raise its policy rate at each of its six remaining decision dates in 2022. That would move the policy rate above its prepandemic level of 1.75 per cent. (…)
Volkswagen Prepares for a Deglobalized World The car maker’s new resilience strategy includes shorter supply chains, less focus on China and more investment in the U.S.
(…) Oil is typically shipped around three weeks after a deal is struck, meaning that the drop in deal making in the early days of the war led to real disruptions in supply starting in the past week. The turmoil is being strongly felt in Europe, where prices for diesel, which powers cars, trucks and tractors, have soared.
Exports of Russian oil by sea fell to the lowest level in nearly eight months last week, according to data from Kpler. In the first two weeks following the invasion, these volumes remained strong as trades made before Russian troops crossed the border on Feb. 24 were delivered.
UBS estimates that around 2 million barrels a day, or about a fourth of the Russian output, has been disrupted. The International Energy Agency forecast that the level could reach 3 million by next month, warning of a potential spark in the worst energy-supply crisis in decades.
“Commodities tend to price in the now, not the future,” said Giovanni Staunovo, a commodity analyst at UBS. (…)
Traders said that Russian oil is no longer discussed at work or among friends in the industry. Some traders are under companywide bans on trading Russian grades, with compliance departments reluctant to leave it up to individual traders’ discretion. (…)
- U.S. Pledges More Natural Gas for Europe The U.S. is ramping up shipments of liquefied natural gas to Europe as the continent hunts for new supplies around the globe to phase out its reliance on Russian energy.
(…) The U.S. aims to ship 50 billion cubic meters of LNG to Europe annually through at least 2030, officials said Friday, making up for about a third of the gas the EU receives from Russia. The EU imported a record 22 billion cubic meters of LNG from the U.S. last year. (…)
Officials across the continent are racing to sign new contracts with producers in the Middle East and Africa before next winter; EU leaders on Friday also decided to band together when negotiating supply agreements, using the bloc’s collective economic weight to get lower prices. (…)
Italy, the second-largest consumer of Russian gas after Germany, is considering burning coal at some power plants rather than natural gas. (…) It would take Rome three years to fully replace Russian gas [with imports], the government said last week. (…)
U.S. and EU officials said they are aiming to boost U.S. exports to the 27-nation bloc this year by at least 15 billion cubic meters of LNG compared with 2021. The U.S. is already on pace to exceed that target by a wide margin for the entire year. (…)
The plan to end Europe’s consumption of Russian gas will take at least several years. Countries that produce LNG are running their export terminals at full capacity, and building new ones takes time. Shifting away from gas produced by Russia—the region’s low-cost producer—is expected to put upward pressure on Europe’s energy bill, at least in the short term, before new sources of renewable energy such as wind and solar come online. The European Commission, the EU’s executive arm, has said it wants to slash Russian gas imports by two-thirds this year.
The U.S. is the world’s largest natural-gas producer, and in January and December, it was the largest exporter of LNG. Nearly 70% of those LNG shipments went to the 27 nations of the EU, the U.K. and Turkey. (…)
The U.S. says its LNG export capacity will grow another 20% by the end of the year. The EU in January imported 4.4 billion cubic meters of LNG from the U.S., a record. But that is only a fraction of the 155 billion cubic meters of gas that Europe imported from Russia last year—45% of its total imports. (…)
Germany’s plans for new LNG terminals and options on the delivery from non-Russian suppliers should allow it to end Russian gas imports by 2024, German Economy Minister Robert Habeck said Friday. (…)
Poland, a large consumer of natural gas, plans to stop buying the fuel altogether from Russia at the end of this year. That is when its contract with Russian energy giant Gazprom expires. It will make up the difference with LNG imports from the U.S. and elsewhere, and gas through new pipelines from other European countries, including one from Norway that is set to come online later this year. (…)
When the oligarch owner of Severstal PAO was sanctioned by the European Union last month, the move immediately froze the steelmaker out of a third of its sales and set the scene for possibly the first debt default by a major Russian company since the invasion of Ukraine. (…)
On Wednesday, Europe’s third-largest steelmaker by output failed to make a payment on its debt—despite having funds available—after Citigroup Inc. C 0.57% froze interest payments to investors in the company’s bonds. Citigroup declined to comment on the move. Severstal hasn’t declared a default, nor have the bonds’ holders or credit-rating companies.
Severstal’s experience shows how Western sanctions are convulsing some of Russia’s largest and most internationally connected companies. (…)
The EU sanctions on Mr. Mordashov—along with similar measures later imposed by the U.K.—made it hard for banks to deal with any businesses he owns, including Severstal. (…)
Even wages being paid to Severstal employees in Russia pass through international hands. For instance, Austria’s Raiffeisen Bank International AG , which has said that it is considering leaving the country, handles some of the company’s payroll payments, a person familiar said. (…)
At Severstal, which has 52,000 workers, Mr. Mordashov has urged staff to keep calm. On March 3, he held an online town hall for around 900 employees, telling them they wouldn’t lose their jobs and would still get paid, according to an account of the meeting posted on the company’s Telegram account. (…)
Even getting steel out of Russia is now problematic because some nations have stopped their shipping companies from carrying Russian goods, and other businesses have voluntarily shunned them. (…)
In any case, finding new buyers might be hard given overcapacity in steel, underscoring the problems that Russian companies will face as they look for new markets outside of the West.
“Big Asian economies are net steel exporters, why would they take Russian steel?” said Wood Mackenzie’s Mr. Cachot.
China’s state-run Sinopec Group has suspended talks for a major petrochemical investment and a gas marketing venture in Russia, sources have told Reuters, heeding a government call for caution as sanctions mount over the invasion of Ukraine.
The move by Asia’s biggest oil refiner to hit the brakes on a potentially half-billion-dollar investment in a gas chemical plant and a venture to market Russian gas in China highlights the risks, even to Russia’s most important diplomatic partner, of unexpectedly heavy Western-led sanctions.
Beijing has repeatedly voiced opposition to the sanctions, insisting it will maintain normal economic and trade exchanges with Russia, and has refused to condemn Moscow’s actions in Ukraine or call them an invasion.
But behind the scenes, the government is wary of Chinese companies running afoul of sanctions – it is pressing companies to tread carefully with investments in Russia, its second-largest oil supplier and third-largest gas provider. (…)
China’s ministry of foreign affairs this month summoned officials from the three energy companies to review their business ties with Russian partners and local operations, two sources with knowledge of the meeting said. One said the ministry urged them not to make any rash moves buying Russian assets. (…)
Sinopec hit pause after realizing that Sibur minority shareholder and board member Gennady Timchenko faces sanctions from the West, the source said. The European Union and Britain last month imposed sanctions on Mr. Timchenko, a long-time ally of Vladimir Putin, and other billionaires with ties to the Russian President. (…)
The Amur project itself faces funding snags, said two of the sources, as sanctions threaten to choke financing from key lenders, including Russia’s state-controlled Sberbank and European credit agencies. (…)
Sinopec also suspended talks over the gas marketing venture with Russian gas producer Novatek over concerns that Sberbank, one of Novatek’s shareholders, is on the latest U.S. sanctions list, said one source with direct knowledge of the matter.
Mr. Timchenko resigned from Novatek’s board on Monday in the wake of the sanctions. (…)
(…) Surging coal use in China will displace imports of liquefied natural gas (LNG) used in power plants, freeing up hydrocarbons for the rest of the world.
China became the world’s biggest importer of seaborne gas last year: a key reason why gas prices were spiralling upwards even before the Kremlin began to manipulate supply. What it now does determines our fate in Europe.
Citigroup is telling clients that global gas prices could fall as fast as they rose, plummeting over the second half of this year as diverted LNG floods the world market. It has pencilled in European gas prices of $10 per Metric Million British Thermal Unit (MMBtu) or lower by the summer, down from a peak of $110 at the height of the winter crisis. (…)
“China’s desire to walk away from seaborne coal imports could pose major downside risks to global fossil fuel prices over the next few years,” he said. (…)
There is a further twist to this story. Citigroup thinks that Russia may accelerate the swing by dumping cheap gas in Europe at irresistible prices, undercutting LNG in a bid to secure long-term market share. With winter over, Russia no longer gains political leverage from withholding gas. The incentive has reversed: it is to knock out rivals from the US and Qatar.
This scenario assumes that Germany continues to block a meaningful energy embargo at the Nato-G7-EU summit this week, with tacit acquiescence from the rest of core Europe. The German Chancellor, Olaf Scholz, says time is needed to break dependence on the Kremlin.
“To do that from one day to the next would mean plunging our country and all of Europe into a recession. Hundreds of thousands of jobs would be at risk, entire industries would be on the brink,” he told the Bundestag. That does not sound like a man ready to budge.
A gas glut is not (yet) Citigroup’s base case but it is being presented as a serious possibility. (…)
China’s Politburo has long fretted over the country’s Achilles Heel: dependency on seaborne supplies of foreign energy (and grains). Chinese strategists have studied Franklin Roosevelt’s oil embargo against Japan in 1941, afraid that the US might use this weapon to constrict supplies of coal, crude and gas in a future crisis.
White House sanctions policy since the invasion of Ukraine has crystallised these fears in Beijing, although Xi Jinping had already ordered officials to secure imported fuel as a national emergency, and at any price, after a string of blackouts late last year.
He told the People’s Congress this month that energy security must take priority over the climate. “We can’t be detached from reality. We can’t throw away what is feeding us now, while what will feed us has yet to arrive,” he told a key gathering known as the “Two Sessions”. (…)
China produced 687m tonnes of coal in the first two months of this year, a 10pc rise from a year before. Caixin reports that closed coal plants in Gansu have been reopened. Five new coal-fired power plants with a capacity of 7.3 gigawatts were cleared for construction over the first six weeks to mid-February, following 33 gigawatts cleared last year.
Citigroup thinks China could increase coal output by 100m tonnes as soon as this year, and 300m tonnes thereafter. This would displace up to 107bn cubic metres (BCM) of gas, or the equivalent, enough to reverberate through the global LNG, gasoil, and electricity markets. This figure roughly matches China’s entire imports of LNG last year.
Mr Yuen expects a production “ramp-up” of by April or May, potentially setting off a crash in global coal prices a few weeks later. Natural gas prices would fall in sympathy, with crude prices settling back to $75 to $80 a barrel by the fourth quarter as utilities stop using oil in power plants. (…)
Citigroup forecasts a halving of European gas prices to $14 by the summer in its base case, and down to $4 by next winter if Russia then floods the market.
Is this likely? It is hard to judge, but it is certainly plausible. Should it happen, the UK energy’s price cap will return to normal levels, and analysts will soon be talking about plummeting inflation.
We could see an absolute fall in prices of traded goods, allowing relieved central banks to abandon plans for staccato rate rises. This would set off a violent unravelling of crowded “inflation trades” and a torrid reawakening of the “tech trade”. (…)
China already accounts for over half the world’s coal use, and a third of carbon emissions. If it now mines and burns an extra 300m tonnes a year over the early 2020s, it brings forward another upward lurch in carbon dioxide parts per million, with methane leakage to match.
We are close to the threshold of unpredictable feedback loops, if we have not passed several already. China may now push us over the brink whatever the rest of us do.
The awful concatenation of Vladimir Putin’s adventurism is getting worse with every week that passes.
Apple Inc (AAPL.O) is planning to cut the output of its iPhone and AirPods devices as the Ukraine crisis and looming inflation start to weigh on demand for consumer electronics, the Nikkei reported on Monday, citing sources.
The company plans to make about 20% fewer iPhone SEs next quarter, or lower production orders by about 2 million to 3 million units than originally planned, due to weaker-than-expected demand, Nikkei said.
The U.S. tech giant also reduced orders for its AirPods wireless headphones by more than 10 million units for all of 2022, as it scales back the level of inventories due to lukewarm demand, the newspaper said. (…)
EARNINGS WATCH
Q1’22 is almost over. Recall that January was a strong month for retail sales and that February and March look much softer. The war in Ukraine began on February 24. It is not surprising that the quarter was a tale of two halves, a good first half and a weaker second half.
Corporate guidance reflects that trend. The first 78 S&P 500 pre-announcements were 52 down and 22 up (4 unchanged), a 2.36 N/P ratio, already worse than the 1.7 N/P ratio in Q4’21.
But the last 25 pre-announcements were decidedly bad: 20 down, 4 up, a 5.0 N/P ratio.

Yet, analysts don’t seem to mind with Q1 estimates still up 6.4%, unchanged since mid-February:


The aggregate masks an interesting sectorial dynamic however: downward revisions are concentrated in market darlings, offset by upward revisions in inflation sensitive sectors:

Smaller caps estimates continue to be shaved…

…with industrials and real estate joining the ranks of negatively revised sectors:

In fact, profits of S&P 500 companies ex-Energy are now seen increasing only 1.1% in Q2’22 and 2.5% in Q3, down from +2.2% and +3.3% respectively in mid-February and +3.6% and +3.1% in mid-January.
Trailing EPS are now $209.37. Full year 2022: $227.30.
The Rule of 20 Fair Value (yellow line) peaked at 3118 last October and is down 9.4% to 2826, essentially due to rising inflation which offset a 7.5% gain in trailing EPS.

FYI, the correlation between the S&P 500 Index and the R20 Fair Value is 0.97 since 1952, 0.90 since 2000 and 0.91 since 2009. The S&P 500 index is now trading at the same premium to FV as at the peak of the dot.com bubble.

For the S&P to return to the R20 Fair Value, which it always does, earnings would need to reach $250 with inflation at 2.0%. If inflation stays at 3.0%, earnings would need to be at $265. Or the index would need to decline, or a combo thereof.
Recall that the R20 FV is ((20 – core inflation) x trailing EPS).
(…) Private nonresidential business investment grew 7.4% in 2021 from the previous year after adjusting for inflation, the fastest pace since 2012 and a strong bounceback from the 5.3% decline in 2020.
Spending for software and information-processing equipment such as computers rose 14% in 2021 from the previous year. (…)
Manufacturing firms surveyed by the Institute for Supply Management plan to raise capital expenditures by 7.7% in nominal terms in 2022. Service firms expect a 10.3% increase. (…)
Productivity, which measures workers’ output per hour worked, grew an average 2.2% a year in 2020 and 2021, up from a 0.9% average between 2011 and 2019, before the pandemic. (…)
About three-quarters of retail executives surveyed by Morgan Stanley last year said they intend to increase spending on information technology, up from 21% in 2019. (…)
Walmart Inc., the country’s largest employer, announced last year it would bring robots to 25 of its 42 regional distribution centers at a time when retailers nationwide have had trouble staffing warehouses. (…)
Even in normal times, productivity is difficult to capture accurately. (…)
Robert Gordon, a Northwestern University economist, sees reasons to be both optimistic and pessimistic about future productivity growth. On the one hand, the increase in business spending suggests “more automation and productivity-enhancing replacement of workers by machines,” he said in an email.
On the other, Mr. Gordon’s research suggests that much of the recent rise in productivity comes from industries such as finance or professional services, where a significant number of employees have been working remotely.
“To the extent that this shift from office to at-home work is temporary, so is the productivity-growth revival,” he said.
Let’s hope productivity growth helps us offset rising wages. Productivity always jumps after recessions and this time is no exception. But it did not jump as much as it normally does and the last 6-month measure is not encouraging.

TECHNICALS WATCH
My favorite technical analysis firm remains cautious seeing continued domination of selling over buying and a lack of breadth and intensity in many of its key measures.
Other key technical indicators are supplied by CMG Wealth’s Steve Blumenthal:
- With the Fed’s first few tightening moves behind us and Powell’s signaling of aggressive tightening ahead, now is a good time to recall how past Fed tightening cycles ended:

- S&P 500 Large Cap Index – 13/34–Week EMA Trend Chart:

- Volume Demand vs. Volume Supply:

Here are all Steve’s signals:
Equity Trade Signals
- NDR CMG U.S. Large Cap Long/Flat Index: Buy Signal – Intermediate-term Bullish for Equities
- Long-term Trend (13/34-Week EMA) on the S&P 500 Index: Sell Signal – Bearish for Equities
- Volume Demand (buyers) vs. Volume Supply (sellers): Sell Signal – Bearish for Equities
- S&P 500 Index Monthly MACD: Sell Signal – Bearish for Equities
- S&P 500 Index Daily MACD Indicator: Buy Signal – Short-term Bullish for U.S. Large Cap Equities
- Don’t Fight the Tape or the Fed: Indicator Reading: -1 (Bearish Signal for Equities)
- S&P 500 Index 200-day Moving Average Trend: Buy Signal (Nearing Sell)
- S&P 500 Index 50-day vs. 200-day Moving Average Cross: Sell Signal – Bearish for US Large Cap Equities
- NASDAQ Index 200-day Moving Average Trend: Buy Signal (Nearing Sell)
- Value vs. Growth Factor Model: Favors Value over Growth
Fixed Income Trade Signals
- CMG Managed High Yield Bond Program: Sell Signal – Bearish High Yield Corporate Bond Trend
- Zweig Bond Model: Buy Signal – Bullish on High Grade Corporate and Long-Term Treasury Bonds
- 10-Year Treasury Weekly MACD: Sell Signal – Rising Rates: Bearish on Bonds
- Extended Duration Treasury ETF: Sell Signal – Rising Rates: Bearish on Bonds
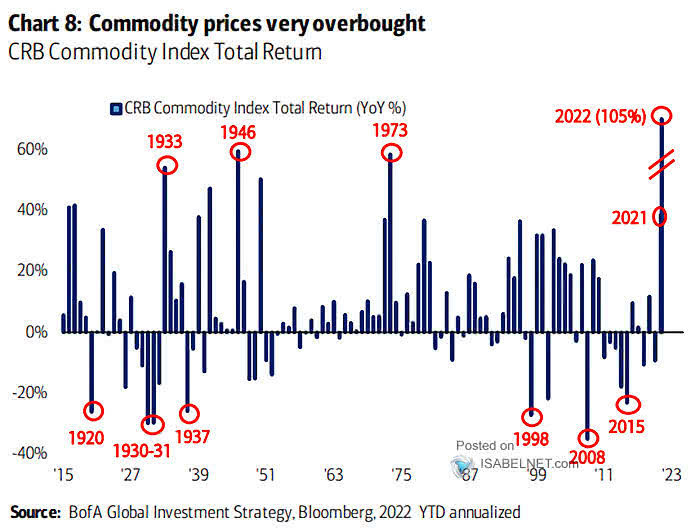
Inflation/commodities sensitive equities have outperformed in the past year and particularly in recent weeks. This is via Callum Thomas:
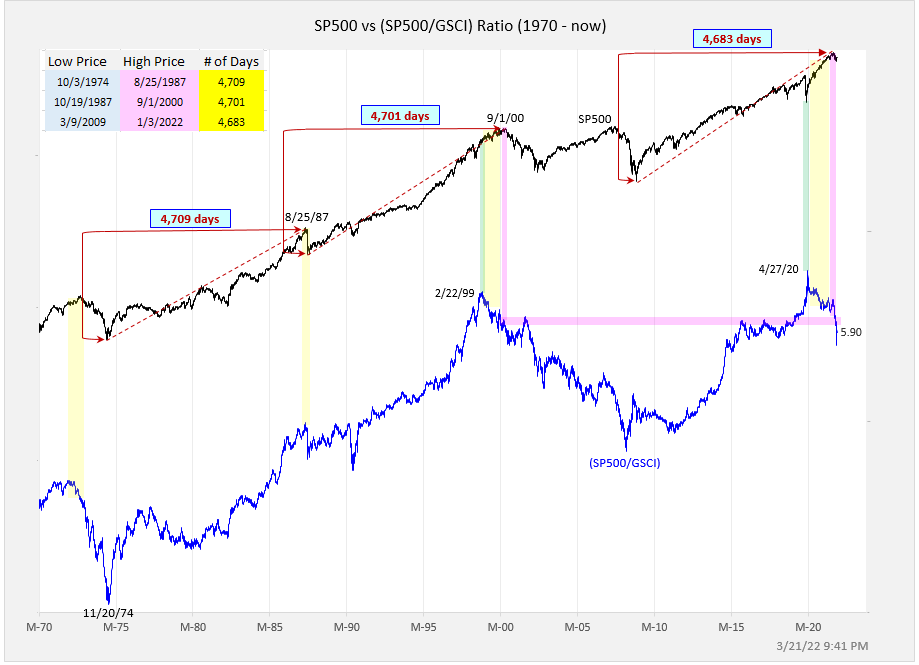
- Stocks vs Commodities: Inflation is an equity killer.
Peaks in the S&P500 vs Commodities index ratio have served well in flagging major market tops for stocks. (inflation (where commodities are a key proxy/driver) places pressure on margins, consumers, and drives central bankers to tighten policy)
@exposurerisk
Isabelnet
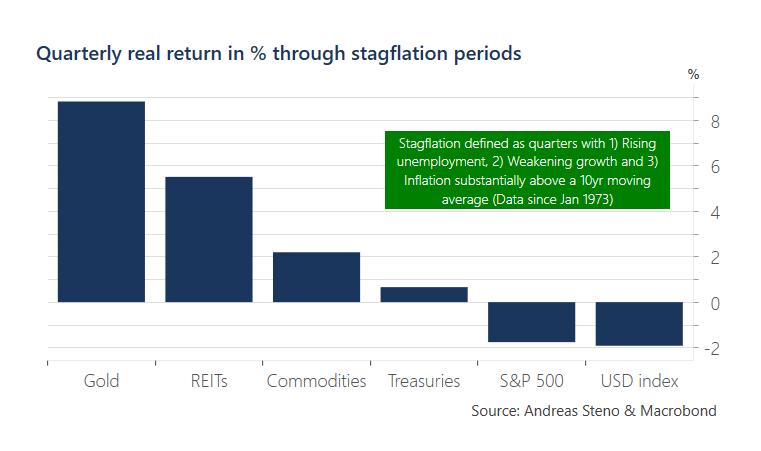
- Living with Stagflation: So you’ve decided to move on with your life and just “live with stagflation”. Here’s what history says about where to allocate… (n.b. past performance does not necessarily = future, etc)
@AndreasSteno
SENTIMENT WATCH
How contrarian do you feel?
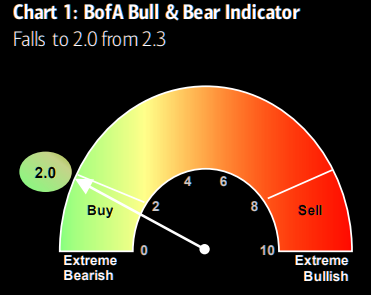
BofA’s relatively slow bull and bear indicator has just entered buy signal area for the first time since March 18 2020 (cash up is the main reason). According to the inv bank there have been 8 contrarian buy signals since 2013. 12 weeks after the signal global equities have risen by 8%. Let’s see how this plays out as SPX is basically up some 8-9% since recent lows. Note that BofA is fundamentally bearish and see: “SPX <4000 not>5000 in 2022”. (The Market Ear)
- Goldman Sachs’ indicator:

I checked for you:
- March 09: P/E:12.7, R20 P/E: 14.4
- October 11: P/E: 15.0, R20 P/E: 15.6
- February 16: P/E: 16.5, R20 P/E: 18.8
- December 18: P/E: 14.6, R20 P/E: 16.9
- March 20: P/E: 13.9, R20 P/E: 16.2
- Current: P/E: 21.7, R20 P/E: 28.2
Depressed sentiment is not what it used to be, is it?
Even less so when looking at record high equity ownership, record low fixed income exposure. Depressed, but not selling. TINA!

GS (my emphasis):
In an unusual development, during the last two weeks long duration stocks have rallied in the face of rising rates and a more hawkish Fed. Retail trading activity and short covering helps to explain this dynamic. Nominal 10-year yields have risen by 29 bp since last week’s FOMC rate hike. Real rates are also fast approaching positive territory.
Despite this, many typically rate-sensitive stocks have soared since March 14th, including Non-Profitable Tech (+34%) and our sector-neutral Long Duration basket (+21%). A basket of the Russell 3000 stocks that have the highest levels of short interest has risen 19% led by some of its fastest growth constituents (e.g., LMND, BYND, NKLA).
At the same time, retail activity appears to have increased, as our basket of retail favorites has surged by 18%. GME, the prototypical meme retail stock, has soared 82% since March 14th and is now up 2% YTD.
In contrast to institutions, households have been actively buying the dip. During the median 10% S&P 500 drawdown since 2002, $10 billion typically flowed out of US equity funds during the 12 weeks following the market peak. However, the current sell-off stands in contrast: $93 billion of capital has flowed into US equity funds since the start of the year, suggesting that households have continued to buy after the record year for US equity inflows in 2021 (+$243 billion).
(…) Household demand for equities is typically weakest when GDP slows, inflation accelerates, or interest rates rise. A combination of these has proven especially challenging: Equity allocations fell during the stagflation of the late 1960s to early 1980s as well as during the early 2000s. (…)
According to the Z.1, US households hold $15 trillion in cash assets, $4 trillion greater than their pre-pandemic holdings. Some cash is likely to be used to absorb the increased cost of living associated with high inflation. Importantly, more than half of this cash is held by the top 10% of the wealth distribution, which should be less affected by higher inflation and is more likely to deploy cash into equities. (…)
Corporations will be the largest source of equity demand in 2022. We recently raised our 2022 forecast for gross buybacks to $1 trillion (from $872 bn). Buyback authorizations YTD are on pace to exceed the record $1.2 trillion level set in 2021. High cash balances and solid EPS growth will support robust corporate demand this year. We expect shrinking cash M&A will be partially offset by slowing issuance. We forecast net corporate equity demand of $700 billion in 2022, an all-time high level.

BTW:
- Russian men have also told The Telegraph that military recruitment centres in Russia have started to make contact with them ahead of a possible mass mobilisation of forces.


