The enemy of knowledge is not ignorance, it’s the illusion of knowledge (Stephen Hawking)

It ain’t what you don’t know that gets you into trouble. It’s what you know for sure that just ain’t so (Mark Twain)

Invest with smart knowledge and objective odds

THE DAILY EDGE: 25 FEBRUARY 2022

Household Pulse: The State of Cash Balances at Year End

About the “excess savings” buffer: From JP Morgan Chase’s database covering 7.5M families.

Low-income families saw rapidly depleting balance gains following the last round of stimulus. While balances in March 2021 were roughly 120 percent higher than two years before, balances at the end of 2021 were about 65 percent higher than 2019 levels, or just under $1,300. Although higher-income families also saw depletions in checking account balances since the last stimulus, trends relative to 2019 stayed stable, remaining roughly 30-35 percent elevated through the end of 2021. Thus, even among higher income families, cash balances remain elevated over and above secular pre-pandemic trends of roughly 7-11 percent per year.

Pulse plots figure 1

At the end of 2021, balances among low-income families were still 70% higher (~+$560) than their 2019 levels. Higher-income families had balances 35% higher or ~$1700.

Pulse Plots figure 2

JPM Chase notes that

The charts do not account for the secular upwards trend of liquid balances prior to the pandemic. JPMorgan Chase Institute research shows that during normal times, checking account balances grew by roughly 11 percent per year among balanced samples of households comparable to the one used here. In this sample, cash balances in the first two months of 2020 had grown by roughly 7 percent on a year-over-year basis. Thus, 2021 cash balances could have been up by 14-23 percent compared to 2019 levels due to these trends, independent of the pandemic and corresponding government interventions.

Using 18.5% (the mid-point of the 14-23% normal growth), end of 2021 cash balances were 16.5% and 51.5% above normal for low and high income families respectively. Inflation took 6% off purchasing power since, leaving between $365 and $510 in “excess” real savings for the average family.

U.S. New Home Sales Fell in January

New single-family home sales fell 4.5% m/m (-19.3% y/y) to 801,000 at an annual rate in January with upward revisions to sales in both November and December. Sales in December were revised up to 839,000 from 811,000 previously, and sales in November were revised up to 749,000 from 725,000 previously. The most recent peak in sales was 993,000 in January 2021. The Action Economics Forecast Survey expected 809,000 sales in January.

By region, sales in December fell in three of the four major regions, rising only in the West (1.2% m/m for the third consecutive monthly gain). Sales in the Northeast slumped 10.7% m/m, their third consecutive monthly decline to the lowest level since April 2020. Sales in the Midwest declined 3.7% m/m in January after an outsized 39.7% m/m jump in December. Sales in the South decreased 7.4% m/m in January, their first decline in three months.

The median price of a new home rebounded in January, rising 7.0% m/m (+13.4% y/y), reversing a 7.0% m/m decline in December. The average sales price of a new home rose 3.0% m/m (+18.7% y/y) in January to a record high $496,900. These sales price data are not seasonally adjusted.

The supply of new homes for sale rose to 6.1 months in January from 5.6 months in December. The recent low was 3.5 months reached in August, September and October of 2020. The median number of months a new home stayed on the market fell to 2.5 months, tying the record low reached in October, from 3.3 months in December. These figures date back to January 1975.

image

There are 2 distinct housing markets: the rising South and West and the weak Midwest and Northeast. I grouped them below:

fredgraph - 2022-02-25T071520.435

CalculatedRisk’s Bill McBride adds:

The inventory of completed homes for sale was at 37 thousand in January, up from the record low of 33 thousand in March through July 2021. That is about 0.6 months of completed supply (red line). This is about half the normal level.

The inventory of new homes under construction is at 3.9 months (blue line) – well above the normal level. This elevated level of homes under construction is due to supply chain constraints.

And 106 thousand homes have not been started – about 1.6 months of supply (grey line) – almost double the normal level. Homebuilders are probably waiting to start some homes until they have a firmer grasp on prices.

Fed Officials Signal March Rate Hike on Track Despite Ukraine Central bankers stressed the need to confront the hottest U.S. inflation in 40 years.

(…) “We constantly say we have the tools to fight inflation, and now we must demonstrate the will to use them,” Mr. Waller said in remarks at the University of California, Santa Barbara, on Thursday evening. Inflation “is far too high and needs to come down,” he said. (…)

Mr. Waller said he would prefer to raise short-term interest rates by 1 percentage point by the middle of the year. Mr. Waller echoed another member of the rate-setting Federal Open Market Committee, St. Louis Fed President James Bullard, who has advocated a similar approach. That would likely require the Fed to raise rates by at least a half-percentage point at one of its meetings in March, May and June. (…)

Several other Fed officials, including the two members of Fed Chairman Jerome Powell’s policy-making inner circle, have recently spoken in favor of an increase of a quarter-percentage point. Those officials, New York Fed President John Williams and Fed governor Lael Brainard, have pointed to how borrowing costs for households and businesses have already risen in ways that anticipate a series of Fed rate increases this year. (…)

Earlier on Thursday, two other officials who are set to vote on monetary policy at the Fed’s March meeting—Philadelphia Fed President Patrick Harker and Cleveland Fed President Loretta Mester —signaled they favored a quarter-point increase. (…)

Russia’s invasion of Ukraine creates a new wrench in the gears of the global economy that will simultaneously worsen inflation pressures and damage growth prospects. That makes it a stagflationary shock, essentially making things worse on all economic fronts at once. (…)

  • It’s not the kind of economic disruption that can be fixed with clever use of fiscal or monetary policy. It’s all pain, no gain. The effects are likely to be most severe in Europe, where economic ties with Russia and Ukraine are deepest.
  • But through the deeply interconnected global financial and commodity markets, the ripples are set to spread worldwide. (…)

What we do know is that there will be continued and escalating financial sanctions on Russia, damage to Ukraine’s export industries, and high risk of further ripple effects from both physical and cyber-attacks.

  • All of those amount to a negative supply shock — meaning that the productive capacity of the world economy is simply lower than it was a few weeks ago.

Higher energy prices — already evident in commodity markets — directly feed into higher inflation, but the risks are more sprawling and hard-to-calculate than that implies.

  • The risk of disruption to Western European energy supplies and transportation networks, and the potential for cyber attacks contributes to the strain on global supply networks that have already been at their breaking point.

In European countries with close economic ties to Ukraine and Russia, the disruption could lower appetite for business investment and consumer demand. Who wants to build a new factory in Romania when warfare is taking place just down the road?

The United States is relatively insulated from the immediate economic damage, with its location an ocean away, strong domestic energy production, and robust (maybe too-robust) consumer demand.

  • For the U.S., the direct impacts of the conflict are likely to push already-too-high inflation even higher. Those effects should on their own be short-lived, but the timing means they risk further entrenching Americans’ rising inflation expectations.
  • Still, the Federal Reserve is likely to view the crisis as reason to move more gingerly in its monetary tightening campaign, as economic uncertainty grows, based on comments from several Fed officials this week.

The bottom line: Usually, geopolitical strife represents a short-term blip for financial markets and a buying opportunity for the gutsy. That could yet be the case with Ukraine, but the range of possibilities is ominous.

People Think Putin Has Called This Right and Will Get What He Wants

John Authers: I’m afraid I think this is the single best explanation [for yesterday’s rally]. The argument goes as follows:

  1. It looks as though the Russian forces are making their way with relative ease so far;
  2. The war aim seems to be decapitation of the regime, and installation of a Russian puppet. We can live with that; Ukraine has been run by Russian puppets before, and the world didn’t end;
  3. The natural gas price dooms any chance of a strong European response.

The Telegraph’s Ambrose Evans-Pritchard:

(…) We wake up to the sobering reality that Russia is too pivotal for the international trading system to punish in any meaningful way. It influences or determines everything from bread in the shops, to gas for Europe’s homes and power plants, to supply chains for aerospace and car plants, or soon will do if Kyiv falls. (…)

Ukraine turns Putin’s neo-Tsarist empire into the Saudi Arabia of food, controlling 30pc of global wheat exports and 20pc of corn exports. (…)

So while there is brave and condign talk of crippling sanctions against Russia, it is the West’s pain threshold that is about to be tested. My presumption is that Fortress Russia will endure this contest of self-reliance more stoically than Europe’s skittish elites. (…)

Russia is sitting on $635bn of foreign exchange reserves. It has a national debt of 18pc of GDP, one of the lowest in the world. It has a fiscal surplus and does not rely heavily on foreign investors to finance the state. This renders US sanctions against new issuance of sovereign bonds a mere nuisance. (…)

The West must fall back to the next line of defence, the Nato line from Estonia to Romania, and face the long arduous task of military rearmament. (…)

Holcim Plans Multiple Price Hikes to Combat Energy Costs Energy costs account for about 10% of operating costs, and high prices already prompted the Swiss cement producer to make a number of adjustments last year

Large, Late Merchandise Orders Are Raising Companies’ Inventory Costs Transit delays are stranding billions of dollars in goods in congested supply chains, leaving companies in a cash crunch

(…) A measure of inventory costs in the Logistics Managers Index, a monthly assessment issued by Arizona State University in collaboration with other university supply-chain programs, has increased sharply since 2020, reaching a peak of 89.4 in June 2021 that was nearly 26 points higher than the same month the year before. The measure of inventory costs was 84 in December compared with 63.4 in December 2019, before the impact of the Covid-19 pandemic buffeted supply chains. (…)

Flexport said in its Ocean Timeliness Indicator report for the week ended Monday that it took an average of 109 days to deliver a container from China to its final destination point in the U.S., up from between 40 and 60 days pre-pandemic. (…)

The cash bind is particularly severe for smaller firms.

For companies with $10 million to $50 million in revenue, average inventory grew to 103 days’ worth in the second quarter of 2021 from 64 days at the end of 2019, the latest period for which data was available, according to RapidRatings International Inc., which analyzes businesses’ financial health. Companies with over $100 million in revenue kept 81 days of inventory in the second quarter of 2021, about the same level as at the end of 2019. (…)

Goldman Ups Euro-Area Inflation Forecast on Ukraine Invasion The bank raised its inflation forecast to 6.5% in May, before slowing to 5.4% by the end of the year.
China’s Economy Stabilizes With Uncertain Growth Outlook That’s the outlook from Bloomberg’s aggregate index of eight early indicators for this month. While the overall gauge was unchanged, several underlying measures worsened, suggesting an uncertain growth outlook that may require more fiscal and central bank support in coming months.
SPAC Startups Made Lofty Promises They Can’t Keep The hot upstarts that went public via blank-check companies are missing revenue and earnings targets—sometimes months after making those forecasts.

THE DAILY EDGE: 24 FEBRUARY 2022

Russian Invasion Scrambles Prospects for Global Economy Financial markets reacted swiftly to the invasion, with stock markets dropping sharply and commodity prices soaring

(…) Extensive fighting and sanctions that disrupted Russia’s energy exports would have an outsize impact on the European economy, given its heavy dependence on Russian gas. Some European banks and businesses also have extensive ties with Russia. (…)

Russia and Ukraine together make up a small slice of the world economy and represent only a minor destination of exports for Europe or the U.S. However, Russia is a major supplier of oil, natural gas and other commodities. It pumps about 10% of the world’s oil. In turn, the EU relies on Russia for nearly half of its natural gas imports and almost a quarter its oil imports.

Meanwhile, Ukraine and Russia combined account for nearly 30% of global wheat exports, according to the U.S. Department of Agriculture. The nearby Black Sea serves as a major conduit for international grain shipments from Ukraine and the country is also among the top exporters of barley, corn and rapeseed. (…)

Russia’s MC Norilsk Nickel PJSC is the world’s largest producer of palladium, responsible for between 25% and 30% of total output. The automobile industry, which is struggling with a shortage of semiconductors, could face additional problems if Russia’s supply of palladium were to slow. Platinum, however, can be used as an alternative, and South Africa is by far the world’s largest supplier of that metal.

Russia is also a big producer of the key ingredients for fertilizers such as urea and potash. Disruptions in those supplies could drive food prices, which are already at multiyear highs, up further. (…)

  • Fossil fuels — oil, as well as coal and natural gas — provide more than 80% of the global economy’s energy. And the cost of a typical basket of them is now up more than 50% from a year ago, according to Gavekal Research Ltd., a consultancy. (Bloomberg)
  • “the war has limited impact on global trade, because apart from oil and natural gas, Russia doesn’t have supply chains that can impact the world, which is different from China.” (Reuters)
  • “This puts central banks in a really tricky situation. A March hike from the Fed is being priced out (and) the number of Fed hikes this year being lowered because …it feels like it’s the wrong time to start taking liquidity out of markets. “Central banks may have to look through an inflation spike though that means ultimately rate hikes could become substantially bigger. I’d say medium term inflation risks have increased substantially…” (Reuters)

Weekly Gas Prices Since 2000

Goldman Sachs:

Historically, Fed officials have sometimes preferred to delay major policy decisions until uncertainty surrounding geopolitical risks diminished. (…) The current situation is different from past episodes when geopolitical events led the Fed to delay tightening or ease because inflation risk has created a stronger and more urgent reason for the Fed to tighten today than existed in past episodes. With some signs of problematic wage-price dynamics emerging and near-term inflation expectations already high, further increases in commodity prices might be more worrisome than usual. As a result, we do not expect geopolitical risk to stop the FOMC from hiking steadily by 25bp at its upcoming meetings, though we do think that geopolitical uncertainty further lowers the odds of a 50bp hike in March.

But pre-opening today (4100), the S&P 500 is down 14.6% from its January high. Where is the Powel put if there is one?

Michael Batnick (The Irrelevant Investor) tells us that since 1950, the S&P 500 has declined 10% from its highs 25 times, 7 times by 20-30% and 5 times by more than 30%.

At 4100, the S&P 500 is 7.8% below its 200-day m.a.. Since 2010, it got below 10% only 3 times as Ed Yardeni illustrates.

image

But every time the index traversed its 200dma, it bottomed after the Rule of 20 P/E, currently 24.2, got below 20.0. That would be below 3155 at current earnings and inflation levels. I bet we get the Powell put before we get there.

image

Devil Vladimir Putin said nations “will face consequences greater than any you have faced in history” if they interfere in his invasion of Ukraine. This is a rare overt threat of nuclear attack. (Axios)
Assessing the risk of a correction turning into a bear market

(…) The chart below shows the S&P 500’s median price path once it fell into a correction, separated by those that turned into bear markets (black line) and those that did not (blue line).

Both groups tended to see a short-term bounce lasting 1-2 weeks. After that, the bear market corrections fell apart and quickly plumbed lower lows. The non-bear-market corrections only saw some choppiness then went on to recover further in the weeks ahead.

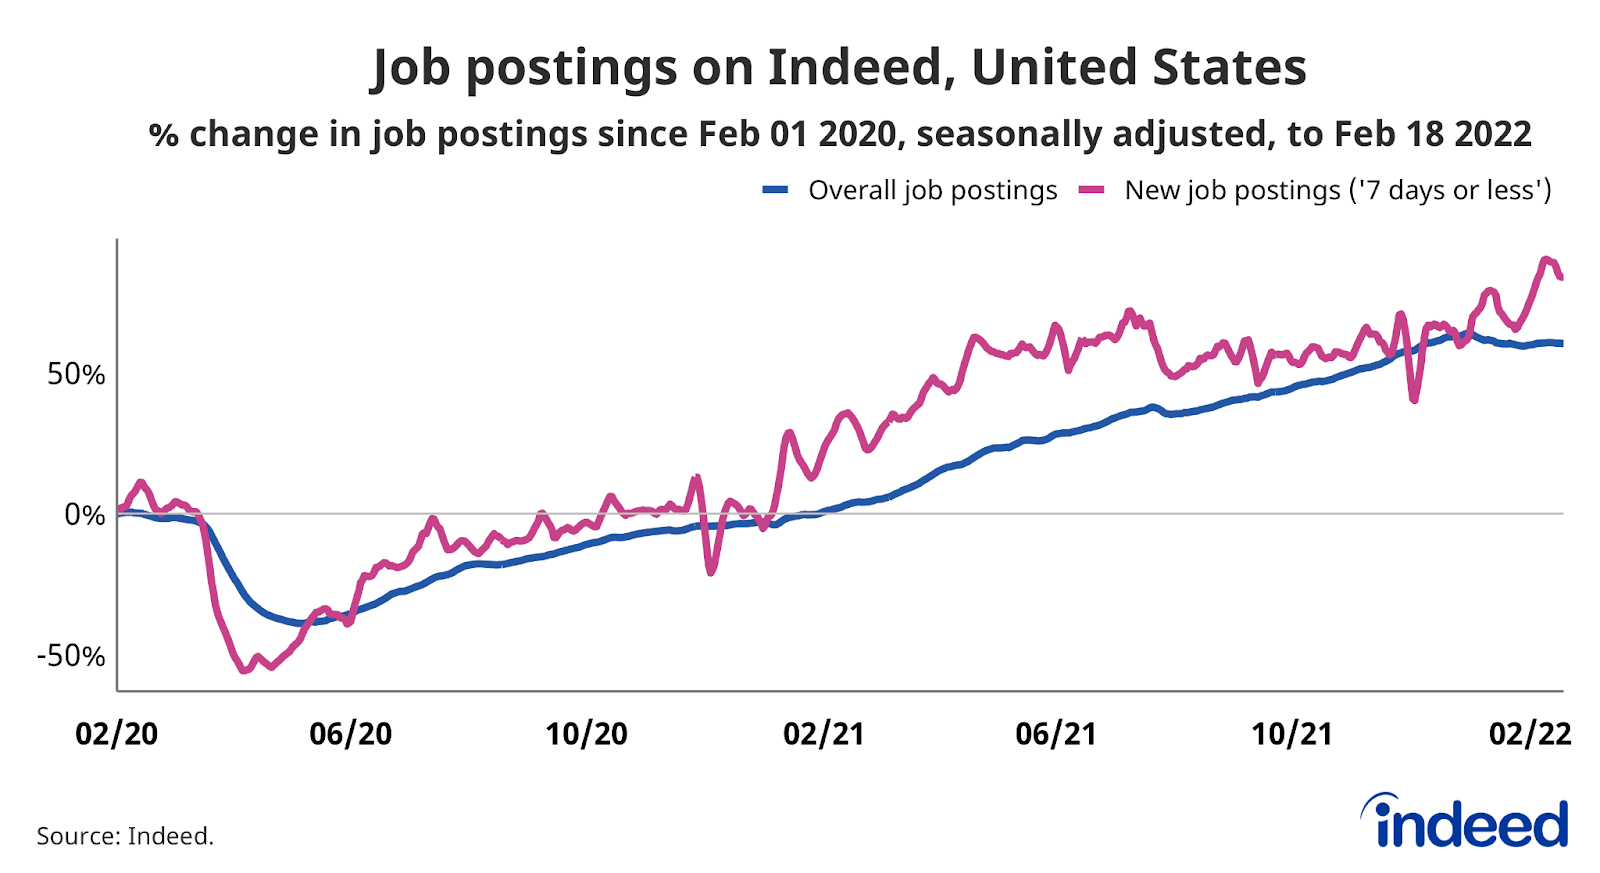
Indeed US Job Postings Tracker: Data Through February 18 Job postings have yet to substantially rebound post-omicron surge.

It seems like the worst of the omicron surge’s impact might have passed. New job postings (those on Indeed for seven days or less) are well above pre-pandemic baseline, up 83.9% as of February 18. (…)Line graph titled “Job postings on Indeed, United States.”

Unretirements are picking up!

Reproduced from Indeed; Chart: Axios Visuals

Some Companies Ditch Annual Raises and Review Worker Pay More Often The demand for U.S. workers has led some manufacturers, technology firms and other employers to ditch the annual raise and switch to more frequent pay reviews as they compete for talent and keep pace with rising wages.

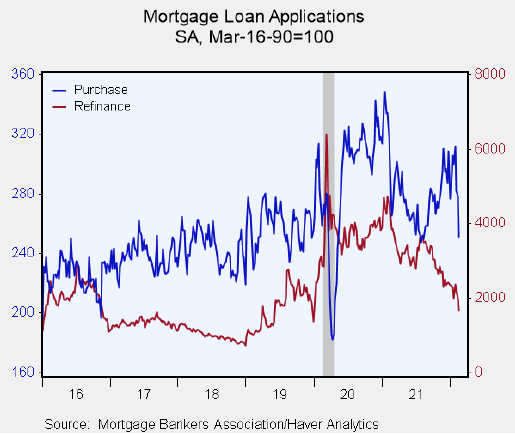
U.S. Mortgage Applications Continue to Fall As Rates Rise

Mortgage rates rose from 2.7% to 4.0% in one year, boosting monthly mortgage payments by 18%. But house prices are also up 18% in the last year. Payments at 2.7% on what was a $300k house are up nearly 40% (+$473/m) on the same $354k house at 4%. An impossible dream for all but the wealthiest.

 image image

CalculatedRisk’s Bill McBride computes his own affordability measure

I used median income from the Census Bureau (estimated 2021), assumed a 15% down payment, and used a 2% estimate for property taxes, insurance and maintenance. (…) For house prices, I used the Case-Shiller National Index, Seasonally Adjusted (SA). Also, for the down payment – there wasn’t a significant difference between 15% and 20%. For mortgage rates, I used the Freddie Mac PMMS (30-year fixed rates).

So here is what the index looks like (lower is more affordable like the FirstAm index):

Bill notes that “in December, the average 30-year mortgage rates were around 3.1%, and currently mortgage rates are close to 4.12% – so we already know the “Affordability Price Index” will increase sharply over the next couple of months (meaning houses are less affordable) – and will be the least affordable since the housing bubble / bust.”

Rent? This price-to-rent chart also from CalculatedRisk uses the OFHEO house price index and the Owners’ Equivalent Rent (OER) from the BLS. “Note that OER is lagging behind other measures of recent rent increases.”

Americans are in a housing crisis. Add 7.5% foodflation and 30% energyflation and you get a huge squeeze on most household budgets. Disposable income is up 5.6% YoY but has increased only 4.6% annualized in the last 3 months.

Lowe’s Profitability Improves Despite Dimming Sales Outlook The home-improvement retailer’s management of costs and pricing impresses investors.

(…) Looking ahead, Lowe’s said it expects that on a comparable basis, sales in 2022 will register between a 1% decline and a 1% improvement from 2021’s levels [+5%]. The company forecast that profit will grow by approximately 8% to 13%. (…)

Fast-Spreading Type of Omicron Revives Reopening Concerns A more infectious type of the Omicron variant has surged to account for more than a third of global Covid-19 cases sequenced recently, adding to the debate about whether countries are ready for full reopening.

(…) Evidence so far suggests BA.2 is some 30% more infectious than its cousin, the BA.1 subvariant that kicked off the Omicron wave in southern Africa in November 2021. In South Africa, BA.2 has accounted for 82% of cases so far in February, according to health authorities in that country.

Overall, BA.2 accounted for 35% of Covid-19 virus samples whose genomes were recently submitted to the global Gisaid database, according to a Gisaid update released Tuesday.

Studies so far suggest that both types of Omicron pose about the same risk of severe disease in humans. That risk is lower than last year’s Delta variant, but with so many people getting infected, the death toll from Omicron is still high. (…)

Early studies suggest that vaccines and booster shots work equally well in both Omicron types in preventing serious illness. (…)

Prof. Sato said the current co-circulation of BA.1 and BA.2 could spawn a hybrid virus that would “more easily increase and be more harmful.” (…)

From Katelyn Jetelina:

  1. Transmissibility. We now have consistent data showing that BA.2 outcompetes BA.1. A recent study found the global reproductive rate of BA.2 was R(t)= 1.4 compared to BA.1, which had a R(t)=1.1. In England, secondary attack rates in U.K. households are also higher: 13.4% of BA.2 cases transmitted within their households vs 10.3% of BA.1. Together, this means that BA.2 will become the dominant variant worldwide very soon.

  2. Immunity escape. In a recent lab study, immune escape was similar for BA.2 compared to BA.1. In the real world, we have evidence that boosters continue to work against BA.2, but just like BA.1, protection against infection wanes over time (see Table below). A study of Denmark households found that vaccination helped protect against transmission more for BA.2 than BA.1. So, vaccines continue to work against BA.2. This is not surprising but sure is great news.

    UK Health Security Report Source Here

    What about infection-induced immunity? A recent preprint from Denmark found that BA.2 reinfections after BA.1 infection were rare, but much more common among unvaccinated compared to vaccinated: of the 47 reinfections, 89% were not vaccinated and 6% had only the two-dose series.

  3. Severity. We’ve gotten mixed signals as to whether BA.2 induces more severe disease than BA.1. A recent lab study in Japan found that BA.2 is more severe in hamsters. Hamster models have helped us out a lot in the past, but they certainly have limitations. A “real world” study in South Africa found something different: BA.2 had similar risk of hospitalization as BA.1. Because hamsters are not people, and because the lab is not the real world, I tend to have more confidence in South Africa’s conclusion that BA.2 is not more severe than BA.1. But we definitely need confirmatory analyses from other countries.

Taken together, we thought BA.2 would extend the tails of the Omicron wave. Many countries, like South Africa, did see the tail of the epidemic extended a little, but BA.2 did not cause a huge case upswing. Which is great news.

Image

Source: Tom Wenseleers Source Here

Over the past two weeks, conversations have bubbled up about the need for another booster. As far as I can tell, the triggering event for these discussion was a recent U.S. study published in MMWR. This study analyzed data from a network of hospitals across 10 states during August 26, 2021–January 22, 2022. The scientists wanted to evaluate mRNA vaccine effectiveness (VE) against hospitalizations over time. What did they find?

  • Two doses: VE for hospitalizations was 93% <2 months of a booster → VE was 80% >4 months after a booster

  • Three doses: VE for hospitalizations was 95% <2 months of a booster → VE was 81% >4 months after a booster

So this study showed that vaccine effectiveness against severe disease waned over time, regardless of a 2- or 3-dose series. Is this a sign that the booster did not solidify long-term effectiveness like we hoped? Maybe.

But there are some significant limitations to this study. For example, the data was not stratified by age or health status. Those over 65+ years or immunocompromised may disproportionally contribute to waning. If that’s the case, this study doesn’t necessarily support a broad fourth dose policy. There was also a very small sample with very limited follow-up data: only 39 people in the study had a booster for more than 4 months. This means there is a lot of uncertainty in the statistics. We really need a more robust study to see whether there is a “true” waning signal.

Cue Kaiser Permanente. They published a study this week in Nature. (Note that the study was funded by Moderna). Kaiser has an incredibly extensive database because of their closed health system, making this sort of study among a huge population feasible. The scientists leveraged a sample of over 26,000 patients to assess VE against infections and severe disease. What did they find?

  • Protection against infection waned, regardless of booster status. This is no surprise and another indicator that we really need to shift our focus away from infection to severe disease.

  • During Delta, VE of 2 and 3 doses against hospitalization was ≥99%.

  • During Omicron, VE of 2 and 3 doses against hospitalization was 84.5% and 99.2%, respectfully.

  • The 4 people hospitalized with Omicron despite three mRNA doses were more than 60 years of age with chronic diseases, and one was also immunocompromised. (Immunocompromised people really need to get their fourth dose!)

  • The number of boosted hospitalizations in this study was so low researchers were not able to measure any possible waning.

This study shows that vaccines and boosters continue to work incredibly well against severe disease. But limitations also exist with this study. There was limited follow-up time to properly evaluate waning against severe disease. This was also an insured population, meaning it’s not a great representation of the general U.S. population.

In addition to the Kaiser study, data from the U.K. continues to show a three-dose mRNA series continues to protect swimmingly well against hospitalization. However, they also only have 14 weeks of follow-up data after a booster, so we are at the mercy of time to see if boosters do in fact start waning like the primary series. So far, in the U.K., it doesn’t look like they do.

So, do we need another booster right now? No. Do we need another one soon? Before next winter? Ever? No one knows. That decision will be highly dependent on the duration of protection, how protection changes due to occupation, age, health, and, probably the most important factor, how this virus continues to mutate.

Bottom Line:BA.2 is something to keep an eye on, but I’m not too concerned. I’m more concerned about another variant popping out of nowhere like Omicron did. The booster story will continue to evolve as long as this pandemic continues to evolve.