Gains in Workforce Point to Loosening of Labor Market Unemployment rate falls to 4.2%; recovery faces new Covid-19 uncertainties
The U.S. economy added a seasonally adjusted 210,000 jobs in November—the smallest gain since last December and a marked slowdown from an upwardly revised increase of 546,000 in October, the Labor Department said Friday. Almost 600,000 people joined the workforce, and the unemployment rate fell to 4.2% from 4.6%.
The payrolls number, which comes from a Labor Department survey of businesses, offered an unusually large divergence from data from a separate survey of households also released Friday that showed strong progress in employment.
That survey showed that 1.1 million more people were employed in November than in October. The labor-force participation rate rose to 61.8%, the highest level since March 2020 at the start of the pandemic. (…)
Revisions in the August, September and October job reports have raised employment numbers by a total of 450,000.
Another factor throwing off initial estimates—and the predictions—are pandemic disruptions that have shifted consumption and hiring patterns. That has skewed the Labor Department’s adjustments to account for seasonal volatility in the numbers.
Without the seasonal adjustment, payrolls grew by 778,000 in November. (…)
Average hourly wages were up 4.8% in November from the previous year, roughly on par with October but well above annual growth rates before the pandemic that hovered around 3%. Wages continued to rise briskly in industries with the most acute labor shortages, including leisure, hospitality, transportation and warehousing. (…)
The labor-force participation rate of women aged 25 to 54 rose to 75.6%, the highest since the start of the pandemic in March 2020. That could indicate that child-care issues may no longer be holding so many women back from working.
The gap between the unemployment rate for white and Black workers shrank to 3 percentage points, close to where it was before the pandemic, suggesting disruptions for Black employees may be easing. (…)
Growth in aggregate payrolls (employment x hours x wages) was up 0.75% MoM in November and is up 11.6% annualized in the last 3 months. It was up 10.2% a.r. in the 3 months to October. On a YoY basis, payrolls were up 9.4% in November.

From their pre-pandemic levels, payrolls are up 7.5% (+4.3% annualized) while consumption expenditures and retail sales are up 10.2% (+5.8% a.r.) and 21.4% (+12.2% a.r.) respectively in October. Trends in these 3 series are generally in sync. So while fundamentals remain sound, at least in nominal terms, it seems likely that growth in consumption and particularly retail sales will slow in 2022.

The next chart lets pernicious inflation in, revealing that real payrolls are just back to their pre-pandemic level while total real expenditures are 4.2% above and real retail sales are 13.5% higher, but down from their March peak. Since March, real expenditures are up 2.8% annualized, still quite good but nonetheless 4% above what real payrolls would suggest. A continued rise in real payrolls will be critical going into 2022. Either employment truly accelerates or inflation truly fades.

By WSJ Editorial Board
Friday’s jobs report for November was stronger than Republicans and many in the media are saying. While the U.S. added fewer jobs than expected, the labor force swelled with new workers. What do you know? More Americans are looking for work now that the pandemic enhanced unemployment benefits have lapsed.
The Labor Department’s establishment survey showed the U.S. added 210,000 jobs, which is significantly fewer than the 534,000 on ADP’s private payroll report. But the unemployment rate on the government household survey fell 0.4 percentage points to 4.2%, which is 0.2 percentage points below where it was in March 2020 before lockdowns started.
Employment increased by 1.1 million while the labor force grew by 594,000—the biggest increase since October 2020. Labor force participation rose 0.2 percentage points to 61.8%, the highest it’s been during the pandemic, though still 1.5 percentage points below February 2020. The establishment survey was less buoyant, though it showed big gains in construction (31,000), manufacturing (31,000) and transportation and warehousing (50,000). This should help with supply-chain problems.
The household and establishment surveys converge over time, and November’s jobs numbers could later be revised up. Yet the U.S. is still short 3.6 million workers and 3.9 million jobs from before the pandemic. (…)
For the Federal Reserve, the November message is that it is long past time to speed up its bond-buying taper and begin raising interest rates. The economy’s problem now is rising inflation, not unemployment.
- Declining Jobless Rate Keeps Fed on Track to Accelerate Taper Unemployment is falling faster than Fed officials have anticipated
(…) the unemployment rate has tumbled this year, to 4.2% in November, from 4.6% in October and 6.7% one year ago. (…) Fed officials at their September meeting thought the unemployment rate during the October-to-December quarter would average between 4.5% and 5.1%.
(…) An alternative measure of unemployment and underemployment, which includes those who have stopped looking and those in part-time jobs who want full-time positions, dropped to 7.8% in November from 8.3% in October. It fell as low as 6.8%, in late 2019, before the pandemic. (…)
Mr. Powell cited recent rapid labor-market improvement at congressional hearings this week when he said it would be appropriate to consider accelerating the reduction, or taper, of its asset-purchase stimulus program at the Fed’s meeting on Dec. 14-15. (…)
Average hourly wages are up 4.8% YoY but only +0.26% MoM in November after +0.55% and +0.36% in the previous 2 months (+4.8% a.r. in the last 3 months). The WSJ tries this explanation:
Part of the slowdown stems from wages in the most pandemic-affected sectors going up less rapidly than they did earlier in the year, economists say. From January to May, wages in leisure and hospitality were growing at a higher 23% annualized rate.
“When we look at sectors that were disrupted by Covid, the fact that we’re seeing wage growth normalize fairly quickly shows that these are temporary factors,” said Daniel Zhao, senior economist at job-search site Glassdoor.
But, in reality, earnings in the leisure & hospitality sector rose 0.8% in November (12.3% y/y) while financial sector pay rose 0.5% (5.0% y/y). Professional & business service sector earnings rose 0.3% (5.8% y/y). Earnings in education & health services edged 0.1% higher (5.6% y/y) . Factory sector pay improved 0.2% (4.0% y/y) while construction sector earnings firmed 0.3% (4.8% y/y). No really weak sectors.
Where are the workers? ING asks:
The issue is the lack of workers to hire with the labour participation rate remaining woefully low at 61.8%. (…)
Labour force participation rate and employment ratio
The return of in person schooling, the effective Covid vaccine and the ending of extended and uprated unemployment benefits was supposed to see potential workers come flooding back.
One reason may be that with household wealth having increased by $26tn between end 2019 and June 2021 – equivalent to $78,000 for every American – there isn’t the urgency to go and find work with many people choosing to take early retirement. Those gains will not have been spread evenly over the income spectrum, but there is the likelihood that many individuals have built up a financial buffer so don’t need to go out and immediately get a job they may not especially like doing.

Canada Delivers Stellar November Job Gain Canada added 153,700 jobs in November and the unemployment rate fell to 6.0%. Economists suggested the data could set the stage for a Bank of Canada rate rise in the first half of 2022 depending on the fallout from the Covid-19 Omicron variant.
Statistics Canada reported Friday that Canada’s economy added a net 153,700 jobs in November, following a gain of 31,200 in the previous month.
Nearly all of the job gains were in the private sector. Hours worked also rose and, for the first time, returned to pre-pandemic levels. Average hourly wages rose more than 5% over a two-year period. (…)
With the November results, Canada’s level of employment is now 1% higher than before the pandemic, and in the past six months the economy has added 757,000 net new jobs, or the equivalent of nearly seven million when adjusted for the U.S. market. (…)
Average hourly wages rose 2.7% in November from a year ago. Statistics Canada added that when adjusted to remove pandemic-induced volatility in 2020, average hourly wages advanced 5.2% higher compared with two years earlier. (…)
In the U.S., the two-year growth in hourly earnings is 9.5%!
COMPOSITE PMIs
USA: Service sector reports sustained strong business growth, but costs surge higher
November data signalled a further solid service sector performance across the US, according to the latest PMITM data, as business activity and new orders continued to rise at strong paces. Although output continued to rise at a pace well above the survey’s long-run average, supply and labor issues hampered activity to result in a modest easing in the rate of expansion. Despite employment rising at the fastest pace since June, firms continued to struggle to work through backlogs of work, which rose at the second-fastest pace on record.
Meanwhile, cost burdens surged higher. The rate of input price inflation accelerated to the quickest since May and the second-highest on record amid supply chain disruption and soaring wage bills. The pace of increase in selling prices slipped slightly, but remained marked overall.
The seasonally adjusted final IHS Markit US Services PMI Business Activity Index registered 58.0 in November, down from 58.7 in October but above 57.0 recorded by the earlier released ‘flash’ estimate. Although the pace of expansion was stronger than the series average of 54.8, it was subdued in comparison to rates seen through 2021 so far. Some companies noted that higher output stemmed from the further recovery of client demand following the pandemic, others stated that concerns regarding a resurgence in COVID-19 cases and supply issues weighed on new order growth.
November data indicated a strong rise in new business across the service sector, with the rate of increase holding close to October’s three-month high though remaining below the strong gains seen earlier in the year. Firms stated that the expansion in client demand was sustained but that supply chain issues and higher selling prices often acted as deterrents to customers placing orders. New export orders, on the other hand, returned to growth, posting the largest rise since June amid the reopening of some key markets to travel.
The rate of cost inflation quickened to the second-sharpest on record (since October 2009), beaten only by the rise seen in May. Firms stated that higher supplier and fuel costs, alongside greater wage bills, drove the increase in input prices.
Meanwhile, services firms continued to raise their selling prices in November. The rate of charge inflation eased from October’s series record rise, but was faster than any other increase seen in just over 12 years of data collection. The marked uptick in output prices was overwhelmingly linked to efforts to pass through higher costs to clients.
Service providers were successful in expanding their workforce numbers in November, as the rate of job creation quickened to the fastest since June. Although firms still mentioned challenges keeping hold of staff and hiring suitable candidates for vacancies, many were able to relieve some pressure on capacity.
That said, backlogs of work rose at a sharp rate. The level of outstanding business increased at the second-steepest pace on record as supply and labor shortages stymied firms’ ability to work through incoming new business.
Finally, the outlook for output over the coming year improved in November, with service providers registering more upbeat expectations. The level of optimism was the strongest since June amid hopes of greater client demand, increased stability in supply chains and an end to COVID-19 uncertainty.
The IHS Markit US Composite PMI Output Index* posted 57.2 in November, down from 57.6 in October but still signalling a marked overall expansion in private sector activity. Output was led by the service sector as factories were hampered by supply chain disruptions.
The upturn in new business was solid midway through the fourth quarter amid a strong expansion in services new orders. Meanwhile, foreign client demand signalled a renewed rise.
Sharper increases in manufacturing and service sector input prices led to the fastest rise in cost inflation on record (since October 2009). Alongside greater fuel and material costs, firms noted a steeper uptick in wage bills. Although the rate of charge inflation softened from October, it was the second-sharpest on record as firms sought to pass on higher costs to customers.
Despite ongoing reports of difficulties retaining workers, private sector employment rose sharply in November and at the fastest pace for five months. The rate of growth in backlogs of work softened, but it was the third-steepest on record.


Eurozone: Stronger growth in November masks disjointed recoveries by nation and sector
Having slowed sharply since peaking in July, economic growth across the euro area re-accelerated November, according to the latest PMI® survey. Overall, the rate of expansion was solid and remained above its historical average, primarily reflecting resilience in the service sector as manufacturers were heavily impeded by severe supply-related constraints.
However, the strongest rates of growth were seen away from the two largest euro area economies monitored by the survey, with Germany in particular recording a weak rate of growth in November.
Meanwhile, there was a further intensification of price pressures across the eurozone in November, with rates of output charge and input cost inflation both accelerating to fresh highs.
After accounting for seasonal factors, the IHS Markit Eurozone PMI® Composite Output Index rose to 55.4 in November, from 54.2 in October, indicating a solid and accelerated rate of economic expansion across the euro area. On a positive note, the faster increase ended a three-month sequence of slowing growth in which the headline index shed six points.
That said, solid growth at face value was primarily a reflection of the service sector’s performance, masking the second-softest increase in manufacturing production since its recovery began in July 2020.
As well as sectoral growth differences, data split by member states monitored by the survey also varied notably during November. Ireland registered the fastest expansion in combined manufacturing and services output, despite slowing to a seven-month low. Meanwhile, Spain, Italy and France all recorded quicker upturns which were well in excess of their historical averages. However, it was in the currency bloc’s largest economy, Germany, where the slowest expansion was seen. Growth here was little-changed from October’s eight-month low.
Back to the eurozone as a whole, new business inflows continued to rise during November. However, the rate of increase was the weakest since April and represented a continued slowdown from July, where growth was at its strongest for over 21 years. A slower increase in new export business was also recorded.
Nevertheless, capacity pressures grew once again, with backlogs of work increasing for a ninth month in succession. Volumes of outstanding work rose at a particularly sharp rate at manufacturers as supply constraints held back production.
Still, further robust jobs growth was recorded in November as businesses continued in their efforts to boost capacities and make inroads into their backlogs. Strong rates of employment growth were seen at both manufacturers and service providers.
Elsewhere, intense price pressures remained widespread across the euro area, with rates of output charge and input cost inflation accelerating to new survey highs in November.
Lastly, business confidence weakened to a ten-month low in November, reflecting a deterioration in sentiment at service providers.
The IHS Markit Eurozone PMI® Services Business Activity Index increased to 55.9 in November, from 54.6 in October, signalling a solid rate of expansion in output at euro area service providers. Although this was markedly weaker than the growth rates seen in the second and third quarter, November still achieved a rate of growth which was above the survey’s historical average.
Demand for services increased for a seventh straight month in November, although the expansion was the weakest over this period. New orders from foreign clients also rose, albeit only marginally.
Nonetheless, capacity pressures continued to build, while firms hired additional staff to support the provision of their services. The rate of jobs growth was the third-quickest in over 14 years.
Lastly, prices data showed accelerated increases in both output charges and input costs. In both cases, rates of inflation reached new survey highs.


Chris Williamson, Chief Business Economist at IHS Markit:
An improvement in the rate of economic growth signalled by the eurozone PMI looks likely to be short-lived. Not only did demand growth weaken, but firms’ expectations of future growth also sank lower as worries about the pandemic intensified again. With the data collected prior to news of the Omicron variant, sentiment about near-term prospects will inevitably have been knocked even further.
Growth is looking especially subdued in Germany and France, where supply shortages have had a notably stronger knock-on effect from manufacturing through to services. More resilient expansions are being recorded in Spain and Italy, though even here recent gains are at risk if social distancing restrictions need to be stepped up. (…)
While growth risks have shifted to the downside, risks to the inflation outlook seem tiled to the upside if virus case numbers continue to rise and new restrictions are introduced. Supply chains will be further hit, staff availability will deteriorate and spending could shift from services to goods again, further exacerbating the imbalance of supply and demand.
Total business activity across China continues to rise modestly
Latest PMI data showed a further expansion of service sector activity across China during November, but growth softened from October amid the recent rise in COVID-19 cases. New order inflows rose only slightly, while growth in new export business remained mild. Nonetheless, firms were strongly upbeat regarding the 12-month outlook for activity, and continued to increase their staffing levels. Higher labour, raw materials and energy costs all drove a sharper rise in input costs, however, which contributed to a further increase in output charges.
The headline seasonally adjusted Business Activity Index fell from 53.8 in October to 52.1 in November, to signal a third successive monthly increase in Chinese services activity. That said, the rate of expansion was the slowest seen over this period and only modest. Panel members often mentioned that the recent increase in virus cases had weighed on performance and impacted sales.
Total new business rose at the slowest rate for three months in November and only marginally overall. Firms indicated that measures to curb the spread of COVID-19 had dampened new order inflows. Foreign demand also rose only slightly, with the pandemic also cited as a key reason for relatively muted growth.
Despite the disruption to business activity due to COVID-19 and a softer rise in new work, firms remained strongly confident that output will increase over the next year, with the level of optimism strengthening from October. Growth forecasts were frequently linked to expectations that the pandemic will be brought under control globally and demand conditions will improve. Strong business confidence and efforts to expand capacity led to a further rise in service sector employment during November. The rate of job creation was the quickest seen since May, albeit marginal overall. Staffing levels have now increased in four of the past five months.
After stabilising in October, the amount of outstanding business at Chinese service providers rose in November. Some firms mentioned that a combination of higher sales and the pandemic had placed some pressure on capacities. That said, the rate of accumulation was only slight.
Average input prices rose for the seventeenth month running in November amid reports of increased costs for labour, materials and energy. Furthermore, the rate of inflation accelerated to a six-month high and was sharp overall.
In contrast to the trend for input costs, prices charged by services companies rose at a softer rate in November. Some firms commented that softer demand conditions had weighed on overall pricing power.
The Composite Output Index edged down from 51.5 in October to 51.2 in November, to signal an increase in total Chinese business activity for the third month in a row. That said, the rate of expansion was the softest seen over this period and modest overall. The upturn was also weaker than the long-run trend (52.6). Sector data showed that a slower rise in services activity offset a renewed, albeit fractional, increase in manufacturing output.
At the composite level, new order growth slowed to a fractional pace that was the slowest for three months. Employment mean while remained broadly stable, as job creation at services companies largely offset a drop in manufacturing workforce numbers. Composite input prices and output charges both rose at noticeably slower rates compared to October, predominantly driven by slower increases in the manufacturing sector.


What the November PMIs are saying:
- Growth in the U.S economy remained very strong in November. In fact, it seemed to accelerate during the month as the final Services PMI was one full point above its flash estimate.
- The rate of services job creation quickened to the fastest since June, in sharp contradiction with the establishment survey’s slow +0.1% gain in services jobs in November. For reference, services jobs rose by 0.7% and 0.8% MoM in June and July respectively. Upward revisions likely in November payroll numbers.
- Markit noted “soaring wage bills” for U.S. service providers, doubting the slowdown in November wage growth.
- All country PMIs report sustained increases in costs and selling prices in November. Markit says that “data suggest that [inflation] rates may not yet have peaked (…) service sector costs are on the rise as wage growth picks up (…). While we may see a peak in global inflation around the turn of the year, the risks of rates remaining elevated through 2022 have risen.”

- Global manufacturing demand should remain strong for a while given strong demand and low inventories of finished goods:

-
On the other hand, supply issues and rising prices are forcing companies to build safety stocks. Worldwide inventories of purchases inputs are rising at survey record rates.

-
Contrary to what some pundits claim, shipping costs are not easing just yet.

Goldman Sachs’ Analyst Index confirms the resilient cost pressures: “80% of surveyed analysts reported that firms in their sectors are experiencing supply constraints. (…) analysts indicated that risks lean towards a later resolution of supply constraints. In addition, half of surveyed analysts indicated that firms in their sector plan to diversify their supply chains to better respond to future supply shortages.”

- Retreat From Globalization Adds to Inflation Risks Higher inflation has been blamed on supply-chain bottlenecks, labor shortages and the effects of fiscal stimulus, but there is another factor at work—a shift away from globalization.
(…) While supply-chain bottlenecks should eventually ease, other trends could persist—protectionist policies such as tariffs and “Buy American” procurement rules, businesses moving production back to the U.S. where it will be less vulnerable to those policies, and depressed immigration inflows. (…)
The share of foreign content in global manufacturing production surged from 17.3% in 1995 to 26.5% in 2011, according to Asian Development Bank data analyzed by the Conference Board. It has since declined to 23.5% in 2020. Global foreign direct investment, a key gauge of cross-border business expansion, peaked at around $2 trillion in 2015 and fell to $1.5 trillion in 2019, according to the United Nations Conference on Trade and Development.
Deglobalization gained impetus with the global financial crisis of 2008, Britain’s vote to leave the European Union in 2016 and former President Donald Trump’s tariffs. It might be adding to current high inflation, though those effects are hard to disentangle from the pandemic.
Citi economists note that prices for household furnishings and operations, which declined nearly constantly following the 2008 financial crisis, started climbing in 2017 as the Trump administration prepared to hit China with tariffs, eventually imposing a 25% tariff on those products. Those prices rose 3% between October 2017 and March 2020 and have since gained another 8.5%.
The Trump administration’s tariffs on steel, aluminum and imports from China, combined with trading partners’ retaliatory tariffs, increased annual costs born by U.S. consumers by $51 billion annually, according to the American Action Forum, a center-right policy-research group.
President Biden has negotiated an end to some of Mr. Trump’s tariffs such as on steel and aluminum from Europe, but left most of the tariffs on goods from China in place.
The Commerce Department last month doubled levies imposed in 2017 on Canadian softwood lumber to 18%. (…)
The Biden administration in June banned imports of some solar-panel materials from China’s Xinjiang region, a major producer, over the alleged use of forced labor there. As a result, the price of polysilicon, a key solar-panel ingredient, surged to more than $20 a kilogram in the second quarter of 2021, versus $6.20 a year earlier, according to Wood Mackenzie, a research company. (…)
The Biden administration in June banned imports of some solar-panel materials from China’s Xinjiang region, a major producer, over the alleged use of forced labor there. As a result, the price of polysilicon, a key solar-panel ingredient, surged to more than $20 a kilogram in the second quarter of 2021, versus $6.20 a year earlier, according to Wood Mackenzie, a research company. (…)
Meanwhile, economists at JPMorgan Chase & Co. estimate the U.S. immigrant population this year is about three million lower than if pre-2017 immigration trends had continued. Domino’s Pizza Inc. CEO Richard Allison said on an October earnings call that lower immigration in recent years had contributed to the pandemic-driven shortage of labor, particularly drivers, which had added to costs and increased delivery fees. “In a country whose population is not growing as it used to, we, in our industry and a number of others, will need more immigration…to continue to have a robust workforce,” he said. (…)
All of the above suggest that November employment numbers and wages will be revised up and that inflation is not about to slow meaningfully. It also says that economic and financial risks are rising as companies boost inventories to protect against shortages and rising prices. Should demand slow markedly, profits will suffer.
Corporate margins are at an historical high, but executives keep warning about rising costs of all kinds.

Pre-announcements are increasingly negative. Of the 8 new ones last week, 6 were negative. Compared to Q3, we have had 10 fewer pre-announcements overall but 12 more negatives.

Yet, 64% of analyst revisions were upwards last week, in line with the previous 3 weeks.
Examples of clear warnings:
-
“The economy is very strong and inflationary pressures are high, and it is therefore appropriate in my view to consider wrapping up the taper of our asset purchases, perhaps a few months sooner”. (Jerome Powell)
-
“Gas prices are a concern. They’re a concern not just in this country, but everywhere. They are up dramatically versus a year ago. And the customers had money and at some point, that’s going to come to an end. Hopefully, that’s a gradual process and hopefully, gas prices come down. We sell a lot of fuel in both Walmart U.S. and Sam’s; we’re trying to help keep those prices down.” (Walmart President & CEO of Walmart US John Furner)
-
“We know that inflation is having an impact on customers as well. 82% of consumers polled across the country are feeling the impact of inflation. And one in four consumers are not confident in their finances right now.” (Kroger CEO Rodney McMullen)
This chart shows how prices of essential goods and services (food, energy and shelter, weighted) are now eating into hourly wages.

TECHNICALS WATCH
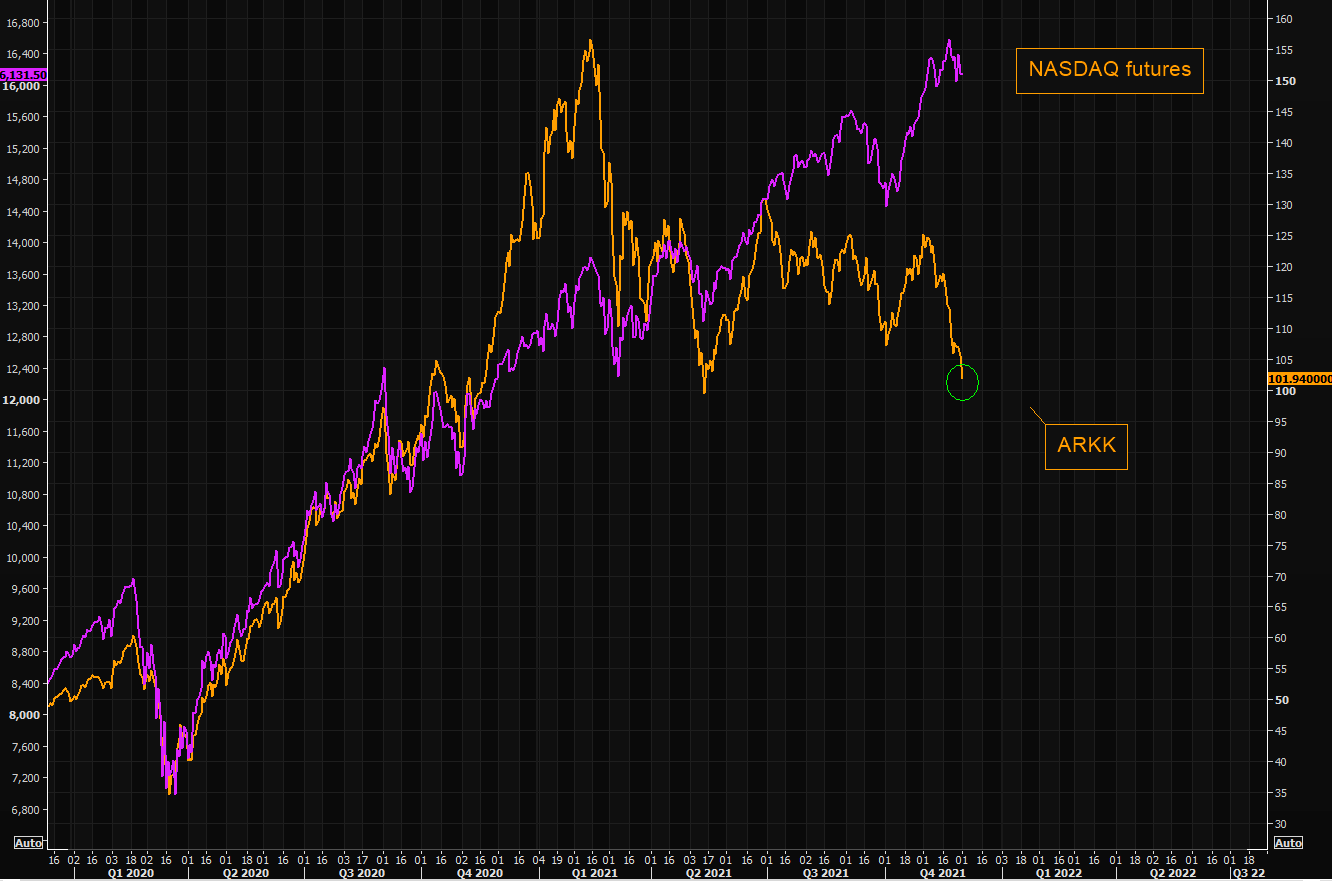
- Narrowing equity market breadth may signal a “market top” -BofA Just five of the biggest U.S. technology stocks accounted for 71% of the nearly 20% gains in U.S stocks, BoFA analysts noted of the performance of shares in a weekly flows note based on EPFR data.
- My favorite technical analysis firm talks about “the carnage under the surface” last week. If demand does not return rapidly and swiftly (i.e. “buy-the dip” mentality), signs of a classic topping process since March will become evident. Caution is the word.
- In fact, investors seem to be in a “risk down” mood looking at various indicators such as expensive tech stocks, SPACs, bitcoin and other speculative assets.
China Braces for Evergrande Restructuring After Months of Tumult
The embattled developer said in an exchange filing late Friday that it plans to “actively engage” with offshore creditors on a restructuring plan, offering its most explicit acknowledgment yet that its $300 billion of overseas and local liabilities have become unsustainable.
A barrage of statements from Chinese regulators — several of which landed just minutes after Evergrande’s announcement — suggested authorities are striving to contain the fallout on financial markets and homeowners rather than orchestrate a bailout.
The government of Guangdong, the southern province where Evergrande is based, summoned founder Hui Ka Yan to express concern over the company’s announcement and said it would dispatch a team to the developer to ensure “normal” operations. The People’s Bank of China blamed Evergrande’s problems on the company’s “own poor management” and “reckless expansion.” (…)
The question for global markets is whether Beijing can coordinate a restructuring without upending the broader real estate sector, which accounts for nearly a quarter of economic output. Policy makers have a history of abandoning efforts to rein in developers when the risks to growth mount, though Xi appears more determined than his predecessors to stamp out the moral hazard that allowed companies like Evergrande to expand so rapidly.
One risk is that Beijing may not have a full picture of how indebted Evergrande and its peers have become. The Shenzhen-based developer indicated in its exchange filing on Friday that it may not be able to fulfill its pledge to guarantee payment on a $260 million note issued by joint venture Jumbo Fortune Enterprises, an obligation that many Evergrande investors didn’t even know existed until a few months ago. (…)
Apart from Evergrande, money managers are bracing for a potential default by Kaisa Group Holdings Ltd., which faces a $400 million bond maturity on Tuesday after failing to swap the notes for new ones due 18 months later. (…)
FYI:
- The percentage of non-vaccinated is down just about everywhere except in the USA:
 Source: Jim Reid, Deutsche Bank (via Barry Ritholtz)
- Tether Fails to Dispel Mystery on Stablecoin’s Crucial Reserves The latest financial disclosure from Tether, which serves as a controversial foundation for much of the cryptocurrency market, didn’t shed any more light on where its reserves are held.
Tether Holdings Ltd. had assets totaling at least $69 billion as of Sept. 30, according to an assurance from Cayman Islands-based Moore Cayman. That includes $30.6 billion in commercial paper and certificates of deposit, $7.2 billion in cash, almost $1 billion in money market funds and $19 billion in Treasury bills.
The disclosure showed that Tether shifted about $1 billion in “reverse repo notes” holdings to money-market funds. However, they don’t specify in which countries the money funds are based. It also noted a reduction in the percentage of total assets held in commercial paper from the end of June.
Bennett Tomlin, an independent researcher who has been critical of Tether and the affiliated crypto exchange Bitfinex, said today’s disclosure is “very similar to the last several attestations,” despite new language defining the credit rating companies referenced in the report.
Tether is holding “a lot of commercial paper — it’s not clear from where or how,” Tomlin said. Other unanswered questions include the type of digital assets in its holdings, the counterparties for its secured loans, and the use of yields from the holdings.
Tether had been at the center of speculation for years that the coin, used to facilitate trades in the crypto market, wasn’t backed one-to-one with dollars as claimed. In February, the companies agreed to provide quarterly reports to New York as part of a settlement over allegations that it hid the loss of funds and lied about reserves in prior years.
The disclosure in March that Tether held commercial paper triggered a guessing game in both the crypto and fixed income world as investors tried to figure out what securities were held beyond the amounts listed. (…)
The latest assurance also listed $3.5 billion in secured loans to non-affiliated entities, $3.6 billion in corporate bonds, funds and precious metals, and $3.8 billion in other investments that include digital tokens.
Tether has denied holding Evergrande debt but Stuart Hoegner, Tether’s lawyer, had declined to say whether Tether had other Chinese commercial paper in an interview with Bloomberg Businessweek. He said the vast majority of its commercial paper has high grades from credit ratings firms.
Austin Says U.S. Will Counter China’s ‘Disturbing’ Activities


 OMG: The latest (through Nov. 27) Chase card spending tracker cratered around Thanksgiving (this is a 7d m.a.):
