ADVANCE MONTHLY SALES FOR RETAIL AND FOOD SERVICES, OCTOBER 2021
This a.m., more on this tomorrow:
Advance estimates of U.S. retail and food services sales for October 2021, adjusted for seasonal variation and holiday and trading-day differences, but not for price changes, were $638.2 billion, an increase of 1.7 percent (±0.5 percent) from the previous month, and 16.3 percent (±0.9 percent) above October 2020.
Total sales for the August 2021 through October 2021 period were up 15.4 percent (±0.7 percent) from the same period a year ago. The August 2021 to September 2021 percent change was revised from up 0.7 percent (±0.5 percent) to up 0.8 percent (±0.2 percent).
Retail trade sales were up 1.9 percent (±0.4 percent) from September 2021, and up 14.8 percent (±0.7
percent) above last year. Gasoline stations were up 46.8 percent (±1.6 percent) from October 2020, while food services and drinking places were up 29.3 percent (±3.9 percent) from last year.
Excerpts from a long Bridgewater analysis:
Even as supply disruptions and higher inflation persist, markets are discounting that they will soon subside, leaving inflation at central bank targets and allowing for very easy monetary policy for a very long time. We disagree. While the headlines tend to focus on the micro elements of the supply shock (the LA port, coal in China, natural gas in Europe, semiconductors globally, truckers in the UK, etc.), this perspective largely misses the macro cause that is likely to persist and for which there is no idiosyncratic solution. This is not, by and large, a pandemic-related supply problem: as we’ll show, supply of almost everything is at all-time highs. Rather, this is mostly an MP3-driven upward demand shock. And while some drivers of higher inflation have been transitory, we see the underlying demand/supply imbalance getting worse, not better.
The mechanics of combined monetary and fiscal stimulus are inherently inflationary: MP3 creates demand without creating any supply. The MP3 response we saw in response to the pandemic more than made up for the incomes lost to widespread shutdowns without making up for the supply that those incomes had been producing. This is very different than post-financial-crisis MP2, where QE, by and large, was not paired with significant fiscal stimulus but instead offset a credit contraction and, as a result, was not inflationary.
We’re now seeing the inflationary mechanics of MP3 play out and observing just how potent a tool it is. And while the composition of the demand it fueled will evolve (e.g., shift from goods back toward services as COVID recedes), demand is likely to remain highly elevated. There are still large stockpiles of latent spending due to the transformative effects that MP3 has had on balance sheets and the ongoing incentive provided by extremely low real yields, and more fiscal stimulus is on the way. Choking off demand would require central banks globally to move toward restrictive policies quickly, which looks unlikely.
In this research, we paint a picture of the surge in demand and how supply is straining to meet it virtually everywhere you look. There are not enough raw materials, energy, productive capacity, inventories, housing, or workers. We start with this broad-brush picture because the demand-driven nature of the problem results in a game of whack-a-mole: alleviating a shortage in one area will likely just exacerbate the problem elsewhere in the supply chain. (…)
Goods Production Is Well Above Pre-COVID Trend, but Demand Has Exploded
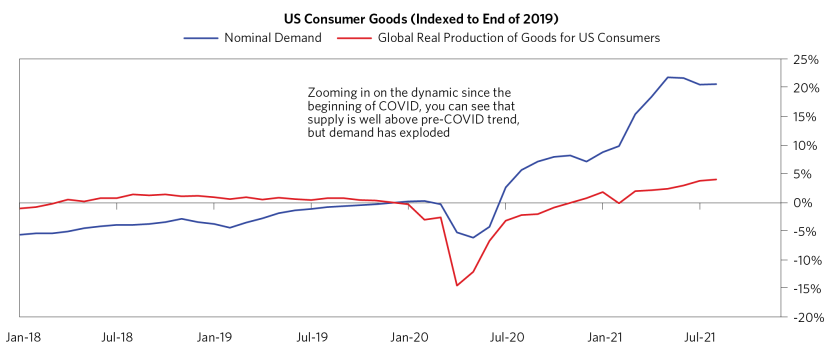
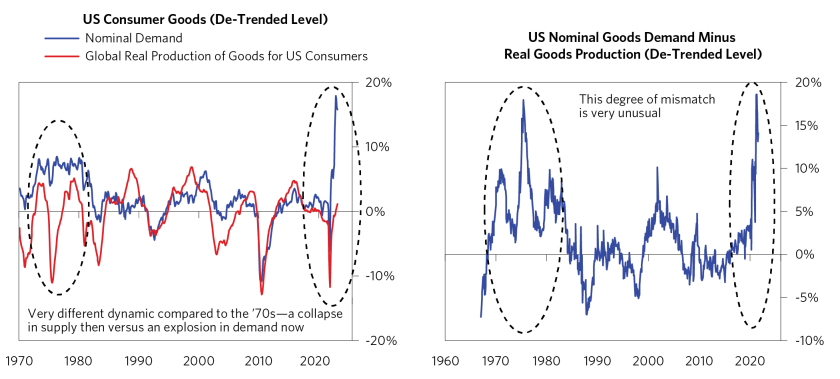
While some of the goods demand is unlikely to persist because of the unique circumstances of COVID prompting people to shift their spending from services to goods, the problem of shortages is also happening for services and is likely to build. The chart below shows that demand for services is rapidly returning to pre-COVID levels and services employment is lagging, as employers are having trouble finding workers. (…)
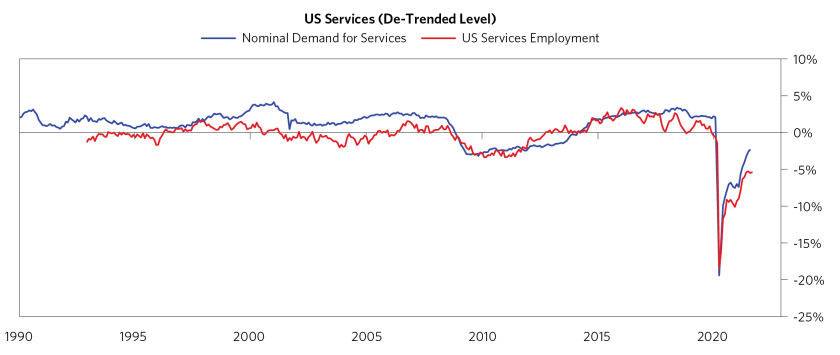
As a rough size of the magnitude of the problem, if you take the typical relationship of how much labor it takes to satisfy services demand, a return to pre-COVID levels of services demand would push unemployment to historical lows. Addressing this imbalance will mean placing upward pressure on wages to entice more workers to work longer as well as requiring investment to improve productivity.
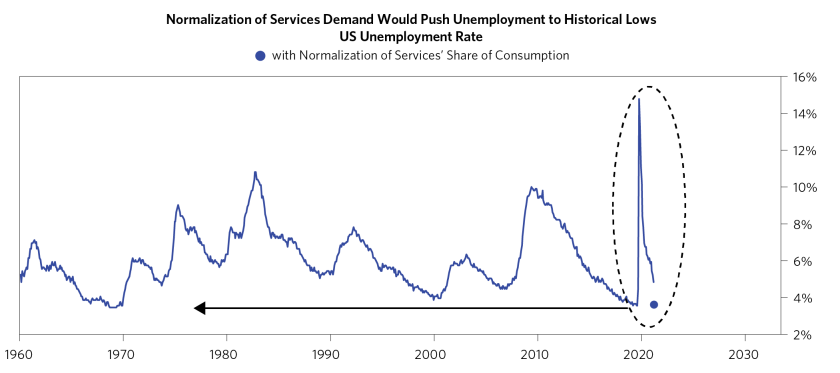
Given the cause of massive demand, addressing these shortages is like a game of whack-a-mole. You can fix it in one place, but you can’t fix it everywhere in any simple way. It’s going to require a lot of investment and/or a lot of productivity enhancement to catch up. But right now, the gap is so large—and policy remains so loose that it’s encouraging demand further—that this gap is likely to be reasonably sustained.
In terms of household demand, (…) In short, households are wealthy, flush with cash, and ready to spend—setting the stage for a lasting, self-reinforcing surge in demand. (…)
- Charted: Americans’ wealth

Data: Bureau of Economic Analysis; Federal Reserve Board; World Bank; McKinsey Global Institute analysis; Chart: Axios Visuals
- It’s a global phenomenon, another lengthy analysis, this one from McKinsey:
The global balance sheet and net worth more than tripled between 2000 and 2020. Assets grew from $440 trillion, or about 13.2 times GDP, in 2000 to $1,540 trillion in 2020, while net worth grew from $160 trillion to $510 trillion. Average per capita net worth was $66,000, but large variations exist across economies, and even more so across households within an economy. In the countries in our sample, per capita net worth ranged from $46,000 in Mexico to $351,000 in Australia. Net worth ranged from 4.3 times GDP in the United States to 8.2 times GDP in China. (…)

Among the ten countries, China accounted for 50 percent of the growth in net worth, or wealth, from 2000 to 2020, followed by the United States, at 22 percent. Japan, which held 31 percent of the ten economies’ wealth in 2000, held just 11 percent in 2020.
Within the household sectors of China and the United States, the top 10 percent of households own two-thirds of wealth. In the United States, the amount of the country’s wealth held by the top 10 percent of households grew from 67 percent in 2000 to 71 percent in 2019, while the bottom 50 percent of wealth owners’ share dropped from 1.8 percent in 2000 to 1.5 percent in 2019. In China, the top 10 percent of households owned 48 percent of the nation’s wealth in 2000, and by 2015, those households owned 67 percent. The bottom 50 percent of Chinese households owned 14 percent of wealth in 2000 and 6 percent in 2015. (…)
There are different ways to interpret the expansion of balance sheets and net worth relative to GDP. It could mark an economic paradigm shift, or it could precede a reversion to the historical mean, softly or abruptly. Aiming at a soft rebalancing via faster GDP growth might well be the safest and most desirable option. To achieve that, redirecting capital to more productive and sustainable uses seems to be the economic imperative of our time, not only to support growth and the environment but also to protect our wealth and financial systems.
In the first view, an economic paradigm shift has occurred that makes our societies wealthier than in the past relative to GDP. In this view, global trends including aging populations, a high propensity to save among those at the upper end of the income spectrum, and the shift to greater investment in intangibles that lose their private value rapidly are potential game changers that affect the savings-investment balance. These together could lead to sustainably lower interest rates and stable expectations for the future, thereby supporting higher valuations for assets than in the past.
In the opposing view, this long period of divergence may be ending, and high asset prices could eventually revert to their long-term relationship relative to GDP, as they have in the past. Increased investment in the postpandemic recovery, in the digital economy, or in sustainability might alter the savings-investment dynamic and put pressure on the unusually low interest rates currently in place around the world, for example. This would lead to a material decline in real estate values that have underpinned the growth in global net worth for the past two decades.
Not only is the sustainability of the expanded balance sheet in question; so too is its desirability, given some of the drivers and potential consequences of the expansion. For example, is it healthy for the economy that high house prices rather than investment in productive assets are the engine of growth, and that wealth is mostly built from price increases on existing wealth?
The smartest way forward, then, may be for decision makers to work to stabilize and reduce the balance sheet relative to GDP by growing nominal GDP. To do so, they would need to redirect capital to new productive investment in real assets and innovations that accelerate economic growth.
For business leaders, this would mean identifying new growth opportunities and ways to raise the productivity of the workforce with capital investment that complements rather than displaces their employees. Many corporations today have excess liquidity that they could deploy. Sustainability investments, for instance, could turn from a cost to a growth opportunity if framework conditions such as higher carbon pricing are put in place that require higher investment yet keep a level playing field between competitors. Could changes to the way intangibles are accounted for on corporate balance sheets result in higher investment? And how should business leaders think about providing new stores of value, justifying equity valuations, and building household wealth?
Leaders of financial institutions could seek to develop financing mechanisms aimed at deploying capital to new growth opportunities, while limiting debt creation for asset transactions at ever-rising prices. Also, the global balance sheet is directly reflected on their own balance sheets. Beyond risk assessments, what do the trends of the past 20 years and scenarios ahead mean for their balance sheets and revenue growth? How might they contribute to the evolution of the global balance sheet, and what would that mean for responsible banking?
For policy makers, rebalancing would require removing barriers to investment in gaps in the economy, such as sustainability and affordable housing. Tools already exist to achieve this, such as reforming zoning regulations that make real estate scarce; tax levers that alter the taxation of capital and property gains relative to income; and getting more serious about carbon pricing and regulation.
This research offers a new way of assessing the macroeconomic context in which businesses, governments, households, and financial institutions operate and live. It provides a platform for developing scenarios for the future and finding ways to hedge against risks and capture benefits should balance sheets rebalance and the economic environment change as a result. We expect to address some of these questions in further research, and we invite comments and insights.
Back to inflation:
From recent corporate conference calls, courtesy of The Transcript:
- “The cost inflation we are seeing is pretty much global. It’s mainly — it’s a global phenomenon. From aluminum, chemicals, packaging and freight and everybody is impacted the same way. (…) We have already made 2 price increases. And so far, I can say these price increases have been accepted by our customers. We are now preparing for the third one, which will be even probably more significant than the other ones. I believe that there is overall an acceptance rate. I’m not saying that customers welcome that we increase prices, especially as the increase is starting to be very significant. You’re talking double-digit increase here. But overall, this is well understood by the market.” – Agfa-Gevaert (AFGVF) CEO Pascal Juery
- “We expect both our construction and lot costs will continue to increase — In terms of lumber cost, that they are still rising. They rose further in our fiscal Q4. We’ve seen them rise further into October, so we do believe that we are seeing the peak of lumber cost. However, other costs are increasing as well, we’re seeing costs really increasing across-the-board so even when we see perhaps have some relief from lumber as we move further into fiscal 2022, I think that will be offset by other cost increases. (…) new home demand remains very strong and our local teams are continuing to restrict our sales order pace where necessary on a community-by-community basis based on the number of homes in inventory, construction times, production capacity, and lock position. ” – D.R. Horton (DHI) CFO Bill Wheat
- “During the third quarter, we also experienced additional food cost inflation, namely in protein categories such as beef and pork. In addition, after seeing food cost inflation moderate in July, these costs accelerated again in August and September.”- OurUS Food (USFD) CFO Dirk Locascio
- “…over the past year or so, we’ve talked about the increase in the price of content. You see the content, that because of just the competition for talent for everything that’s involved in productions, content costs have gone up. Where we see it directly in our parks business is primarily through the hourly wage inflation“ – Walt Disney (DIS) CFO Christine McCarthy
- “…what we’re starting to accept is that there has been a fundamental change in what the job seekers are looking for from work, and that’s evidenced not just by the reluctance of the unemployed to resume searching for work but also the great resection where people who were currently employed who now feel safe are now leaving their jobs at record levels. You’re seeing an employer reaction to that, that is predictable with a record increase in wages, a record number of jobs that offer benefits, flexible schedules, and/or even remote work. So it seems like the job market is still in a state of flux as it reacts in response to what happened during COVID. And it’s yet to settle down and play itself out.” – Ziprecruiter (ZIP) CEO Ian Siegel
The Empire State Manufacturing Index of General Business Conditions rose to 30.9 in November after falling to 19.8 during October. A reading of 20.8 had been expected in the Action Economics Forecast Survey. An increased 43.0% of respondents reported improved business conditions, up from 39.4% last month, while 12.1% reported that conditions had worsened, down from 19.5% in October. The latest survey was conducted between November 2 and November 9.
Haver Analytics constructs an ISM-adjusted Empire State diffusion index using methodology similar to the ISM series. The latest reading rose to 62.5, making up most of the decline to 60.0 in October. A reading above 50 signifies positive growth.
Movements amongst the component series were mixed this month. The new orders measure rose to 28.8 from 24.3 in October. The shipments reading improved to 28.2 from 8.9. The delivery time index declined to 32.2 from 38.0. A lessened 38.1% of respondents reported faster delivery speeds while a little-changed 5.9% reported slower order fulfillment. The unfilled orders series fell to 12.7 from 18.5 in October. Inventories fell in November to 9.3 from 12.0 last month.
The number of employees index rose to 26.0 in November after falling to 17.1 in October. It was a record high for the series which dates back to July 2001. An increased 29.2% of respondents reported more hiring while a lessened 3.2% reported less hiring. The average workweek reading rose to 23.1 this month and made up most of last month’s decline.
The prices paid index rose to 83.0 in November from 78.7 in October. The record was 83.5 in May. A higher 83.1% of respondents indicated higher prices while none paid less. The prices received measure increased to a record 50.8 in November.
The index of business conditions in six months fell sharply this month to 36.9 from 52.0 in October. It was the lowest reading in six months. Expectations for new orders, shipments and employment fell while prices paid, unfilled orders and delivery times rose. Expectations for capital spending as well as technology spending rose slightly.


(…) CREA’s home price index, which adjusts for pricing volatility, rose 2.7 per cent to $770,000 for a typical home across the country. That is the highest monthly price increase since February and March, when homes in the Toronto and Vancouver suburbs were drawing dozens of offers. (…)
Throughout most of the pandemic’s property frenzy, home buyer demand has surged in the suburbs, smaller cities and semi-rural parts of the country. (…)
In the Toronto region, where prices were not rising as quickly as the suburbs, the home price index spiked to its highest level since the 2016-17 real estate boom. The price index for a typical home in the Greater Toronto Area rose 4.8 per cent to $1,139,400 from September to October. (…)
Federal mortgage insurer Canada Mortgage and Housing Corp. has warned that the country‘s housing market is overvalued and overheated. It has singled out Hamilton, Toronto, Ottawa, Halifax, Moncton and Montreal as highly vulnerable to a price downturn.
Bank of Canada says economic slack not yet absorbed, will not raise interest rate
The Bank of Canada will not raise its benchmark interest rate until the slack in the country’s economy is absorbed, which has not yet happened but is getting closer, Governor Tiff Macklem said in a newspaper opinion piece on Monday.
Macklem also noted that while inflation risks have increased – driven by pandemic-induced demand shifts, supply disruptions and higher energy prices – the central bank continues to view the recent dynamics as transitory.
“For the policy interest rate, our forward guidance has been clear that we will not raise interest rates until economic slack is absorbed. We are not there yet, but we are getting closer,” Macklem wrote in an op-ed for the Financial Times newspaper.
He added that the central bank’s policy framework – a flexible inflation target focused on the 2% midpoint of a 1-3% control range – means Canadians can be confident that inflation will be kept under control, while supporting a full recovery.
“What our resolve does mean is that if we end up being wrong about the persistence of inflationary pressures and how much slack remains in the economy, we will adjust. Our framework enables us to do just that,” Macklem said. (…)
Canada’s inflation rate rose to 4.4% in September and is expected to hit 4.7% in October, with that data due on Wednesday.
The Bank of Canada signaled last month that its first rate hike could come as soon as April 2022, though money markets are betting on a hike in March, with a total of five in 2022.
Resurgent Oil Supply Expected to Soothe Tight Market The tight supply and demand balance in the global oil market could be about to ease, the IEA said in its monthly report.
It expects output to rise by 1.5 million barrels a day in the remainder of 2021, with the U.S., Saudi Arabia and Russia accounting for around half of that amount.
At the same time, while demand for transportation fuels continue to recover and a supply shortage in the natural gas market has forced some power plants to switch to using oil and refined products, “new Covid waves in Europe, weaker industrial activity and higher oil prices will temper gains,” the Paris-based energy watchdog said. (…)
With the U.S. Energy Information Administration also forecasting growing supply from 2022, “it is not clear whether the Biden administration will still feel that it is necessary to take action,” said ING analyst Warren Patterson. (…)
The watchdog expects oil production to continue increasing after the end of 2021 as well, raising its 2022 forecast by 100,000 barrels a day to 1.9 million barrels a day. A combination of rising output from the Gulf of Mexico, where supply was severely affected by Hurricane Ida earlier in 2021, and fewer overall outages—the pandemic has meant more downtime and affected maintenance schedules—will drive that increase, the IEA’s report said.
The report said rising output, particularly from the U.S.—which the IEA expects to account for 60% of the non-OPEC+ supply increase—will go some way to meet rising demand, with vaccination campaigns allowing travel to continue to rebound, driving exceptional strength in gasoline demand and setting jet-fuel demand on a course to reach around 80% of 2019 levels by the end of next year.
SENTIMENT WATCH
Global investors ending 2021 ‘risk-on’ – BofA
Investors are heading towards the end of the year in a “risk-on” mood, having reduced cash allocations and lifted their overweight position on U.S. stocks to the highest since August 2013, BofA Securities’ monthly fund manager survey showed.
Inflation remains the biggest tail risk for markets but a majority of 61% believes it is transitory and expect the Federal Reserve to remain “well behind the curve” in setting its monetary policy, the U.S. investment bank added on Tuesday.
“Investors are not expecting the Fed to tighten aggressively (i.e. buy-in for Powell narrative on transitory inflation and modest tapering),” said Bofa adding that investors now see on average 1.5 Fed rate hikes next year, up from 1.1 last month. (…)
As fears about price pressures abated, investors rotated out of inflation assets, to discretionary and tech from energy, industrial and banks, while reducing value exposure to the benefit of growth.
The survey highlighted easing concerns over a macro slowdown with a net of 3% now saying the global economy will improve and only 6 out of 100 expecting a recession in the next 12 months.
It also said “Long Tech Stocks” was the most crowded trade at 37% followed by Bitcoin at 21% which a 59% majority thinks is in a bubble.


What this chart appears to illustrate is the waning efficacy of the vaccine over time. As we enter the winter months, the pressure is going to be on once more to launch a vaccination campaign. (…)


