CPI for all items rises 0.4% in September; food, shelter among indexes rising
Over the last 12 months, the all items index increased 5.4 percent before seasonal adjustment. The indexes for food and shelter rose in September and together contributed more than half of the monthly all items seasonally adjusted increase. The index for food rose 0.9 percent, with the index for food at home increasing 1.2 percent. The energy index increased 1.3 percent, with the gasoline index rising 1.2 percent.
The index for all items less food and energy rose 0.2 percent in September, after increasing 0.1 percent in August. Along with the index for shelter, the indexes for new vehicles, household furnishings and operations, and motor vehicle insurance also rose in September. The indexes for airline fares, apparel, and used cars and trucks all declined over the month.
The index for all items less food and energy rose 4.0 percent over the last 12 months, the same increase as the period ending August. The energy index rose 24.8 percent over the last 12 months, and the food index increased 4.6 percent over that period.


U.S. JOLTS: August Job Openings Fall from Record
The Bureau of Labor Statistics reported that on the last business day of August, the level of job openings fell 5.9% (+61.8% y/y) in August to 10.439 million from the record 11.098 million in July, revised from 10.934 million. The total job openings rate fell to 6.6% from the record 7.0% in July, revised from 6.9%. The job openings rate is calculated as job openings as a percent of total employment plus jobs that have not yet been filled.
The level of hiring fell 6.5% (-1.7% y/y) as the hiring rate declined to 4.3% in August from 4.6% in July. The rate remained higher than the 3.8% low this past January. The overall layoff & discharge rate returned to the record low of 0.9% from an upwardly revised 1.0% in July. The quits rate rose to a record 2.9% in August, remaining above a low of 1.6% in April 2020. The JOLTS figures date back to December 2000.
The private-sector job openings rate eased to 7.1% from the record 7.4% in July. It has increased from 3.6% April 2020. (…) The private sector hiring rate declined to 4.8% in August, though it remained up from January’s 4.2% low. It remained well below the record 7.2% in May of last year. The level of private sector hiring declined 4.1% in August (+2.8% y/y) to 6.01 million. (…)
Workers continue to look for new job opportunities. The private sector quits rate of 3.3% set a new record high, remaining well above 2.3% one year earlier. The rate has been trending higher since the low of 1.8% in the spring of 2020 and compared to a 0.8% rate in government. The August level of job quits in the private sector increased 48.2% y/y. In government, the level of quits rose 21.5% y/y.

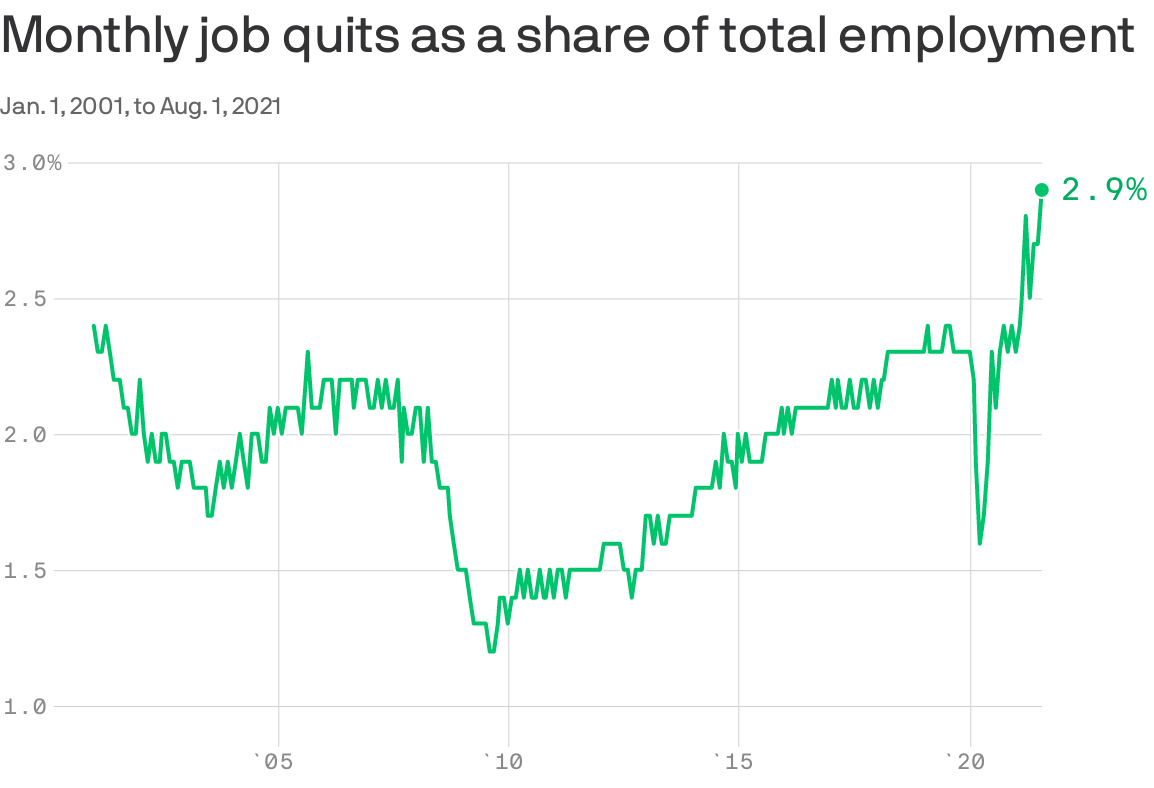 Data: FRED; Chart: Axios Visuals
Small Business Optimism Slips In September As Labor Shortages, Inflation Impact Business Operations


China’s Sept exports surprisingly robust despite power crunch Outbound shipments in September jumped 28.1% from a year earlier, up from a 25.6% gain in August. Analysts polled by Reuters had forecast growth would ease to 21%.
(…) China’s September imports rose 17.6%, lagging an expected 20% gain in a Reuters poll and 33.1% growth the previous month. (…)
“Lower import volumes of industrial metals add to evidence that environmental curbs and cooling construction activity are weighing on heavy industry.”
However, China’s energy demand is rapidly rising.
The volume of coal imports in September rose to their highest this year as power plants scrambled for fuel to boost electricity generation to ease the power crunch and replenish inventories ahead of the winter heating season.
Natural gas imports in September also rose to their highest since January this year. (…)
IMF Cuts Global Growth Forecast, Warns on Inflation The International Monetary Fund’s latest World Economic Outlook report cites the spread of the Covid-19 Delta variant and says the foremost policy priority is to vaccinate an adequate number of people in every country to prevent dangerous mutations of the virus.
(…) The IMF cut its global growth forecast for 2021 to 5.9% from 6% in its July report, a result of a reduction in its projection for advanced economies to 5.2% from 5.6%. The reduction mostly reflected problems with a global supply chain that caused a mismatch between supply and demand.
For emerging markets and developing economies, the outlook improved. Growth in these economies is pegged at 6.4% for 2021, up from an estimate of 6.3% in July. The uptick reflected stronger performances by some commodity-exporting countries amid rising energy prices.
The group maintained its view that the global growth will moderate to 4.9% in 2022.
Among leading economics, the growth outlook for the U.S. was trimmed 0.1 percentage point to 6% this year, while the projection for China also was reduced by 0.1 percentage point to 8%. Several other major economies saw their outlook cut, including Germany, whose economy now is projected to grow 3.1% this year, down 0.5 percentage point from its July forecast. Japan’s outlook was lowered by 0.4 percentage point to 2.4%. (…)
The IMF now expects consumer-price inflation in advanced economies to reach 2.8% in 2021 and 2.3% in 2022, up from 2.4% and 2.1%, respectively, in its July report. Inflationary pressure is even more pronounced in emerging and developing economies, with consumer prices rising 5.5% this year and 4.9% next year.
IMF economists say that inflation outlook is “highly uncertain” due to the unprecedented nature of the current recovery. Despite the upward revision in its price projections, the forecast for inflation to return to pre-pandemic levels is based on an ample labor supply in advanced economies that should weigh on wages.
The IMF economists warn, however, some factors could add persistent inflationary pressure. Among them: a shortage of housing boosting real-estate prices and rent ahead of new construction. Higher import prices of food and oil will also keep consumer prices elevated in emerging and developing countries. Prolonged supply disruptions too might push businesses to increase prices, leading to stronger demand for wage increases from workers.
“Should households, business and investors begin anticipating that price pressure from pent-up demand…to persist, there is a risk that medium-term inflation expectations could drift upward and lead to a self-fulfilling further rise in prices,” IMF economists wrote. They added that, for now, there are “no signs of such a shift.” (…)
Yesterday from the NY Fed: Short- and Medium-Term Inflation Expectations Continue to Rise
Median short-term (one-year-ahead) inflation expectations increased by 0.1 percentage point in September to 5.3%, the eleventh consecutive monthly increase and a new series high since the inception of the survey in 2013. Median medium-term (three-year-ahead) inflation expectations also increased, to 4.2% from 4.0%, representing the third consecutive monthly increase and a new series high. However, as reported in a recent blog post, longer-term (5-year ahead) inflation expectations still appear to be as well anchored as they were two years ago, before the start of the pandemic.

- “Much Slower Growth”
“Beyond early 2022, however, we see a return to a more traditional slowdown narrative. The positive growth impulses from Delta improvement, pent-up saving, and inventories are all relatively short-term in nature, and they will increasingly struggle to offset the drag from fiscal policy as the year progresses. Even if President Biden manages to pass most of his longer-term fiscal plans—an assumption subject to clear downside risk—we estimate a fiscal impulse of -3pp over the next year. In our forecast, this pushes US growth below 2% by late 2022, when reopening, pent-up saving, and the inventory cycle should have largely played themselves out”. (GS)

(Bloomberg, Goldman Sachs Global Investment Research)
- Apple set to cut iPhone production goals due to chip crunch.
Fed’s Bostic: Inflation Surge Will Likely Last Longer Than Expected The Atlanta Fed leader said that while inflation has surged more than he and others had expected and runs the risk of being more persistent than desired, he still believes price pressures will ease over time.
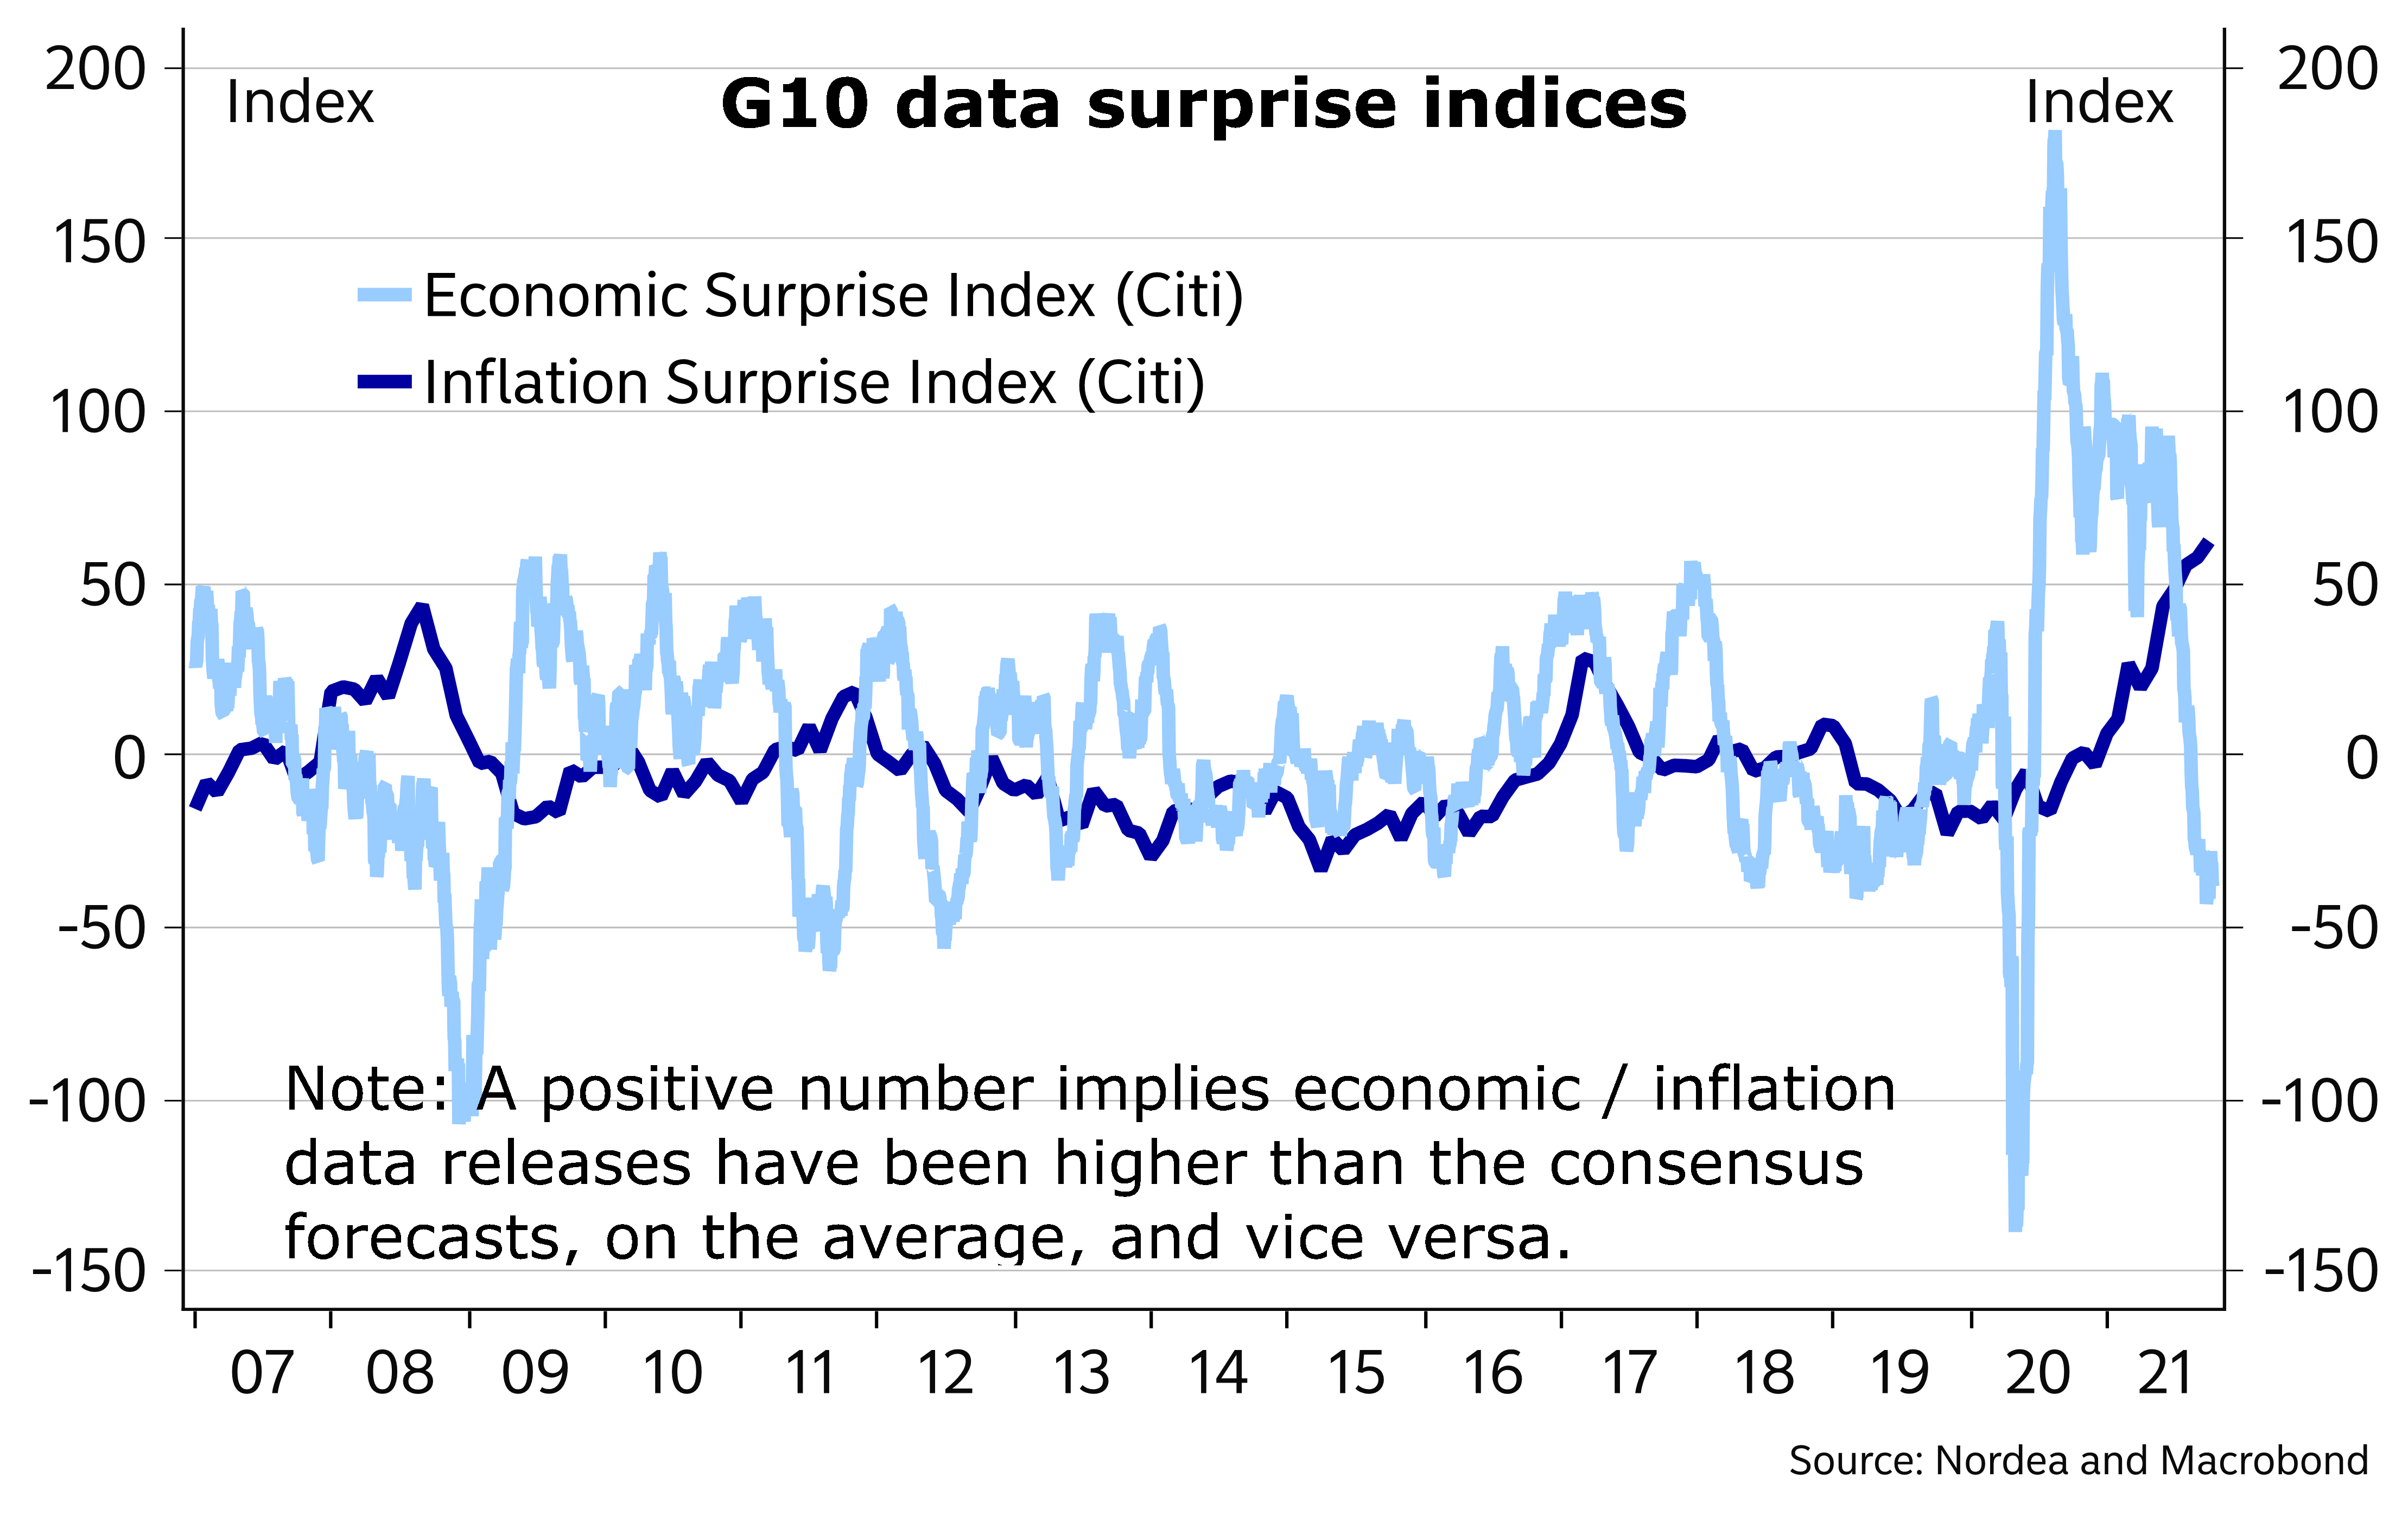
Activity data lost momentum, but inflation data continue to exceed expectations
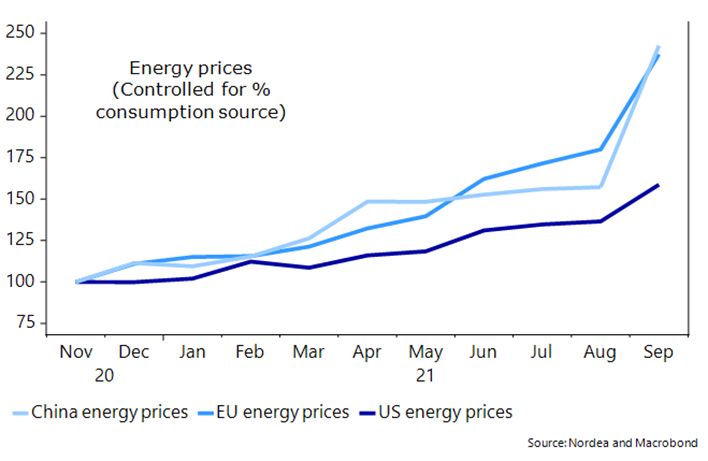
We have constructed an energy consumption price index for China, Europe and the US , which also reveals how the US is clearly less hit by the current energy squeeze compared to China and the Euro area. This is another argument why the USD will stand strong over winter as one should expect less adverse effects in the US economic momentum from the energy price squeeze compared to peers. We see EUR/USD headed towards levels around 1.10 over the coming 12 months, with the move likely to occur sooner rather than later. We also expect the USD to strengthen versus all Scandi currencies.
The US economy will be less hit by the energy price squeeze than China and Europe

- Chile Preps Faster Rate Hike as Inflation Soars Chile’s central bank will likely speed up the pace of interest rate increases as inflation soars and lawmakers weigh even more stimulus for one of the world’s fastest growing economies.
The bank will raise its overnight rate by a full percentage point to 2.5% on Wednesday, according to eight of 14 economists in a Bloomberg survey. Five others expect a second straight hike of 75 basis points, while one is betting on a increase of 150 basis points. (…)
Since the central bank’s last rate-setting meeting in August, Chile’s congress has advanced a proposal for a fourth round of early pension withdrawals that, if approved, would pump as much as $20 billion into an already red-hot economy, according to the Finance Ministry. (…)

L.A. Port to Operate Around the Clock to Ease Logjams, White House Says The White House is expected to announce a pledge from one of the country’s busiest ports to operate around the clock, a move aimed at easing cargo bottlenecks that have led to shortages and higher consumer costs.
By going to 24/7, the Port of Los Angeles will join the neighboring Port of Long Beach, Calif., which started doing the same thing last month. Major ports in Asia and Europe have operated around the clock for years.
Expanded operations at the Port of Los Angeles, which declined to comment ahead of the announcement, would nearly double the hours that cargo can move, according to the White House. It said the extra shifts have been agreed to by the International Longshore and Warehouse Union, which represents dock workers. (…)
Tens of thousands of containers are stuck at the Los Angeles and Long Beach ports, the West Coast gateways that move more than a quarter of all American imports. Dozens of ships are lined up to dock, with waiting times stretching to three weeks. (…)
When the Port of Long Beach initially launched its expanded hours, it failed to attract more trucks, with operators saying the process was burdensome. (…)
Europe’s trucker shortage becoming ‘extremely dangerous’ Dearth of drivers blamed on soaring demand, low wages and poor working conditions
Kellogg’s cereal strike is latest sign of pushback from US snack makers Factory workers leverage tight labour market to demand better conditions after gruelling pandemic
EARNINGS SEASON BEGINS
U.S. companies have some ground to make up as they start releasing third-quarter results this week. What might be called earnings pre-season for the S&P 500 Index didn’t go that well. Out of 21 companies that reported in the four weeks ended Friday, only nine saw their shares rise on the first trading day, according to data compiled by Bloomberg. The entire group lost 1.2% on average and had a median decline of 0.7%. (Bloomberg)

Recall that for the 21 S&P 500 companies that have reported Q3 so far, the beat rate is 76% (prior 4 quarters 85%) and the earnings surprise factor is +4.1% (prior 4 quarters +18.3%).
Social Security Payments Could Increase the Most in 40 Years Cost-of-living increase expected to be near 6% for 2022, reflecting strong inflation.
(…) Roughly half of Americans aged 65 and older relied on Social Security for 50% or more of their income in 2019, according to an AARP analysis of Census Bureau data. About a quarter of seniors 65 and older relied on the benefits for 90% or more of their income, the analysis found. (…)
The Social Security Board of Trustees in an August report said the trust fund that pays benefits is projected to become depleted by 2034, a year earlier than estimated in 2020. At that time, Social Security income would be sufficient to pay about 78% of scheduled benefits. (…)
US overtakes China as biggest bitcoin mining hub after Beijing ban Crackdown on digital currencies knocks country’s share of crypto production to zero
