Labor Shortage Holds Back Hiring U.S. job growth fell to the slowest pace of the year in September, with payrolls rising by 194,000, a sign the Delta variant and a persistent shortage of workers weighed on the economic recovery.
(…) Many workers gave up the job search and exited from the labor force last month. The smaller pool of labor meant that despite the slowdown in hiring, the unemployment rate fell to 4.8% last month from 5.2% in August. (…)
“This was the time when a lot of people were expecting labor shortages to be getting better, but in fact they’re getting worse,” said Michael Pearce, senior U.S. economist at Capital Economics. “It’s a pretty worrying situation.” (…)
Private-sector employers hired at a decent clip—adding 317,000 jobs last month. (…)
Public-sector jobs, mainly at schools, fell by 123,000 last month. (…)
Schools have since reopened, but the government said hiring in that sector was lower than usual in September. “Recent employment changes are challenging to interpret, as pandemic-related staffing fluctuations in public and private education have distorted the normal seasonal hiring and layoff patterns,” the Labor Department said in its release Friday.
The number of workers who cited the pandemic as the reason they didn’t look for jobs rose last month for the first time since January, reaching 1.6 million. That is a sign that fears of the Delta variant scared off many job seekers. (…)
The average hourly pay of private-sector workers climbed 0.6% in September from August, as employers raised wages to compete over a shrunken pool of workers. Compared with a year earlier, wages rose 4.6%, a pickup from prior months. Existing employees are also increasing the hours they work during the week to make up for the labor shortage. (…)
With the expiration of enhanced jobless benefits, rising vaccination rates and higher wages, many economists predicted that workers would resume the job search. But last month, the labor-force participation rate—or the share of workers with a job or actively looking for one—dipped slightly to 61.6%, down from 63.3% in February 2020 ahead of the pandemic. (…)
Some more facts:
- even with the 169k upward revisions for July and August, this is a very weak report;
- government employment declined 0.5% MoM in September. It barely rose in August and is still below its August 2020 level and 3.7% lower than pre-pandemic;
- private employment is also swooshing, crawling up at a +0.3% monthly rate over both the past 15 and the past 6 months. At that rate, it will be 2035 before the economy recovers the 5.5 million (4.3%) private employees missing since February 2020. (It took 7 years after the GFC);
- the important 25-54-year old cohort saw its participation rate fall to 81.6% from 81.8%, a 4-month low. It was 83% in January 2020;
- the participation rate of the 55-64 cohort is actually stable and in line with its pre-pandemic level;
- workers 65+ are simply not coming back: their participation rate is stuck at 23.4% from 26.0% (and rising) pre-pandemic;
- the annualized growth rate in private average hourly earnings went from +3.2% in Q4’20 to +3.8% in Q1’21, +4.6% in Q2 and +5.1% in Q3.
We can no longer invoke statistical quirks and compositional biases: the U.S. labor market is tight and wages are rising at an accelerating rate. And yet, the participation rate is stuck at its lowest level since the mid-1970s.
Last March, BofA reckoned that more than 40% of the so-called labor slack is due to structural issues that will persist. That is proving right.

ING illustrates that all of he jobs lost since the pandemic reside in 3 sectors: leisure & hospitality, education and health and government. The rest of the economy is back to where they were pre-pandemic, and yet worker shortages are broad and very acute. The reality is that the pandemic fiscal and monetary stimulation has boosted demand well above before Covid-19 but the supply side is not capable to meet that burst just yet.
Employment by sector – peak to trough and peak to current (millions of jobs)
Source: Macrobond, ING
The FOMC finds itself in a very uncomfortable position: the labor market is totally unbalanced with tremendous demand for 11 million jobs but actual supply stuck at a very low level, partly due to the pandemic but partly due to its own policies. Accelerating wages and various other incentives have yet to reach the appropriate clearing level.
Clearly, the Fed needs to review its premises on the labor market:
- the participation rate is stuck even with the re-opening, the end of rescue payments and average hourly wages 8.2% above their pre-pandemic level;
- half of all states ended pandemic subsidies in July without any signs of workers coming back so far;
- early retirement has clearly become an attractive option for homeowners and 401k pension holders, largely thanks to the Federal Reserve policies;
We are entering the peak consumption period of the year with Americans cash and asset rich, a booming labor market and business owners eager to take advantage of the strong demand and thus willing to pay up for labor, confident they can easily offset their increased costs with higher prices.
Last week, the National Federation of Independent Business survey “showed record highs for companies with vacancies they can’t fill, the proportion of companies that are raising compensation and the proportion that are set to hike compensation even further in coming months. Elevated quit rates suggest that companies may also have to do so to retain the staff they currently have. Either way, it points to more inflation pressures for the Fed to respond to.” (ING)
NFIB survey shows firms can’t find workers and are raising pay aggressively 
While stuff supply issues will eventually abate, albeit later than assumed, higher labor compensation will prove stickier.
So we all need the Fed’s other major assumption to prove right: labor productivity must increase sustainably.
Even more so since unit labor costs, which had declined in the last 2 recessions, are up 2.6% in Q2 from their pre-pandemic level and surely up more in Q3 given accelerating wages against slowing demand.

Thankfully, measured productivity is up 4.6% from its pre-pandemic level, but it always rises immediately after a recession as business output initially recovers faster than hours worked. This time around, the bounce is much less pronounced and is already back down to its pre-recession range.

Reading various corporate conference call transcripts, productivity is a broadly missing word, while recent or planned “price increases” are mentioned by virtually every company in every sector of the economy. Also prevalent are comments about training costs, supply chain challenges, component shortages, etc.. So far, micro info suggests that macro productivity is not saving us…
While technological advancements can help productivity, their costs, both human and physical, are also rising fast.
This while demand was booming as the economy was recovering amid the re-opening and extraordinary fiscal and monetary stimuli.
But GDP is now seen rising only 1.3% in Q3 and the fiscal impulse is fading.
And China and Europe are dealing with a serious energy crisis.
Plus China’s Evergrande moment.
And inflation is stealthily eroding Americans’ purchasing power.
Aggregate weekly payrolls (employment x hours x wages) rose 1.4% MoM in September on 0.6% jumps in both hours worked and wages against the weak 0.1% rise in employment. Labor income (black) has lagged CPI inflation (yellow) since February 2020. As rescue payments vanish, consumers will start to feel the pinch of rising prices, particularly energy and other essentials.

Note that September’s 1.4% jump in labor income is unsustainable as hours worked, at 34.8, are well above the historical average of 34.4. Unless employment and/or wages accelerate, diminishing real take-home pay will hurt consumer spending.
High savings will likely save this holiday season. In fact, Christmas may come early this year as consumers are advised to shop early to avoid empty shelves. But the underlying fundamentals are rapidly weakening owing to slow employment growth and accelerating inflation.
Here’s how Fiera Capital’s strategists present their recently introduced 40%-probability “Stagflation” scenario:
A growing risk to our base case scenario [“Reflationary Recovery”: 50% probability] is that the world economy turns stagflationary in nature, a toxic combination of slowing global
growth and accelerating prices. The “Stagflation” scenario assumes that inflationary pressures shift persistently higher and de-anchor
inflation expectations, with global economic prospects subsiding amid the fallout.Specifically, the near-term spike in pricing pressures
proves more enduring than expected, and lasts long enough to become embedded in inflation expectations. Supply-chain dislocations take
longer to correct, while shortages and subdued participation in the labour force become more long-lasting given lingering health-related
fears of returning to work, the structural shift in demographics (ageing populations), or skills mismatches in the post-pandemic reality.
The conundrum is not easier for investors who must now
- incorporate in their economic guesswork a Federal Reserve tortured by a slowing economy (the FOMC has made employment its main preoccupation) and the pressure to address rising inflation expectations, perhaps through faster and potentially stronger rate hikes than widely broadcasted;
- assess the potential damage to corporate profits as rising wages are compounding the impact of enduring component shortages, rising supply chains costs and increasing energy bills, while real revenue growth slows down.
Goldman Sachs:
During the last 60 years, the S&P 500 has generated a median real total return of +2.5% per quarter, but that quarterly return fell to -2.1% in stagflationary environments, worse than the median returns in environments characterized solely by weak economic growth or high inflation.
Most of the equity market weakness in historical stagflationary environments has been attributable to pressure on corporate profit margins. Stagflation has been associated with stable real revenues but declining profit margins and real earnings, indicating companies struggling to raise prices quickly enough to offset rising input costs. In addition to the earnings headwinds, P/E multiples have also declined modestly during stagflationary periods alongside rising interest rates.
Goldman strategists are not overly concerned, asserting that “the current pace of inflation is transitory” and that supply chain concerns and energy costs will abate. Basically the Powell scenario…
Henry McVey, KKR’s brilliant head of Global Macro and Asset Allocation, agrees that “goods” inflation pressures will subside, but likely only by mid-to late 2022.
While we expect goods inflation pressures to subside eventually, we do see inflationary pressure bubbling up in other areas. Specifically, we look for potential for increases in core services inflation, including items such as rents, healthcare, and education. All told, these three categories account for more than half of the overall U.S. CPI basket, and have remained surprisingly tame across most key categories — thus far — in 2021. However, when we forecast these inputs in 2022, they are all poised to increase materially, with household rents leading the way.
McVey disagrees with Goldman strategists on energy costs:
Somewhat ironically (and concerning), the shift towards more environmentally friendly energy production is actually inflationary, we believe, which could ultimately put upward pressure on rate forecasts over time. Simply stated, there has not been enough investment in some of the key inputs to make the energy transition a reality. Also, because old economy sectors, including oil and natural gas, have seen their capital expenditures slashed, prices of these commodities are likely to further appreciate more than the consensus may think, we believe.
So, against this backdrop, we see inflation being more persistent for longer than the consensus now thinks. Maybe more important, though, is that there is now likely to be more volatility around monthly inflation reports, given the aforementioned considerations around the global energy transition.
Inflation angst is thus likely to persist well into next year and while KKR does not expect “runaway inflation”, it sees a higher “resting rate” relative to the pre-pandemic norm and “with upside volatility”.
For corporate earnings however, so far so good, although some things are changing: 21 S&P 500 companies have reported Q3 so far: the beat rate is 76% (prior 4 quarters 85%) and the earnings surprise factor is +4.1% (prior 4 quarters +18.3%). Analysts are on hold since mid-September, awaiting Q3 results, conference calls and guidance in these uncertain times.


There is no doubt that corporate costs are rising broadly. So far, however, margins are holding up because revenues are solid against a weak base. But
- the base effect will vanish in 2022:

- analysts seem to be overestimating revenue growth next year, likely extrapolating that the current “goods” economy will continue forever. Based on this chart from Ed Yardeni, sustained high nominal GDP Goods growth would necessitate higher “goods” inflation than what everybody now assume.

- demand for goods is 29% above trend and is already mean-reverting: the surprise will likely be negative in 2022.

- business sales, highly correlated with S&P 500 revenues, are already decelerating:

- the Atlanta Fed’s Survey of Business Uncertainty measures the one-year-ahead expectations and uncertainties that firms have about their own employment and sales. The sample covers all regions of the U.S. economy, every industry sector except agriculture and government, and a broad range of firm sizes. Sales growth expectations peaked at 6.5% in July and declined to 5.3% in September. Pre-pandemic, expectations were generally in sync with actual business sales although 2019 expectations proved overoptimistic.

In all, 2022 could prove a no-win year for equity investors. Current analysts revenues forecasts seem too high which would likely mean lower margins and anemic profits. That is unless goods demand remain strong, which would likely mean higher goods inflation and Fed intervention. Here’s how Fiera Capital views how the stagflation scenario could unfold:
The subsequent rise in input costs and the rapid buildup in wages cuts into the profitability of corporations, consumers struggle to maintain their purchasing power, and inflation expectations become de-anchored. In response, policymakers abandon their perceived tolerance for higher inflation and act aggressively to stem the inflationary spiral. This assertive and hawkish-leaning policy adjustment sparks a moderation in global growth to well-below potential levels. The stagnation in global growth occurs concurrently with an acceleration in inflation and tighter monetary policy, creating a tumultuous financial market landscape whereby both equities and bonds experience declines amid a marked deterioration in the macroeconomic landscape.
Keep in mind that Fiera’s base scenario is one of “Reflationary Recovery”
Our base case scenario calls for the global economic recovery to extend at an above-trend pace over the next 12 to 18 months, without the fear of a premature monetary policy tightening event. The successful rollout of several safe and effective vaccines and/or treatments ultimately accelerates the return to economic normality. As the wider population gets inoculated and as virus trends improve, both isolationism and social distancing measures abate and sentiment improves drastically. Restrictions are relaxed and the reopening progresses across the larger economy. In response, economic activity snaps back dramatically as pent-up demand is unleashed, particularly given that savings remain extraordinarily elevated across the globe, which amplifies the nascent recovery.
Meanwhile, inflation expectations remain well-anchored, which allows policymakers to look through the post-pandemic surge in inflationary pressures and extend their highly accommodative monetary policy stance. While central bank asset purchases are indeed set to be scaled-down through 2022, the bar for interest rate increases remains higher over this 12-18 month timeframe.
Nevertheless, both the Federal Reserve and the Bank of Canada begin the gradual rate normalization process by mid-2023 given that their respective economies will be operating at full potential and output gaps will be closed. Still, the policy transition from extremely stimulative towards a neutral stance occurs progressively over several years, extending the longevity and visibility of the economic cycle.
This is their best case scenario with a 50% probability. Yet, the strategy forecasts 10-year Treasury rates to double to 3.0% during 2022 and the S&P 500 to mark time around 4300 based on 20 times $215 profits.
The “Stagflation” scenario sees 10Y yields reaching 3.5%, short-term rates at 1.25% and the S&P 500 correcting to 3900.
TECHNICALS WATCH
I survey but a few technical indicators, those with smart and sensible underpinnings with proven usefulness. For me, they essentially complement the fundamentals, helping on timing. Lowry’s Research and CMG’s Trade Signals featuring some Ned Davis charts and some of their own measures are my favorite go-to’s.
- Lowry’s narratives have been spot on throughout this cycle. Their cautious stance has not changed last week.
- CMG’s 13/34–Week EMA Trend Chart is threatening and the large gap between the 13w and the 34w lines is danger for a quick correction:

Goldman and JPMorgan Say Buy the Dip as Inflation Seen Temporary
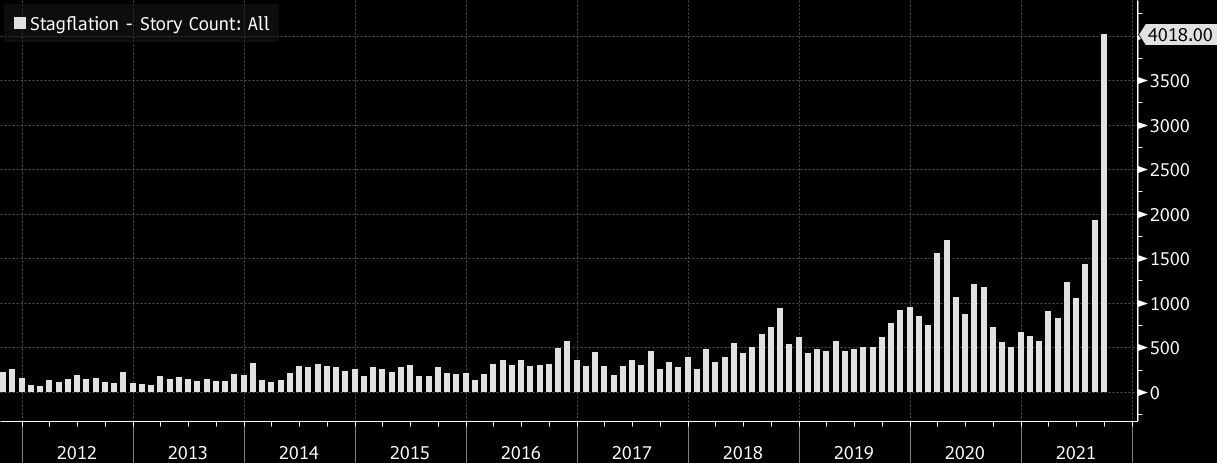
(…) A Deutsche Bank AG survey of market professionals suggested that the majority of them see at least another 5% pullback in equities by the end of the year. There’s “a fairly strong consensus” that some kind of stagflation is more likely than not, according to the survey results published Monday. (…)
“We believe this dip will prove a good buying opportunity, as 5% pullbacks usually have in the past,” Goldman strategists said. “We finally got some weakness after 330 days of no greater than 5%+ pullback, but we don’t expect it to last, and advise to buy into the dip,” JPMorgan strategists wrote.
Goldman’s team, led by Jan Hatzius, said in a report on Sunday that they now expect growth of 5.6% on an annual basis in 2021 versus their previous estimate of 5.7%, and 4% next year, down from 4.4%. The declines were mostly offset by upgrades to their projections for the following two years.
“After updating our estimates of the key growth impulses that drive our consumption forecast—reopening, fiscal stimulus, pent-up savings, and wealth effects—and incorporating a longer-lasting virus drag on virus-sensitive consumer services spending, we now expect a more delayed recovery in consumer spending,” the economists said.
That, along with the assumption that semiconductor supply won’t improve until the second half of next year and that inventory restocking will be postponed, “argues for a less front-loaded recovery from here than we had expected,” they said. (…)
(…) For now, the feeling of many is that inflation has lingered longer than most predicted. As Huw Pill, the Bank of England’s new chief economist, said last week, the “balance of risks is currently shifting towards great concerns about the inflation outlook, as the current strength of inflation looks set to prove more long-lasting than originally anticipated.”
Not all are as concerned or looking to change tack. Officials at the European Central Bank and Bank of Japan are among those intending to keep stimulating their economies aggressively. And the International Monetary Fund predicts that in advanced economies at least, inflation will soon ease to about 2%. (…)
China’s coal futures hit record high as floods worsen energy crisis Mine closures intensify power crunch that has forced rationing and rattled global markets

(TS Lombard via The Market Ear)
Here comes the energy surcharges
Energy surcharges to be implemented to avoid production shutdowns in long products: ArcelorMittal has announced to customers that it will start implementing an energy surcharge of EUR 50/t to offset the sharp increase in electricity and natural gas costs (x2 MoM; 3x YoY). The steelmaker is the market leader in the fragmented European long steel market (~15% market share) which mainly produces steel using EAFs that are much more reliant on electricity than blast furnaces and flat steel production in general. MT’s EU long business represents 25% of its European capacity and 15% of the group. MT (+) notes that its cost base has moved +EUR 120/t higher over recent months (in-line with our own estimates – see chart below) with electricity prices up to EUR 160-200/MWh from the usual EUR 55/MWh, while gas is at EUR 100/MWh versus EUR 20/MWh. The steelmaker added that “considering the magnitude of these increases, it is no longer possible for ArcelorMittal to continue to absorb these costs alone”. MT is not alone in trying to stave off this energy inflation.
(Exane via The Market Ear)

Monster Jobs Report Boosts Canada, But It Hasn’t Fully Healed
The country’s economy added 157,100 jobs in September, returning the labor market to pre-pandemic levels, Statistics Canada said Friday in Ottawa. That compares with economists’ expectation of 60,000 new jobs, according to the median estimate in a Bloomberg survey.
The unemployment rate fell to 6.9% from 7.1% in August. Hours worked were up 1.1% in the month but remain 1.5% below their pre-pandemic level. (…)
Canada’s job gains were driven entirely by full-time workers while part-time employment fell slightly. The increases were led by the public administration, information culture and recreation sectors. Around 139,000 people entered the labor force in September, bringing the participation rate to 65.5%, also the highest since before the pandemic.
(…) That shortfall is an important consideration for the Bank of Canada, which released a paper on the subject of labor market slack earlier this week. Policymakers led by Governor Tiff Macklem have argued that a complete recovery requires employment to exceed pre-pandemic levels due to factors like population growth.

The Pandemic’s Over for Big Banks. Now Comes the Hard Part. Bank profits are expected to plateau, exposing weak growth in banks’ core businesses.
(…) Those pandemic blips concealed lackluster growth in banks’ lending business and temporarily swelled trading revenue. Analysts are trying to figure out what the new normal looks like. (…)
Total loans at U.S. banks are up just 1% since the end of June, according to Federal Reserve data.
Last quarter, bank executives said increased credit-card spending, especially on travel and dining, would fuel loan growth. Instead, customers are paying off their balances and businesses aren’t drawing down loans, executives have said at recent conferences. Hopes are now resting on the coming holiday season. (…)
Net interest margin, the amount banks make on lending minus what they pay on deposits, fell again in the second quarter, plumbing a new low, according to the Federal Deposit Insurance Corp.
Analysts aren’t predicting much of an improvement in the third quarter. At the four biggest banks—JPMorgan, Bank of America Corp. , Citigroup Inc. and Wells Fargo & Co. —analysts expect both lending profits and margins to remain flat for the fifth straight quarter. (…)
Stock-trading revenue is still above pre-pandemic levels, bank executives have said at recent conferences, but fixed-income revenue is expected to tumble. (…)
Still, one big business is booming: investment banking. Global mergers are on a record pace and underwriting volumes are high, particularly for initial public offerings and high-yield bonds. (…)
CHINESE COCKROACHES
Beyond Evergrande, China’s Property Market Faces a $5 Trillion Reckoning Developers have run up huge debts. Now home sales are down, Beijing is imposing borrowing curbs and buyers are balking at high prices.
As China enters what many economists say is the final stage of one of the largest real-estate booms in history, it is confronting a staggering bill: More than $5 trillion in debt that developers took on when times were good, according to economists at Nomura Holdings Inc.
That debt is nearly double what it was at the end of 2016 and is more than the entire economic output of Japan, the world’s third-largest economy, last year.
Global markets are braced for a possible wave of defaults, with warning signs flashing over the debt of about two-fifths of development companies that have borrowed from international bond investors.
(…) one of the biggest economic challenges Chinese leaders have faced in years, and one that could reverberate globally if mismanaged. (…)
Total sales among China’s 100 largest developers were down by 36% in September from a year earlier, according to data from CRIC, a research unit of property services firm e-House (China) Enterprise Holdings Ltd. It showed that the 10 biggest developers, including China Evergrande, Country Garden Holdings Co. and China Vanke Co. , saw sales down 44% from a year ago. (…)
Presales and similar deals were the sector’s biggest funding source this year through August, according to the National Bureau of Statistics of China. (…)
The median apartment in Beijing or Shenzhen now costs more than 40 times the median family annual disposable income, according to J.P. Morgan Asset Management. (…)
As restrictions on borrowing imposed last year kicked in, housing construction tumbled in August to 13.6% below its pre-pandemic level, calculations by Oxford Economics show.
The revenue local governments earn by selling land to developers fell by 17.5% in August from a year earlier. Local governments, which are also heavily indebted, count on land sales for much of their revenue.
A further slowdown also would risk exposing banks to more bad loans. Outstanding property loans—primarily mortgages, but also loans to developers—accounted for 27% of China’s total $28.8 trillion in bank loans at the end of June, according to Moody’s Analytics. (…)
The largest U.S. home builder by revenue, D.R. Horton Inc., reported $21.8 billion of assets at the end of June. Evergrande had some $369 billion. (…)
The real-estate giants have borrowed not only from banks but also from shadow-banking outfits known as trust companies and from individuals who put their savings into investments called wealth-management products. Abroad, they became a mainstay of international junk-bond markets, offering juicy yields to get deals done. (…)
Goldman Sachs Group Inc. analysts recently estimated Evergrande had the equivalent of $156 billion of off-balance-sheet debt and contingent liabilities, including mortgage guarantees to help home buyers get loans. (…)
Homeownership is already over 90% for urban households in China, among the highest in the world, according to Mr. Rogoff and Ms. Yang. They cited earlier Chinese research saying that as of late 2018, 87% of home purchases were by buyers who already had at least one dwelling. (…)
 (
(