U.S. Consumers Ramped Up Spending in August U.S. consumer spending rose 0.8% in August, signaling the U.S. economic recovery was gaining steam heading into autumn.
Personal outlays on goods and services rose 0.8% in August from the month before, after a 0.1% decrease in July, the Commerce Department reported Friday.
Personal income increased 0.2% in August, reflecting wage gains and the federal government’s distribution of child tax credits. Those were partly offset by declines in unemployment insurance as many states ended pandemic-related supplemental payments, the Commerce Department report noted. (…)
Prices, excluding the volatile food and energy categories, rose 3.6% in August from a year earlier, matching annual increases in June and July, Friday’s Commerce report showed. In January, before widespread reopenings and vaccinations triggered a surge in demand, core prices rose just 1.5% from a year earlier.
Spending on services—the bulk of overall outlays—increased 0.6% in August from July, a slowdown from earlier in the summer but still a solid pace. (…)
Pity that the WSJ would offer such limited info on the most important economic data. Haver Analytics provides the important stats:

- Wages and Salaries rose 0.5% MoM in August, a 6.0% annualized rate and +9.5% YoY. June and July data were revised up. Last 3 months: +10.4% annualized. Aggregate W&S are now 6.0% above their pre-pandemic level while total employment is 3.5% below. If this ain’t rising wages…
- Disposable income, impacted by reduced rescue payments, rose only 0.1% in August but is up 4.9% annualized in the last 3 months.
- Consumption expenditures jumped 0.8% after -0.1% (revised from +0.3%) and +1.1%. Last 3 months: +7.4% a.r.. Americans keep dissaving.
- Core PCE inflation, the Fed’s preferred inflation gauge, increased 0.3% for the second consecutive month (+3.7% a.r.). It is up 4.5% a.r. in the last 3 months and 5.2% a.r. in the last 4 months. Slowing but still high.
- Increasingly significant is the rapid increase in headline inflation as the costs of essentials such as food and energy are accelerating. Total PCE inflation rose 0.4% MoM in both August and July and is up 5.3% a.r. in the last 3 months.
Americans are thus not significantly impacted by the decline in rescue payments and rising prices, just yet.
As the chart below shows, PCE inflation (pink) is now rising faster than disposable income and labor income, this while employment (black) is only slowly recovering.

So the WSJ headline “the U.S. economic recovery was gaining steam heading into autumn” is misleading. The economic steam does not come from spending, it comes from trends in real spending power which is now eroding at a worrying pace. While savings are high, they are concentrated in but a small segment of the population. That might save Christmas, but not 2022 unless inflation slows down or employment accelerates.
The truth is that the U.S. has an inflation problem and it better be transitory: Last 6 months annualized:
- Total CPI: +7.5%
- Total PCE inflation: +6.1%
- Core CPI: +6.5%
- Core PCE inflation: +4.5%
Energy inflation is 24.9% YoY in August. Yes there is a base effect here but it’s still up 22.0% annualized in the last 3 months, 20.3% in the last 6.
Food inflation is only 2.8% YoY, but there is also a base effect here (they work both ways). Food prices are up 7.4% annualized in the last 3 months, 5.5% in the last 6.
Durable goods prices are up 7.0% YoY and 9.1% annualized in the last 3 months, 13.4% in the last 6.
And prices of services, still impacted by weak demand, are up 3.6% YoY and 4.5% annualized in the last 3 months, 4.9% in the last 6.
There are so many ways to skin the inflation cat. Goldman Sachs is among the transitionists:
We expect that ongoing supply chain disruptions will raise the prices of some goods further above the pre-pandemic trend and boost core inflation through end-2021. However, declines in durable goods prices are likely to drive inflation lower next year, more than offsetting a sharp acceleration in shelter inflation.
We forecast core PCE inflation of 4.25% at end-2021 (vs. 3.9% previously), 2.00% at end-2022, 2.15% at end-2023, and 2.20% at end-2024 based on our bottom-up inflation model.
A top-down model projects that inflation will rise only modestly above 2% in 2023-2024.
In brief, GS tells us that current inflation is much worst than expected but it will fall back right where we need it in due time. Yet, the same report reveals that:
-
Hotel prices and airfares down roughly 20% since the start of August.
-
The GS shelter inflation tracker jumped to +4.6% in August, pointing to a pickup in the official shelter series from its current +2.4% rate.
-
The GS composition-corrected wage tracker increased to +3.7% year-on-year — its highest level since 2007 — and the GS wage survey leading indicator has rebounded to +3.9% — its highest level since 2001.
-
Household inflation expectations remain near multi-year highs. The University of Michigan’s 5-10y measure edged up to 3.0% in September and the NY Fed’s 3y measure jumped to 4.0% in August. One-year expectations in both surveys remain above 4.5%.
-
The GS composite of seven business inflation expectations rose to the highest level in its two decade history.
-
The GS index of company price announcements is at the highest level since 2011, and mentions of the word “inflation” in this season’s Russell 3000 earnings calls were the most frequent since our series began in 2010.
But no worries,
Never mind that these financial market-implied measures are (still) heavily influenced by the Fed.
While many pandemic-driven price pressures are easing, broader sources of higher inflation are replacing them.
That is the message from a slew of alternative inflation measures that strip away price changes due to idiosyncratic swings in supply and demand, and home in on longer-lasting pressures.
(…) Fed Chairman Jerome Powell, asked last week whether inflation is now broader and more structural than earlier this year, responded, “Yes, I think it’s fair to say that it is.” (…)
From corporate conference calls (via The Transcript):
- “In the last few months, inflation has continued to ratchet it up, mainly with packaging and transportation costs. We’re experiencing the highest inflationary period of the last decade or even two, We, along with our peers and customers are also facing additional pressure on our supply chain due to strained transportation capacity and labor shortages and distribution.” – McCormick & Company (MKC) CEO Lawrence Kurzius
- “In addition to the significant supply challenges, raw material pricing remains highly elevated, and we are increasing our full-year raw material inflation outlook to be up a high-teens percentage compared to last year. We continue to combat these elevated costs with pricing actions across all of our businesses,” – Sherwin-Williams (SHW) CEO John G. Morikis
- “We instituted our fourth general price increase of the year on September 13th. The pace of incoming increases from our suppliers has subsided somewhat from earlier in the year but remains significant. Unfortunately, we have not been able to enact price increases on our goods as fast as we have incurred them from our material providers. The most glaring example is the escalation in ocean freight that has quintupled in the past twelve months, which affects not only our imported products but many of the components that are used in our domestic production” – Bassett (BSET) CFO J. Michael Daniel
- DHL Raising Rates for U.S. Shippers by 5.9%
 Could we get a nasty surprise from next Friday’s employment data?
Last week, Market News International wrote that a St. Louis Fed analysis of real-time employment data from Homebase suggests an 818k drop in September new jobs. The analysis is done by Maximiliano A Dvorkin and Asha Bharadwaj who wrote last August 4:
The correlation between the Homebase data and the monthly Current Population Survey (CPS, the household survey) continues to be very high. (…) Our indicator performed well in May and June, slightly over-predicting the recovery in employment relative to the CPS.
Well, Homebase also previewed the weak August data so a big miss in September is possible.
Note that initial unemployment claims rose in each of the last 3 weeks. Also, all but one Fed district non-manufacturing activity surveys were weak in September.
A decline in new jobs in September could be qualified as transitory if mainly the result of temporary slowdowns in services. It could also boost the meaning of the “stag” part in stagflation.
Last week, Jay Powell said “That’s the very difficult situation we find ourselves in.” It could well get even more difficult.
Gary Shilling, a smart economist, is also a transitionist and noflationist. He worries that the Fed will panic and start to tighten prematurely.
The Federal Reserve is planning to tighten credit even as forecasts call for U.S. economic growth to slow and the recent high inflation rates to recede. With just the smallest of missteps, the central bank risks either overkill, or a further loss in credibility. (…)
The increase in yields are vastly overdone. Over the entire post-World War II era, inflation accounts for 60% of Treasury bond yields, and significant inflation in future years is unlikely. China and other Asian economies are big producers and exporters but parsimonious consumers. So the supply of goods and services exceeds demand, a highly deflationary reality.
Other factors that depress inflation include aging populations worldwide that curtail consumer spending. (…)
It’s possible that Fed tightening will alleviate investors’ inflation fears, knowing that policy makers are awake at the switch. That could result in a flattening of the yield curve as the central bank pushes up short-term rates while long-term Treasury yields fall. But that scenario faces headwinds; a 100-basis-point rise in the overnight federal funds rate, the Fed’s policy rate, has historically resulted in a 36-basis-point rise in 10-year Treasury yields and a 24-basis-point boost in 30-year bond yields.
The Fed risks tightening to the point that it precipitates major financial problems and a recession. Also, a big rate hike could well reveal bankruptcy-inducing excess debt levels in a number of financial sectors, while areas that have seen excessive speculation, such as cryptocurrencies, SPACs and individual investors tied to Robinhood Markets Inc. are vulnerable. (…)
I believe the Fed will try to stop short of the credit tightening that would precipitate serious financial and economic problems. But it’s questionable that the Fed can fine-tune its policy enough to restore its credibility without pushing financial markets and the economy over the edge.
“That’s the very difficult situation we find ourselves in.”
September PMI data from IHS Markit signalled a substantial improvement in operating conditions across the U.S. manufacturing sector, albeit the slowest for five months. Despite rising markedly, production was often hampered by severe material and labour shortages, as supply chain disruption worsened. Demand conditions softened from the peaks seen earlier in the year, but both domestic and foreign client orders rose at historically elevated rates. Pressure on capacity was reflected in the fastest uptick in backlogs of work on record, as challenges expanding workforce numbers persisted.
On the price front, the pace of input cost inflation softened only slightly from August’s series record, causing firms to raise their charges at an unprecedented rate.
The seasonally adjusted IHS Markit U.S. Manufacturing Purchasing Managers’ Index™ (PMI™) posted 60.7 in September, down from 61.1 in August, but broadly in line with the earlier released ‘flash’ estimate of 60.5. The latest data indicated a marked improvement in the health of the U.S. manufacturing sector, despite being the slowest since April.

Contributing to sustained overall growth was a further expansion in output during September. The rise in production was strong, but eased to the slowest since March amid challenges related to material and labour shortages. Nonetheless, where an increase in output was noted, firms linked this to a further upturn in new orders.
Demand conditions across the manufacturing sector remained strong at the end of the third quarter, as new sales rose markedly. Alongside greater new business from new and existing customers, some firms suggested new order growth stemmed from client efforts to stockpile. In contrast to a slower upturn in new orders, foreign client demand strengthened in September. New export orders rose at the fastest pace for four months.
In line with a marked rise in new work, the level of outstanding business increased at an unprecedented pace. Pressure on capacity was exacerbated by severe material and labour shortages, as delivery times worsened further and at a rate exceeded only once over the survey history by the deterioration seen in July.
Firms sought to relieve capacity constraints by expanding their workforce numbers in September. Although employment rose at a solid pace, companies continued to highlight challenges finding suitable candidates for current vacancies.
Meanwhile, input costs increased at the second-fastest rate since data collection began in May 2007, easing only slightly from August’s high. The sustained rise in cost burdens was linked to greater transportation charges and supplier price hikes. As a result, firms raised their selling prices at the fastest pace on record in September. Higher charges were overwhelmingly attributed to efforts to pass-through greater costs to clients.
A marked deterioration in vendor performance did not deter firms from expanding their input buying. Increased purchasing activity was reportedly due to efforts to stockpile inputs and process burgeoning backlogs of work. The rise in input buying came amid the slowest rate of growth in stocks of purchases for five months and a further contraction in post-production inventories.
Finally, output expectations dipped to a four-month low in September. Although historically strong, the degree of confidence was weighed down principally by concerns regarding raw material availability.
But the ISM Manufacturing Index Increases Unexpectedly in September
The Institute for Supply Management (ISM) reported that its Composite Index of Manufacturing Sector Activity rose to 61.1 during September after improving to 59.9 in August. The reading remained below a March high of 64.7. A level of 59.5 had been expected in the Action Economics Forecast Survey. During the last 15 years, there has been a 43% correlation between the composite index and the quarterly change in real GDP. Before the recent recession, there had been a 67% correlation.
What respondents are saying:
- “Lack of labor and escalating costs from every direction are very concerning.” [Food, Beverage & Tobacco Products]
- “Ocean freight delays creating disruptions in many areas. Southeast Asia supply continues to be challenged due to COVID-19 outbreaks.” [Furniture & Related Products]
- “Delivery and availability of raw materials, primarily carbon steel, are becoming more and more difficult to source. This has resulted in delaying order deliveries. (…) Traditional in-house machining now has to be outsourced due to a lack of experienced machinists. All this has had a negative impact on production throughput.” [Fabricated Metal Products]
- “Customer demand continues to swell as we prepare for the fourth quarter, and overall growth has been extremely good for the year. Supply chain concerns are growing beyond electronics and chips into most other commodities. Lead times are extending, shipping lanes are slowing, and we will not see an end to this in 2021.” [Electrical Equipment, Appliances & Components]
- “We are still amazed by the labor market. We used to have 100 applicants for an opening; we are now seeing about 10 — and often, the applicant does not show for the interview.” [Paper Products]
- “Our company’s entire supply chain continues to have significant challenges getting manpower, which is impacting production of parts and ability to meet daily build schedules. (…) Raw materials costs still are at record highs, and we have raised customer pricing, with additional increases in the near future due to labor costs going up. Huge customer orders are nine months out (due to) backorders. Seeing this domestically and internationally.” [Machinery]
- “Global supply chain constraints are still a major concern and focus. Inventory builds continue to compensate for potential supply disruption.” [Miscellaneous Manufacturing]
Canada: PMI continues to signal strong growth, but global supply shortages force record rates of inflation
Canada’s manufacturing sector concluded the third quarter of 2021 with another robust expansion. Despite a rise in COVID cases, output and new orders rose at historically elevated rates. However, global supply shocks persisted, leading to lengthier delivery times and a subsequent joint-record increase in backlogs. Amid efforts to protect against future shortages, firms raised their pre-production inventories at the joint-quickest rate in the survey to date.
Meanwhile, higher prices for steel, oil and transportation underpinned record rates of input and output price inflation.
The headline seasonally adjusted IHS Markit Canada Manufacturing Purchasing Managers’ Index® (PMI®) registered 57.0 in September, little-changed from 57.2 in August. The latest reading extended the period of growth to 15 successive months, with the latest expansion among the sharpest in the 11-year history of the survey.

Canadian manufacturers recorded another solid upturn in their production volumes, although the rate of growth moderated from August’s four-month peak. Surveyed respondents commented on supportive demand conditions, new product launches and increased efforts to boost output.
Similarly, new orders rose sharply, but at a softer pace than that seen in August. Firms mentioned strong demand conditions in both domestic and international (particularly the US) markets, despite a rise in COVID-19 cases.
To cater for the sustained increases in output and new orders, firms recorded a fifteenth monthly uptick in employment levels. The latest expansion was the softest since February, however. Anecdotal evidence suggested that labour shortages and difficulties finding skilled workers weighed heavily on hiring activity.
With the continuation of virus-related restrictions, as well as material scarcity, container shortages and freight delays, supplier’s delivery times lengthened at the second-most marked rate in the series history, surpassed only by that seen in April 2020. This, paired with difficulties finding staff, led to a joint-record rate of backlog accumulation. Incomplete work has now risen for the fourteenth month running.
Amid efforts to mitigate against future delays, firms raised their stocks of purchases at the joint-fastest rate in the survey to date. Capacity pressures resulted in another decline stocks of finished goods, however.
Material scarcity and robust demand for inputs led suppliers to hike their fees in September. Survey members noted greater prices for oil, steel and transportation. The overall rate of cost inflation accelerated from August’s previous peak to a new series high. Factory gate charges also rose at a survey record rate with the strong demand environment allowing firms to pass on a large proportion of the burden.
Goods producers expect output to increase over the coming 12 months, with the overall level of positive sentiment improving to the highest recorded since May 2019. Optimistic growth projections reflected forecasts of an improvement in economic conditions and wider material availability.
The Bank of Canada will have to start raising interest rates in the first half of 2022 because supply constraints and hotter-than-normal inflation aren’t going away, Fidelity Investments portfolio manager David Wolf said.
Wolf, a former adviser to the central bank, said its models overestimate the amount of slack in the economy. The Covid-19 pandemic has led to a “rearranging of the economy” and shortages of workers and products will persist, he said. (…)
The consumer price index rose 4.1% in August from a year earlier, the fastest pace since 2003, marking the fifth consecutive month of inflation readings above the Bank of Canada’s 3% cap.
China’s Power Shortfalls Begin to Ripple Around the World Widespread power shortfalls have hurt the recovery of the world’s second-largest economy and add to a global energy squeeze that risks upsetting the post-pandemic recovery.
(…) The shortages reflect a combination of factors. Coal prices have surged because of a shortage of domestic coal supplies, made worse by import cuts from Australia and Mongolia. That has prompted power stations to reduce output to avoid losses because of official caps on their selling prices.
Meanwhile, from the top, Beijing is seeking to enforce energy-efficiency targets, leading to officially sanctioned reductions in energy usage by some industries.
At the same time, demand for electricity has soared since the end in April 2020 of China’s pandemic-induced shutdown, as factories increased production to meet rising consumer demand in the West. (…)
Surging demand, swings in the weather and lackluster production have driven up natural-gas prices. The surge has hit output at European factories and household energy bills. It is also fueling anxiety in Europe and the U.S. over whether dwindling supply will be sufficient to power economies through the winter.
The U.K. government recently stepped in with subsidies to reopen a fertilizer plant closed by rising energy costs, which supplies a significant share of the country’s carbon dioxide, a byproduct needed in food processing. The French government said this week it would block any increase in household gas and electricity bills until the spring.
The China power crunch also risks heaping further pressure on global supply chains by pushing up prices for raw materials and essential components.
“Global markets will feel the pinch of a shortage of supply from textiles, toys to machine parts,” wrote Ting Lu, chief China economist at Nomura Holdings, in a note to clients on Monday. He added that the resulting supply shock will likely further push up global inflation, especially in developed markets such as the U.S. The power curbs have hit parts of China’s manufacturing bases, including those that produce semiconductor-related goods. A global shortage of semiconductors this year has already hit car makers and other industries. (…)
“We rely so much on China, it’s incredible,” he said. (…)
China’s leadership has responded as shortages swept through the country. On Monday, Vice Premier Han Zheng, who supervises the nation’s energy policies, summoned leaders of the country’s top state-owned energy companies to a closed-door meeting and ordered them “to increase coal supplies by all means,” according to two people familiar with the discussion and a summary of the meeting seen by The Wall Street Journal. Participants were asked not to bring their cellphones to the meeting with Mr. Han. (…)
Newcastle thermal coal, a global benchmark for the variety burned to generate power, last week breached record levels set during the 2008 global financial crisis to top $201 a metric ton, up 141% from the start of the year. Prices of higher-grade metallurgical coal, used for steelmaking, are up 158% from the start of the year to a record $615 a metric ton in China, nearly twice its last high set in 2016. (…)
“The shortage in coal supply, especially coking coal supply, cannot be alleviated in a short period of time.” (…)
Starting Friday, industrial users in China’s manufacturing hub of Guangdong province will need to pay up to 25% more to use electricity during peak hours.
China’s economic planning agency, the National Development and Reform Commission said Wednesday it would increase coal production, import more coal, increase domestic gas production and pass through some higher energy costs to end-users. (…)
Energy Transition Faces Metal Supply Deficit, Canada Miners Say
(…) Any credible prognosis shows that copper faces a structural deficit of five to seven million tons starting in the next three or four years, Hudbay Chief Financial Officer Steve Douglas said Wednesday at Bloomberg’s Canadian Fixed Income Conference. And yet, any energy transition can’t happen without copper, he said. (…)
The ability to build mines in a world where extractive resource industries has become more challenging as investors put greater weight on the environmental credentials of metals producers, while social issues including dealing with local communities have also been under the spotlight. That adds to industry challenges that include supply disruptions and rising costs of raw materials. (…)
Nordea:
Last week, we dusted off an old supply vs. demand driven price change methodology showcasing that the oil price had almost only risen due to supply side constraints this year. We find that this holds for most of the commodity space with natural gas as the potential extreme now.
The price increases in the BBG commodity index are completely out of whack with the global cycle due to political programs such as Zero Covid and New Green Deals.
Mind the massive gap between the business cycle and commodity prices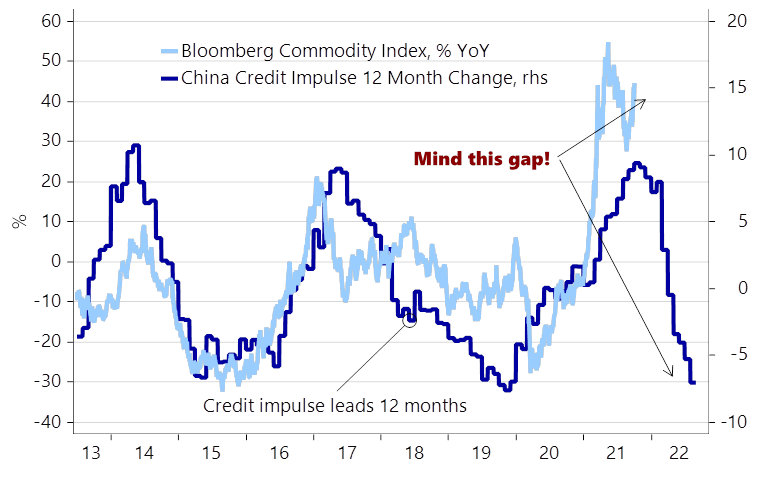
European energy policy is effectively in the hands of Putin due to 1) a 30-40% weaker wind-season, 2) closures of functioning nuclear capacity and 3) already weak natural gas inventories. Even the Green Eurocrats likely pray for a warm winter across Europe as a colder than usual winter would send European electricity prices even further up into the stratosphere. Whether for example Spain, Germany and similar countries are about to enter a period of marked stagflationary vibes is now solely in the hands of the Tsar, similar to what was the case with the Muftis in the 1970s. (…)
The bottom-line is that the Euro area is likely to be the most sensitive (not least to Natural Gas) and we should expect at least 1.5-2%-points to be shaved of 2022 growth prospects within the G3+ countries (Japan, Euro area and US) just due to the recent price moves in Energy.
The median American household would need 32.1% of its income to cover mortgage payments on a median-priced home, according to the Federal Reserve Bank of Atlanta. That is the most since November 2008, when the same outlays would eat up 34.2% of income. (…)
In July, the latest month in the Atlanta Fed’s calculations, median home prices were $342,350, up 23% from the year before. Median incomes were $67,031, up 3%. (…)
At the start of 2021, Americans needed about 29% of their income to cover a mortgage, the Atlanta Fed estimated. That rose to about 32% by July. The Atlanta Fed includes principal, interest, taxes, insurance and related costs in mortgage payments. (…)
About 63% of consumers surveyed in August believed it was a bad time to buy a house, according to Fannie Mae. That was up from 35% at the same time last year.
TECHNICALS WATCH
Weaknesses in market internals continued last week and there were no signs of renewed broad-based demand for equities. Current measures of demand vs supply are similar to conditions in February 2020 and October 2018 says my favorite technical analysis firm.


SentimeTrader reminds us that “this month has historically been both the best and the worst”:

China Evergrande to raise $5 bln from property unit sale China’s state-backed Global Times said Hopson Development (0754.HK) was the buyer of a 51% stake in the property business for more than HK$40 billion ($5.1 billion), citing unspecified other media reports. (…) offloading some assets may not be totally sufficient, the key for Evergrande is to get project construction going and to sell inventory.”
US ready to accuse China of failing to honour trade deal signed with Trump Biden administration official says Washington ‘willing to take steps’ if talks do not produce results
U.S. Seeks to Regulate Stablecoin Issuers as Banks The Biden administration is considering ways to impose bank-like regulation on the cryptocurrency companies that issue stablecoins, according to people familiar with the matter, including prodding the firms to register as banks.
(…) The moves are intended to address regulators’ fears that stablecoins—digital currencies pegged to national currencies like the U.S. dollar—could fuel financial panics and need to be more tightly regulated.
Stablecoins are issued by companies such as Tether Ltd. and Circle Internet Financial Inc. and are designed to combine the stability of national currencies like the dollar with the ability to trade quickly online like bitcoin. But some policy makers have said stablecoins could fuel instability if users come to doubt the value of their underlying assets that keep their prices stable. (…)
Stablecoins, which are based on the same blockchain technology as assets like bitcoin, are a relatively small but fast-growing corner of the $2 trillion crypto world. The value of the three largest—Tether, Circle’s USD Coin and Binance USD—has swelled to about $110 billion from about $11 billion a year ago. (…)
Imports’ share of the U.S. vehicle market rose last month to 28.0% and remained up from 23.5% in December. It has been rising steadily from 19.9% in 2015. Imports’ share of the passenger car market surged to a record 38.5% in September. Imports’ share of the light truck market rose to 25.1% last month, up from a recent low of 20.7% in August 2020.


The country split revealed a broad-based loss of growth momentum during September. Of the economies monitored, it was Ireland which expanded at the fastest rate, while the softest expansions were seen in the bloc’s two largest economies – France and Germany.


