U.S. Initial Claims for Unemployment Insurance Rise Again
Initial claims for unemployment insurance rose to 362,000 (-54.9% y/y) during the week ended September 25 from an unrevised 351,000 in the prior week. The Action Economics Forecast Survey expected 335,000 initial claims in the latest week. The four-week moving average of initial claims edged higher to 340,000.
Initial claims for the federal Pandemic Unemployment Assistance (PUA) program in the week ended September 25 were 16,752, up from 14,793 in the previous week. The latest number remained near the lowest since the program began on April 4, 2020 at the start of the pandemic. By comparison, these claims averaged 107,756 per week during August. The PUA program provided benefits to individuals who are not eligible for regular state unemployment insurance benefits, such as the self-employed. This program expired on September 6, explaining the smaller number of new claims in the latest couple of weeks. Given the brief history of this program, these and other COVID-related series are not seasonally adjusted.
Continued weekly claims for regular state unemployment insurance fell during the week of September 18 to 2.802 million (-75.4% y/y) from 2.820 million in the prior week, revised from 2.845 million. The insured rate of unemployment slipped to 2.0% from 2.1%.
Continued weekly claims in the PUA program dove to 1.059 million in the September 11 week (-91.4% y/y) from 4.896 million in the prior week. Continued weekly claims for Pandemic Emergency Unemployment Compensation (PEUC) fell sharply to 991,813 in the week of September 11, down from 3.645 million in the prior week. This program covers people who have exhausted their state unemployment insurance benefits.
In the week ended September 11, the total number of all state, federal, PUA and PEUC continued claims more than halved w/w to 5.028 million. These total claims averaged 10.078 million over the four weeks ended September 11. These figures are not seasonally adjusted.
 (Bespoke)
MANUFACTURING PMIs
Eurozone: Manufacturing growth slowdown continues in September
Euro area manufacturers recorded another strong improvement in operating conditions during September, latest PMI® data showed, owing to further marked rates of expansion in output, new orders and employment. That said, notable slowdowns were seen in all three cases, causing the headline PMI to fall by its largest margin since April 2020, right at the start of the COVID-19 pandemic when virus containment measures were being implemented across the currency bloc and globally.
The final reading of the IHS Markit Eurozone Manufacturing PMI for September of 58.6 was a fraction below the preliminary ‘flash’ print of 58.7, but a notable step down from 61.4 seen in August and the lowest since February.
Manufacturing PMI data by euro area member states revealed that it was the relatively smaller nations that saw the greatest improvement in conditions during
September, with Austria topping the growth rankings. Austria was also the only economy to see faster manufacturing growth over the month as expansions slowed elsewhere. Meanwhile, Germany registered the most notable slowdown compared with August, with the headline index slumping by over four points.
The drop in the Manufacturing PMI was driven by the index’s two principal components, new orders and output, which signalled considerable moderations in growth when compared with August. In both cases, the expansions were still strong, but the weakest for eight months.
Meanwhile, following on from the sharp rates of increase seen in previous months, new export orders grew at the slowest rate since January.
Supply constraints were a key hindrance to production schedules during September, while softer demand conditions were another contributing factor.
Supplier delivery times continued to lengthen to a substantial degree in September. Furthermore, the extent to which vendor performance deteriorated was greater than in August. Shortages of electronic components and raw materials were particularly widespread, while some firms commented on poor container availability and logistical problems arising in parts of Asia.
The impact of these supply chain issues was also evident in input purchasing and inventories. Euro area manufacturers increased their buying activity at the weakest pace since January during September amid poor input availability, preventing stock replenishment efforts.
As a consequence, inflationary pressures remained acute during September. Although the rate of input price inflation was the weakest in five months, it was still above anything seen in almost 24 years of data prior to this. To protect profit margins, euro area manufacturers lifted their output prices, and to a quicker extent than seen in August.
Meanwhile, slower rises in production and new orders filtered through to recruitment in September as manufacturing jobs growth slowed to a six-month low. There was further evidence of rising capacity pressures, with backlogs of work rising sharply at the end of the third quarter. That said, the rise in outstanding business was the slowest since February.
Lastly, business confidence fractionally ticked higher during September, marking the first time since June that the level of positive sentiment has increased. That said, the degree of optimism held close to August’s nine-month low.


Japan: Manufacturing conditions improve at softer pace in September
Japanese manufacturing firms continued to indicate a softening improvement in operating conditions in September. Both output and new orders fell into contraction for the first time since the turn of the year, as pandemic restrictions and heightened supply chain disruption dampened activity in the manufacturing sector. Shortages of raw materials and delivery delays intensified price pressures, as input costs rose at the quickest rate since September 2008. Yet, businesses were increasingly optimistic that activity would rise over the coming year, with the level of positive sentiment strengthening for the first time since June.
The headline au Jibun Bank Japan Manufacturing Purchasing Managers’ Index™ (PMI) eased from 52.7 in August to 51.5 in September, signalling a softer, more marginal improvement in the health of the sector. The latest increase marked the second successive slowdown in manufacturing performance, and was the lowest reading since February.
Latest data pointed to a renewed contraction in output. The decline was the first since January and was the sharpest recorded for a year. Lower production levels were often associated with rising COVID-19 cases, as well as sustained shortages of raw materials.
Similarly, new orders among Japanese manufacturers fell for the first time since December 2020. The pace of the decline was the quickest recorded for ten months, though was marginal overall. Respondents linked lower sales to weaker client confidence in the domestic market. On the other hand, foreign demand for Japanese manufactured goods reversed the decline reported in August to increase marginally in the latest survey period, with firms citing stronger demand in key markets, notably in China and the US.
Positively, the Japanese manufacturing sector continued to increase capacity in anticipation of an eventual recovery in demand. Workforce numbers were raised for the sixth successive month, with the rate of job creation the fastest since April 2019. Indications of greater pressure on capacity rose as backlogs of work increased for the seventh time in as many months, with the pace of accumulation the quickest for five months.
Japanese goods producers indicated a renewed contraction in purchasing activity, the first for seven months. The fall was moderate overall and often linked to unstable supply of inputs amid shortages of raw materials and delivery delays. Average vendor performance deteriorated markedly in the latest survey period, and to the greatest extent since April 2011 when supply chains were disrupted by the earthquake and tsunami. As a result, holdings of pre-production inputs were reduced for the first time since April as firms utilised safety stocks for production.
September data signalled further rises in average cost burdens among Japanese manufacturers. The pace of input cost inflation accelerated from August and reached the fastest pace for exactly 13 years. Respondents commonly attributed higher input costs to widespread rises in raw material and logistics prices. These were partially passed on to clients through higher factory gates charges, which rose at the sharpest rate since October 2008.
Looking ahead, business optimism at Japanese manufacturers rose for the first time since June, as firms continued to forecast a rise in output in the coming year. Manufacturers predicted that the end of the pandemic would trigger a general recovery in demand.

ASEAN manufacturing conditions stabilise inSeptember
Manufacturing conditions across the ASEAN region stabilised during the closing month of the third quarter, according to the latest IHS Markit Purchasing Managers’ Index (PMI™) data. Following marked decreases in August, both output and new orders declined at noticeably slower rates, with the latter broadly stable in September as the respective seasonally adjusted index posted only just below the neutral 50.0 level.
The headline PMI registered on the 50.0 mark that separates expansion from contraction during September, rising from August’s 14-month low of 44.5. This signalled no-change in manufacturing conditions on the month, thereby ending a three-month sequence of deterioration. The average reading over the third quarter, at 46.3, was the lowest since the second quarter of 2020 and second-lowest on record, however.
Three of the seven constituent ASEAN nations recorded improvements in the health of their respective manufacturing sectors during September. The strongest upturn was seen in Singapore, where the headline PMI rebounded from 44.3 in August to 53.4 in September, signalling a solid rate of expansion.
This was followed closely by Indonesia, which registered the first improvement in the health of the goods producing sector since June. The headline index (52.2) was indicative of a moderate improvement in conditions overall.
The only other constituent nation to see the health of its manufacturing sector improve was the Philippines. Here, the PMI (50.9) returned to expansionary territory following a solid contraction in August, with the rate of growth the fastest since March, but only marginal overall.
Elsewhere, Thailand registered a further deterioration in manufacturing conditions in September, as client demand remained weak, despite an upturn in output amid the slightly improved pandemic situation. That said, the headline index (48.9) pointed to the slowest rate of contraction for three months.
Similarly, in Malaysia, the rate of contraction eased to the slowest in the current four-month sequence of deterioration (PMI: 48.1) during the closing month of the quarter.
Elsewhere, Myanmar too saw a slower rate of decline during September, although at 41.1, the PMI was still indicative of a rapid deterioration in manufacturing conditions.
Finally, a fourth successive monthly contraction was recorded in Vietnam during September, as the sector continued to be impacted by the current wave of the COVID-19 pandemic and subsequent containment measures. The PMI was unchanged from August’s reading of 40.2, and signalled the joint-second quickest deterioration in the health of the sector since the survey began in March 2011.
Overall, the ASEAN goods producing sector remained on an uneven footing in September. Output continued to fall, albeit only fractionally, while new orders stabilised, but failed to return to growth.
As a result, job shedding continued for the twenty-eighth month running, with the rate of decline in employment remaining sharp. This was despite a record increase in backlogs of work.
At the same time, supply disruption continued. Average lead times for inputs lengthened again, with delays slightly more severe than in August.
Inflationary pressures also intensified in September. Cost burdens rose at the fastest rate since November 2013, with goods producers subsequently raising their average charges at the strongest pace for over seven years.

- Vietnam abandons zero-Covid strategy after record drop in GDP Warnings that lockdowns were crippling businesses heaped pressure on Communist government
U.S. Car Sales Seen Dropping as Buyers Stymied by Chip Shortages
(…) Carmakers likely sold about 12.3 million new vehicles at a seasonally adjusted annualized rate in September, down 25% from a year ago, according to an average of six market researcher forecasts. That’s lower than August’s 13.1 million pace, and downright whiplash from the near-record annual rate of 18.3 million in April, buoyed by a fresh supply of chips.
U.S. car dealers had just 17 days worth of new-car inventory on their lots in September, compared with 42 days a year ago, according to market researcher TrueCar. The average September inventory from 2015 to 2019 was 64 days, according to Wards. (…)
The bottlenecks extend beyond chips. Rubber, electrical parts and components are scarce; there’s a labor shortage and shipping logjams too, said Stoddard.
“The whole supply chain is just breaking apart because manufacturers can’t keep up with overall demand,” he said. (…)
INFLATION
Powell Says Fed Faces ‘Difficult Trade-Off’ if Inflation Doesn’t Moderate ‘Our expectations is that inflation will come down,’ central bank leader tells lawmakers
Federal Reserve Chairman Jerome Powell told lawmakers Thursday that the central bank still expects a recent spell of high inflation to reverse but said it was difficult to pinpoint when that might happen.
A surge in prices this year “is a function of supply-side bottlenecks over which we have no control,” Mr. Powell said at a House Financial Services Committee hearing, where he appeared alongside Treasury Secretary Janet Yellen.
“We have an expectation that high inflation will abate, because we think the factors that are causing it are temporary and tied to the pandemic and the reopening of the economy,” he said. “These aren’t things that we can control.” (…)
Inflation is well above the Fed’s 2% target, and the economy is “far away, we think, from full employment,” Mr. Powell said. “That’s the very difficult situation we find ourselves in.” (…)
Two days ago, Powell was less cautious on inflation: “But they will abate, and as they do, inflation is expected to drop back toward” the Fed’s 2% goal, Mr. Powell said.
And, on September 22nd, he was a lot merrier about employment: “For the labor-market goal, “I guess my own view would be that the test…is all but met,” said Mr. Powell”.
Yesterday, David Rosenberg expressed his frustration on Powell’s pivots:
Who knew that a leopard could change his spots so quickly? Look at how “Jay the Dove”became “Jay the Hawk” in just one month’s time —not even a disappointing payroll report, a 0.1% reading on the core CPI and a steady diet of growth downgrades for Q3 managed to prevent the Fed Chairperson from pulling a 180 degree turn… in four weeks!
Jay, what happened? It is hard not to see the complete shift in tone from the Jackson Hole vigorous defense of why inflation will come back down and his quick sermon on Tuesday on why inflation may well be here to stay (what??)
Investors must be getting worried about Powell’s leadership. Not only because of his apparent pivots, but also because of his increasing attempts to disengage the Fed from what’s happening: “we think the factors that are causing it are temporary and tied to the pandemic and the reopening of the economy,” he said. “These aren’t things that we can control.”
How about the demand side Mr. Powell?
“The very difficult situation we find ourselves in” is that
- supply problems are a lot more enduring than forecast,
- demand for goods is more resilient than forecast,
- labor shortages are longer lasting than forecast,
- wages are rising faster than forecast,
- energy prices are stronger than forecast,
- house prices are inflating more than forecast,
- and rents start climbing as a result and push CPI (and PCE inflation) much higher than forecast.
One possible scenario is that holiday shopping starts early to beat shortages and price increases but that rising inflation on essentials (food, energy, rents, staples) and slowing employment cause consumers to retrench in 2022. “The very difficult situation we find ourselves in” is stagflation in 2022. Any control on that, Mr. Powell?
BTW, Rosenberg, a vocal noflationist, also complained that people are not talking about unit labor costs, “the mother’s milk for inflation” which, he says, “have an 82% correlation with the YoY trend in core CPI (back to 1960)” and which was only +0.2% YoY in Q2.
Looking at the chart, the relationship looks really good prior to the mid-1980s but not quite as good since. David’s number is right, however, 82% over the past 60 years…

…but the correlation drops to 34% since 1983 and to 16% since 2000. For some reasons, the quality of the milk has declined to the point where the whole relationship with that mother isn’t smooth anymore.
Suspecting a Wal-Mart effect on goods inflation since the mid-1980s, I correlated ULC with CPI-Services: same correlation since 1960, dropping somewhat less to 43% and 29% since 1983 and 2000 respectively.
Back to inflation:
The deepening global energy crunch has pushed natural gas in Europe and Asia to the equivalent of about $190 a barrel, something the oil market has never seen.
Both regions saw fresh records in the heating and power-generation fuel this week as utilities rush to restock lower-than-average inventories ahead of winter in the northern hemisphere, while alternatives — like coal — are also in short supply. (…)
On Thursday, the Japan-Korea Marker, North Asia’s benchmark for spot liquefied natural gas shipments, surged to $34.47 per million British thermal units, the highest on records going back to 2009, according to price reporting agency S&P Global Platts. Converting that into oil units, also gives a price of about $190 per barrel of oil equivalent. (…)

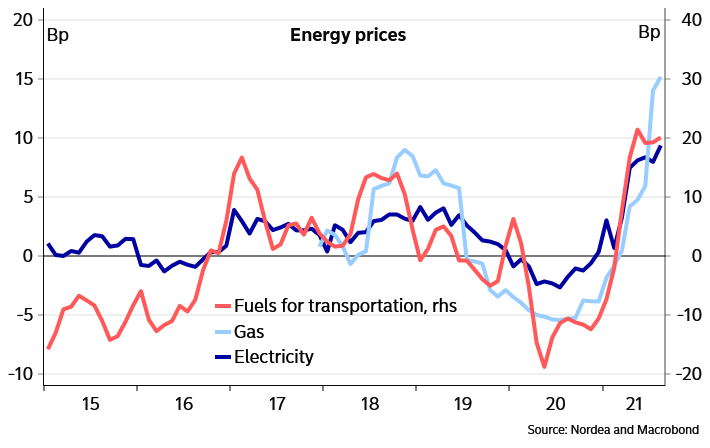
Euro zone inflation jumps to 13-year high, worsening ECB headache
Consumer price inflation in the 19 countries sharing the euro accelerated to 3.4% year on year in September from 3% a month earlier, the highest reading since September 2008 and just ahead of analyst expectations for 3.3%, data from Eurostat, the EU’s statics agency showed on Friday.
Prices rose predominantly on a surge in energy costs, mostly a reversal of the oil price crash that took place during the COVID-19 pandemic, but the impact from production and shipping bottlenecks was also showing as durable goods prices rose 2.3% from August. (…)
Core inflation excluding food and energy rose to 1.9% from 1.6%, as did a narrower measure that also excludes alcohol and tobacco. (…)
- German inflation hits 29-year high of 4.1%
- German workers strike for higher pay as inflation surges Economists worry that growing wage demands driven by price rises could send rate higher still
ING:
The high inflation numbers have clearly raised the question whether those will start to feed higher wage increases and permanently higher inflation numbers. This question is especially relevant in Germany where the labour market recovery in the summer has been exceptionally strong and is expected to continue. The number of people under the Kurzarbeit furlough scheme has declined rapidly and number of employed rose rapidly in the summer. The unemployment rate declined in August to 5.5% which is not anymore much above the pre-pandemic 5% level.
So far, wage demands in Germany have remained under control but the fast recovery has started to raise the demands. Thus, the upside risks clearly exist around wage and inflation outlook in Germany. When considering future labour market tightening in Germany one has to also take into account the possible permanent changes in the labour flows from the Central European EU countries. Already prior to pandemic, the flows started to become smaller due to favourable wage developments in those countries. It remains to be seen whether that situation even worsens now after the pandemic.
- France to block gas and electricity price rises until the spring Paris to lower taxes paid on power as spectre of ‘gilets jaunes’ protests looms large
EARNINGS WATCH
Bed Bath & Beyond Shares Dive on Sharp Sales Decline The retailer lost more than a fifth of its market value after reporting a sharp drop in quarterly sales because of supply-chain challenges.
(…) Net sales for the fiscal second quarter ended Aug. 28 fell 26.2% to $1.98 billion as traffic slowed in August, the company said. Bed Bath & Beyond also lowered its sales and adjusted profit expectations for the year as it anticipates greater supply-chain challenges. (…) cost inflation also escalated beyond the significant increases the company had already anticipated, especially later in the quarter. (…) “The speed of industry inflation and lead-time pressures outpaced our plans to offset these headwinds and, as a result, we did not pivot fast enough, especially on price and margin recovery,” he said on a conference call. (…)
- CarMax Is Far From Maxing Out CarMax’s revenue growth is still in the fast lane, though pressure on profits is concerning investors
Used-car seller CarMax KMX -12.63% on Thursday said sales in its quarter ended Aug. 31 grew 48.7% compared with a year earlier, hitting a record of $8 billion, exceeding analyst expectations. Strong pricing for used vehicles, driven by continued delays to new-car manufacturing from the global chip shortage, continues to boost the company’s top line. Average retail selling prices were up 30.8% compared with a year earlier.
Not all of that is translating to profits, however. Earnings per share actually declined compared with a year earlier and came in 12.4% below analyst expectations. That seems to have been a big disappointment for investors after the company exceeded EPS estimates by a high margin for four consecutive quarters. After reaching an all-time-high share price on Wednesday, CarMax shares dropped more than 11% after the earnings call on Thursday morning. (…)
Selling prices actually picked up this month compared with July and August, when used-vehicle prices moderated slightly. As of mid-September, wholesale used-car prices were 3.5% higher than the previous month and 25% more expensive than a year earlier, according to Manheim. (…)
Still not in transitory mode…


