Strained supply chains keep U.S. producer prices hot
(…) The producer price index for final demand rose 0.7% last month after two straight monthly increases of 1.0%, the Labor Department said. The gain was led by a 0.7% advance in services following a 1.1% jump in July.
A 1.5% increase in trade services, which measure changes in margins received by wholesalers and retailers, accounted for two-thirds of the broad rise in services. Goods prices jumped 1.0% after climbing 0.6% in July, with food rebounding 2.9%.
Transportation and warehousing prices shot up 2.8%. (…)
In the 12 months through August, the PPI accelerated 8.3%, the biggest year-on-year advance since November 2010 when the series was revamped, after surging 7.8% in July. (…)
High inflation and supply constraints, which tanked motor vehicle sales in August, have prompted economists to slash their third-quarter gross domestic product growth estimates to as low as a 3.5% annualized rate from as high as 8.25%. The economy grew at a 6.6% rate in the second quarter. (…)
Excluding the volatile food, energy and trade services components, producer prices rose 0.3%, the smallest gain since last November. The so-called core PPI shot up 0.9% in July.
In the 12 months through August, the core PPI accelerated 6.3%. That was the largest rise since the government introduced the series in August 2014 and followed a 6.1% increase in July. (…)
Haver Analytics’ table provide the key numbers:

Core Final Demand PPI ex-Trade Services is up 7.0% annualized in the last 3 months with core goods prices, supposed to be transitory, up another 0.6% MoM in August, and 10.8% a.r. in the last 3 months. Processed Goods prices, in the middle of the pipeline, rose 1.0% MoM in August, 19.7% a.r. in the last 3months and +23.0% YoY.
Services PPI, still not fully reopened, rose 0.7% MoM and 10.8% annualized in the last 3 months.
And if you think PPI inflation does not impact consumer prices, Ed Yardeni has a few charts for you:


STAGFLATION!!!
The new buzz word most investors are not aware of. Fiera Capital’s strategists last week swapped their “Inflationary Boom” scenario for a “Stagflation” scenario with a 40% probability, only slightly lower than their 50%-odds “Reflationary Scenario”. My former partner, a great cycle caller (he’s seen them all except, perhaps, the Great Depression  ), now sees 90% probabilities of inflation in the 3.50-4.00% range over the next 12-18 months (up from 2.25%-3.0% one month ago), but hesitates between 1.5% (40%) and 4.5% (50%) real GDP growth in the U.S.. Very uncomfortable!
- Mohamed El-Erian: Supply chain issues add to stagflationary winds
- Hints of stagflation cause fresh headaches for central banks
The latest [PMI] data can be typified by stagflation, with growth slowing sharply while price pressures remain elevated. There are different signals for different economies, however, and also possibly some parallels from the global financial crisis, which hint at the Bank of England and FOMC potentially pulling back on tapering pandemic-related stimulus. (…)

Price pressures have meanwhile shown few signs of abating to any significant degree in the US or UK despite the economic growth slowdown. In fact, input price inflation in the US and UK is running far higher than in the eurozone, albeit with some slight cooling evident in all cases. (…)
The upcoming PMI data will therefore provide important clues as to policy direction. In particular, we will be looking to assess the extent to which slower output growth is being caused by the Delta variant or if demand growth is slowing as rebounds from the pandemic downturns peak. We will also be seeking clues as to whether shortages of materials and staff are continuing to push costs higher, or whether the recent peaking in the PMI price data represents a turning point. (…)


More a warning than a forecast by John Mauldin. Worth reading but here’s the conclusion:
I am increasingly concerned that the Fed is toying with inflation and the economy could slow down more than they currently project. They are roughly projecting 2–3%+ growth and slightly above 2% inflation. That would be a very good outcome. I am more worried they are wrong, as they have often been in the past, and we’ll get the worst of both worlds: higher inflation and lower growth—in a word, stagflation.
Things can change fast:

Federal Reserve Bank of Atlanta
From zippers to glass, shortages of basic goods hobble U.S. economy
(…) Shortages of metals, plastics, wood and even liquor bottles are now the norm. The upshot is a world where buyers must wait for delivery of items that were once plentiful, if they can get them at all. (…)
Along with the shortages come hefty price increases, which has fueled fears of a wave of sustained inflation. (…)
David Reilly, president of United Solutions, a plastics maker in Leominster, Mass., said soaring resin prices – he estimates they’re up 100% for some types in the past year – is his biggest challenge.
Normally he would have his buyers scouring overseas markets, including China, for cheaper resins.
“But we can’t do that,” he said, because shipping prices have risen so much that they wipe out any price advantage. “Right now, producers in North America don’t have the stiff competition that they would if container prices came back down.” (…)
- Supply chain crisis will leave permanent scar, UPS warns Delivery group’s international head says manufacturing and assembly will become more regional
The Earnings Crunch Is Getting Real Shortages and rising costs have reached a tipping point for manufacturers and are set to take a bigger bite out of third-quarter results.
Bloomberg’s Brooke Sutherland covers industrials. She adds to my own recent warnings about cost push inflation but also feeds my other warning that booming sales, currently masking margins pressures, are about to slow down and reveal the cost squeeze.
(…) A series of updates this week suggests relentless inflation and supply-chain challenges have become too intense to steer around and that these forces will weigh on third-quarter results in a more significant way.
PPG Industries Inc. and Sherwin-Williams Co. both slashed their outlooks for the current quarter this week. The two paint makers have been aggressively raising prices, but commodity, transportation and labor expenses are rising so quickly and sharply that they are struggling to keep up. PPG said raw-material inflation was trending as much as $70 million higher in the third quarter than what it had anticipated as recently as July. To help offset the increased costs, Sherwin-Williams announced a 4% surcharge on customers in the Americas through the end of the year, on top of existing “significant” price hikes. While demand is still strong, the companies can’t get the commodities they need to fill customer orders. In the case of PPG, its own supply chain isn’t the only hurdle; customers are also having to curtail production (and thus paint orders) because of shortages elsewhere, particularly for semiconductors. In total, PPG expects to lose out on as much as $275 million of sales this quarter because of the disruptions.
The same issues are bedeviling homebuilder PulteGroup Inc. and data-center equipment provider Vertiv Holdings Co.; they also cut their outlooks this week because they simply can’t get their hands on enough raw materials. In some cases, Vertiv can’t procure critical parts “at any price.” (Vertiv also agreed to buy E&I Engineering Ireland Ltd., a maker of electrical switch gear and power distribution systems, for as much as $2 billion, including performance-based payouts.) General Electric Co. kept its guidance intact but warned this week of “sustained pressure” on revenue and profit margins at its health-care unit because of a limited availability of chips, resins, workers and shipping services. The industrial giant expects the operating environment to stay challenging at least through the first half of 2022. (…)
Union Pacific Corp., for example, is facing rising steel and lumber costs to repair and maintain its tracks but its employee health-care bills are also more bloated, as are the prices charged by the janitorial services that clean its office buildings and the contractors that mow its lawns, Chief Executive Officer Lance Fritz said in a video interview with Bloomberg News reporters and editors.
The key question is whether logistics disruptions are simply delaying sales until 2022 or if rising prices will start to turn off some customers. Fastenal Co., a distributor of factory floor odds and ends whose results are often a good bellwether for the broader industry, reported slowing sales growth for the manufacturing sector in the month of August. Is it just a blip that reflects production challenges and slightly tougher comparisons or something more serious? (…)
From last week’s Beige Book:
A Minnesota hotelier said housekeeping wages were increased from $13 to $15 an hour. “It didn’t attract labor, but it made our current [staff] very happy and felt great to be able to afford this increase.”
A 15.4% cost increase with zero additional benefit…
- Los Angeles Port Logjam Tops 50 Ships; Wait Exceeds Eight Days The number of container ships waiting to enter the largest U.S. gateway for transpacific trade swelled to another pandemic record and the average wait jumped to more than eight days, adding delays and costs during peak season for companies to rebuild inventories. The average wait rose to 8.5 days compared with 7.6 in late August, according to L.A. port data.
Early reporters, those with a quarter ending in August, will soon release their quarterly results. Public companies must also pre-announce if and when they realize that their results are much different than their previous guidance. Approaching the end of September, pre-announcement risks grow, particularly given broadly rising costs previously unaccounted for.
So far, pre-announcements remain in line with Q2 at the same time, although 13 fewer companies have pre-announced. Sixty-four are positive or in-line, down from 71 at the same time in Q2. But we are watching the negative line: 40 vs 46.

Not really surprising given than revenue growth is also surprising but on the positive side. Q3 revenues are seen up 29.8%, better than the 24.7% growth seen July 1 and generally more than enough to offset any cost surprises, especially since pricing power is very strong, allowing cost pass-throughs.
Earnings revisions remain positive but increasingly wary investors will scrutinize earnings calls for signs of troubles. Revenue growth for Q4 is at 8.1% (ex-Energy), up from 6.7% on July 1. This is the first risk in an economy still fighting a pandemic.
The meaningful GDP growth slowdown illustrated above has actual repercussions on corporate revenues. It may not show in Q3 as a whole but it likely is being felt in September and guidance should reflect that. Of the 13 fewer pre-announcers in Q3 above, 7 were from companies actually not confirming an in-line quarter.
It follows that the expected 16.3% earnings growth rate for Q4 (ex-E), up from 12.7% on July 1, is also at risk. Even more at risk are 2022 expectations. Current forecasts call for ex-E revenues rising 7.5% and 6.0% in Q1’22 and Q2’22 respectively but earnings growth is seen slowing to 3.5% and 2.6% respectively. For all of 2022, the consensus calls for S&P 500 EPS of $220, up 9.5%, implying a sharp acceleration in the second half. To be confirmed…
Recently, via The Transcript:
- “…as we look at it, August and September revenue is trending below the forecast due to the rising cases of the Delta variant and associated headlines. So in light of those current trends, as you mentioned, this morning, we did revise our third quarter revenue guidance to be down approximately 24% to 28% as compared to the third quarter of 2019.” – American Airlines (AAL) CFO Derek Kerr
- “The Delta variant is having an impact, though, as people are delayed getting back into the offices, and that’s kind of the one area. We’ve seen children pretty much back in school, college is back in session. But offices, where we thought they could probably be coming back in September, seem to be pushing back, and that’s the one area that is kind of dragging in the recovery.” – Cantaloupe (CTLP) CEO Sean Feeney
- “[We’ve seen] a bit of a pickup in recent weeks as we’ve seen increased uncertainty around the Delta variant. (…) As you’ve heard from many of our peers, the supply chain environment remains challenging. In addition to significant input cost inflation, our industry is facing labor shortages that are impacting all aspects of our supply chain from our suppliers all the way through to our distribution network.”- General Mills (GIS) President-North America Retail Jon Nudi
- “It’s down a little bit from July but it’s not a surprise. We expected some amount of pullback based on the fact that stimulus effects are going to wear off.” – Visa (V) CFO Vasant Prabhu
- “Production rates do remain very constrained by supply chain limitations. That’s primarily a semiconductor issue, which is grabbing all the headlines, but it’s not stretching into some other components and parts. We do expect that the supply chain constraints will continue to remain throughout the course of this year and potentially into next” – Cummins (CMI) Executive Director of IR Jack Kienzler
- “…the supply chain issues that have plagued the industry throughout the pandemic have increased during the second half of the year…shortages for a variety of building products, combined with increased production volumes across the homebuilding industry, are directly impacting our ability to get homes closed to our level of quality over the remainder of 2021” – Pulte Group (PHM) CEO Ryan Marshall
- “…persistent and industry-wide raw material availability issues have not improved as anticipated, impacting our ability to fully meet the strong demand…We are now expecting raw material availability, including the unfavorable impact of Hurricane Ida, to negatively impact our third quarter consolidated sales by a high-single digit percentage” – Sherwin-Williams (SHW) CEO John G. Morikis
- “Consensus in the industry is we’re unlikely to see a cleaning up of the situation until deep into next year,” – Maersk CEO Morten Engelstoft
BTW, from the U.S. Census Bureau’s recent Small Business Pulse Survey (via The Economic Innovation Group):
The share of businesses reporting weekly decreases in revenue has held steady for three straight weeks at elevated levels not seen since March. Between 24 and 25 percent of surveyed small businesses reported weekly decreases in revenue from August 16th to September 5th. That elevated share, paired with the decreased share of businesses reporting weekly increases in revenue (only 8 percent), provide evidence that the small business recovery may be stalling in the face of Delta’s resurgence.
Over a quarter of small businesses have seen large increases in the prices they pay for goods and services since the start of the pandemic, with inflationary pressures affecting the construction, manufacturing, and accommodation and food services sectors most acutely. With inflationary pressures driving prices up, 28.2 percent of surveyed small businesses report experiencing large increases in the prices of goods and services relative to before the pandemic. The construction sector, slammed by soaring lumber prices in the early part of the year, was the sector with the greatest share of businesses reporting price increases (52.4 percent). Over 40 percent of businesses in the manufacturing and accommodation and food services sectors also reported large price increases.
US stocks have worst week since June Inflation fears resurface after US producer prices rise more than expected in August
(…) The S&P 500 has gone 34 days without rising 1% in any of them, the longest in 20 months. And the pool of companies feeling significant price pressure keeps expanding. More than half the index’s members have suffered peak-to-trough declines of at least 10% since May, data compiled by Morgan Stanley show.
It’s worse in small-caps, where 90% of Russell 2000 stocks have already suffered their own 10% correction. (…)
Strategists from Goldman Sachs Group Inc. and Citigroup Inc. have issued fresh warnings on the potential for negative shocks to upend the rally. (…)
At the level of individual stocks, corrections are all too tangible. As of Friday’s close, the average stock in the S&P 500 was down 10% from their 52-week highs, according to data compiled by Bloomberg.
Helping keep the market afloat are tech giants like Facebook, Amazon.com Inc. Apple Inc., Microsoft Corp. and Google parent Alphabet Inc., a cohort known as Faang. Without the five, the S&P 500’s 4% advance this quarter would have been halved.
But don’t bet on stocks like the Faangs to continue to prop up the market indefinitely, says Mike Wilson, the chief U.S. equity strategist at Morgan Stanley. Stocks have entered the stage of a market cycle where valuations tend to shrink and even the sturdiest companies can’t escape the drag, he says. Typically, cracks start with the weakest links before the rout goes on to take down the strongest, a process he calls “rolling correction.” (…)
“We think that finishing move will happen in the near term and that it will lead to a benchmark level correction of ~10%.”

I found this was the best comment:
Savita Subramanian, head of U.S. equity and quantitative strategy at Bank of America
“The S&P 500 has essentially turned into a 36-year, zero-coupon bond,” she said. “If you look at the duration of the market today, it’s basically longer duration than it’s ever been. This is what scares me.”
The threat is that “any move higher in the cost of capital via interest rates, credit spreads, equity risk premia, that’s basically going to be a huge knock on the market relative to the sensitivity we’ve seen in the past,” she said.
Charts from Topdowncharts:


TECHNICALS WATCH
My favorite technical analysis firm says that “the full body of evidence continues to reflect a weaker balance of Supply and Demand.” Important momentum measures remain in a dangerous downtrend.
That is in spite of a better week for small caps that helped some breadth indicators.
Last week from SentimenTrader:
Stocks traded on the NYSE decided to make a fool out of those worried about weak breadth. Last week, the Nasdaq joined the party.
After weeks of disturbingly poor internal participation, and a flurry of technical warning signs, stocks on the Nasdaq thrust higher last week. Over the past 10 days, an average of more than 60% of securities on the Nasdaq advanced.
Even more impressively, more than 65% of volume flowed into advancing issues on average each day. Granted, volume at the end of August tends to be low, but it was still focused on the winners.
As we so often see after thrusts like this, the most notable aspect was the ridiculously skewed risk/reward ratio during the past 50 years. Over the next three months, only one signal showed a loss at its worst point of more than -4.1%.
Here’s the rub, though…
Oddly, the thrust triggered when the Composite was trading at a new high. Most of them came after protracted declines. Out of all the signals, only three others triggered with the Composite at (or even near) a multi-year high…and each of them was also a blow-off peak.

HOUSING
- Redfin Housing Market Update
Strong homebuying demand continued through the end of August, with pending sales up 6% from a year earlier, even as new listings of homes for sale fell 7% from 2020 levels. Measures of competition, such as the share of homes sold above list price and the number of homes sold in two weeks, are continuing to soften. Still, home prices remain high, up 14% from the same time a year ago.
“More homes were listed this summer, but they were quickly snatched up by homebuyers even as bidding wars have become more rare,” said Redfin Lead Economist Taylor Marr. “The market hasn’t cooled off any further than it usually does this time of year, and we expect homebuying demand to remain strong through the fall.”
- (…) Asking prices of newly listed homes were up 10% from the same time a year ago to a median of $353,500, on par with where asking prices were in late April. This was down 2% from the all-time high set during the four-week period ending June 27.
- Pending home sales were up 6% year over year, but down 9% from their 2021 peak hit during the four-week period ending May 30.
- New listings of homes for sale were down 7% from a year earlier. The number of homes being listed is in a typical seasonal decline, down 16% from the 2021 peak reached during the four-week period ending June 27.
- Active listings (the number of homes listed for sale at any point during the period) fell 23% from 2020. Active listings were up 14% from their 2021 low set during the four-week period ending March 7, but have declined 3% from their 2021 peak hit during the four-week period ending August 8.
- 47% of homes that went under contract had an accepted offer within the first two weeks on the market, above the 43% rate of a year earlier, but down 9 percentage points from the 2021 peak set during the four-week period ending March 28.
- 34% of homes that went under contract had an accepted offer within one week of hitting the market, up from 31% during the same period a year earlier, but down 9 percentage points from the 2021 peak reached during the four-week period ending March 28.
- Homes that sold were on the market for a median of 19 days, up from the all-time low of 15 days seen in late June and July, and down from 33 days a year earlier.
- 50% of homes sold above list price, up from 33% a year earlier. This measure has been falling since the four-week period ending July 11, when it peaked at 55%.
- On average, 4.9% of homes for sale each week had a price drop, up 0.8 percentage points from the same time in 2020, and the highest level since the four-week period ending October 13, 2019.
- The average sale-to-list price ratio, which measures how close homes are selling to their asking prices, decreased to 101.4%. In other words, the average home sold for 1.4% above its asking price. This measure was down 0.9 percentage points from its peak hit during the four-week period ending July 11 and up 2.1 percentage points from a year earlier.

Here’s what we learned from 6,000+ resale agents this month:
- Sales remain strong, with some typical seasonal slowing.
- Prices continue to rise, with 77% of agents sharing that home prices rose month-over-month.
- Investors are very active in the market and cash is king.
- Buyer competition remains fierce, with 59% of contracts receiving multiple offers nationally.
- Down payments are growing, with 42% of agents reporting higher down payments compared to pre-COVID.
While easing conditions and seasonal shifts in many metros point to less frenzied demand, the market remains strong.
Canada adds 90,000 jobs in August on bump from summer reopenings
The country added 90,200 positions for its third consecutive month of growth, and topped analyst expectations of 66,800 positions, Statistics Canada said Friday. The unemployment rate fell to 7.1 per cent from July’s 7.5 per cent. Canada has recovered about 95 per cent of its pandemic job losses, leaving a deficit of roughly 156,000.
The job market was hit by widespread layoffs in the third wave of the COVID-19 pandemic. But from June to August, as vaccination rates improved and health restrictions were relaxed, employment jumped by around 350,000 positions, erasing all the damage from the spring.
In August, job creation was driven largely by full-time work in the private sector. Accommodation and food services was a standout industry, climbing 74,600 positions on robust gains in Ontario. Labour participation rates have fully recovered in most demographic groups, Statscan noted on Friday. (…)
The total number of hours worked in the economy was little changed in August. Meanwhile, self-employment remains a weak spot, down 7.7 per cent – or 222,000 positions – from when the health crisis started. (…)
The average hourly wage of $29.23 was up 5.2 per cent from two years ago, but only 1.2 per cent this year, after adjusting for compositional changes to the labour force over the pandemic. (…)
Employment in hospitality is down 12.6 per cent, or 153,600 jobs, over the pandemic. In the meantime, employment in other services – which includes hair stylists and massage therapists, among others – is down 11.1 per cent, or 89,800 positions. (…)
COVID-19
Covid-19 Deaths in Delta Surge Hit Younger Unvaccinated People A surge in deaths caused by the highly contagious Delta variant is hitting working-age people hard while highlighting the risks for people who remain unvaccinated.
Federal data show Covid-19 deaths among people under 55 have roughly matched highs near 1,800 a week set during last winter’s surge. These data show weekly tallies for overall Covid-19 deaths, meanwhile, remain well under half of the pandemic peak near 26,000 reached in January. (…)
High vaccination rates among the elderly, who are more vulnerable to severe Covid-19 outcomes, are restraining the overall increase in deaths, some researchers say. The change is shifting a larger share of deaths to younger populations with lower vaccination rates, underscoring the need to get more people inoculated to curb the pandemic, they say. (…)
Deaths have been concentrated among the unvaccinated, federal data show. The CDC released studies on Friday showing that unvaccinated Americans were 4.6 times as likely to be infected, 10 times as likely to be hospitalized and 11 times as likely to die. (…)
About 54% of the overall U.S. population and 63% of eligible people ages 12 and above are fully vaccinated, while the average among nursing homes is 84% for their residents, federal data show. (…)
- US virus cases surged during late summer of 2020, but Europe caught up in October
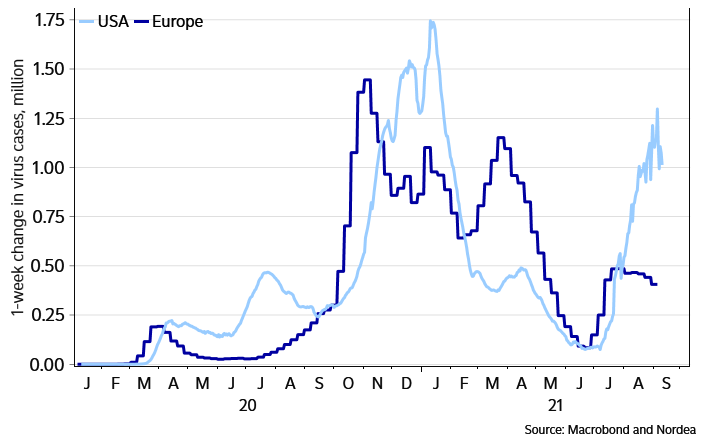
We would like to remind our readers of the virus developments in 2020. Back then US saw a pick-up in virus cases during summer, while the situation in Europe looked contained. A few months later – especially in October – the case count in Europe went on an absolute tear. It could be that this reflects different seasonality for the spread of the virus. The current #Euroboom psychology could thus get dented later this year, weighing on EUR/USD. The same applies from the weakening of China’s credit cycle, we believe.
House Democrats Set to Propose Corporate Tax Rate of 26.5%
(…) Democrats are proposing an increase in the corporate rate that’s currently 21%, offering less than the 28% Biden sought, the people said on condition of anonymity because the measures aren’t public yet. The top rate on capital gains would rise from 20% to 25%, instead of the 39.6% Biden proposed that would have been equal to a new top rate on regular income, the people said. (…)
Beijing to break up Ant’s Alipay and force creation of separate loans app Chinese fintech will turn over user data to new joint venture partly owned by state
Stablecoins Face Crackdown as U.S. Discusses Risk Council Review U.S. officials are discussing launching a formal review into whether Tether and other stablecoins threaten financial stability, scrutiny that could lead to dramatically ramped-up oversight for a fast-growing corner of the crypto market.
(…) Stablecoins have thrived in the unregulated shadows, with tokens in circulation now worth more than $120 billion, according to CoinMarketCap.com. And they are increasingly being used for transactions that resemble traditional financial products — like bank savings accounts — without offering anywhere near the same level of consumer protections. (…)
The President’s Working Group plans to issue stablecoin recommendations by December, and a consensus is building among regulators involved that an FSOC review is warranted, the people said. (…)
Watchdogs have also privately expressed worries about Diem, a stablecoin being developed by an association that includes Facebook Inc. A top concern is that the token’s market impact could be massive because of its potential for widespread adoption — Facebook’s social media network has almost 3 billion active users. (…)
Stablecoins already face another threat from the U.S. government, as the Fed is discussing whether to launch its own digital currency. Powell told lawmakers in July that a central bank token would make stablecoins obsolete.
“That’s one of the stronger arguments in its favor,” he said.
Transitory is the word, again…
Biden Administration Takes Aim at China’s Industrial Subsidies The U.S. is planning a probe into Beijing’s aid for Chinese companies, with new tariffs possible, according to people familiar with the plans.
The White House is also looking to team up with the European Union, Japan and other allies in Asia, and rally support within the World Trade Organization to take on Chinese subsidies. (…)
As part of its review, the USTR has decided to try to enforce China’s commitments under the Phase One accord negotiated by the Trump administration to boost purchases of U.S. goods by $200 billion over 2020 and 2021.
China fell short of those targets by about 40% in 2020 and is now 30% behind its scheduled purchases for 2021, according to calculations by Chad Bown, an economist at the Peterson Institute for International Economics.
A push on subsidies would follow talks on the purchase commitments, which expire at the end of this year. (…)
China experts say it is highly unlikely Beijing would negotiate seriously on subsidies, which it sees as essential to its economic success. (…)
The Stock Market Fails a Breathalyzer Beyond Meat, with pea protein, is worth more than the global market for peas.
Joby Aviation, which plans to begin an electric air taxi service in 2024, is worth more than Lufthansa, EasyJet or JetBlue. Does that seem right? In this market, why not? Heck, earlier this year, Tesla was worth more than the next nine car manufacturers combined, though now only the next six. Beyond Meat, made with pea protein, is worth more than the entire market for peas eaten globally—like the bumper sticker says: Imagine whirled peas. Do fundamentals even matter?
I can go on. Used-car sales platform Carvana is worth more than Volvo, Honda, Ford or Hyundai. Airbnb is worth more than Marriott and Hilton combined. Crypto-exchange Coinbase is worth more than the Nasdaq. I live at the intersection of innovation and disruption, but when companies are worth more than any possible reality, watch out. (…)
Venture capital is cuckoo. After investing $120 billion in the 2000 dot-com frenzy, and just $16 billion in 2002, U.S. venture capital invested $130 billion in 2020 and then $140 billion in the first half of 2021. Startups these days raise money as “the Uber of gardening” or “Space as a Service.” (…)
And check this out: In June, an Italian artist auctioned an invisible statue for $18,000—in reality it was an empty box the artist claimed was a “space full of energy.” (…)
Yahoo was once worth $125 billion and AOL $200 billion during the dot-com bubble. Both are worth 99% less today. Tesla CEO Elon Musk recently tweeted, “I thought 1999 was peak insanity, but 2021 is 1000% more insane!” Remember, when the selling starts, fear of missing out turns into fear of losing everything as speculators jump like rats off a sinking ship.
Today’s negative real yields don’t reflect reality. The Fed has warned it plans on tapering bond and mortgage purchases later this year. Someone is at least reaching for the punch bowl. The compass may stop spinning soon. Until then and always, stick with fundamentals.


 Macro Conditions Deteriorate as Bear Market Probability Rises


