Job Postings Level Off as Delta Variant Cools Demand for Workers Previously strong demand for restaurant, salon and other in-person service positions has eased, but openings remain near records on white-collar strength.
Postings on job-search site Indeed.com were up about 39% at the end of August from February 2020, ahead of the pandemic. That marked a modest gain from the comparable week of July, when postings were up 37% from February 2020.
The August gain was largely driven by increased demand for jobs that can be done from home, such as software development. Postings for child care fell and openings in construction and at restaurants rose only slightly. (…)
Software development postings rose 19% in August, it said, while those for human resources jobs were up 13.2%. Banking and finance postings increased 10.8%. (…)
The share of respondents expecting to work past the age of 62 dropped to 50.1% in the New York Fed’s July labor-market survey, from 51.9% a year earlier — the lowest on record in a study that’s been conducted since 2014. The numbers saying they’re likely to be employed when they’re older than 67 also dropped, to 32.4% from 34.1%.
More than 1 million older workers have left the labor market since March 2020. (…)

My point several weeks ago. After the Great Financial Crisis, many elders needed more income to offset housing and equity losses and lower interest rates. No more, apparently.

The Federal Reserve Bank of New York’s Center for Microeconomic Data released the July 2021 Survey of Consumer Expectations:
- Median one-year-ahead inflation expectations were unchanged at 4.8% in July while median inflation expectations at the three-year horizon increased slightly to 3.7% from 3.6%, its highest reading since August 2013. Our measures of disagreement across respondents (the difference between the 75th and 25th percentiles of inflation expectations) declined slightly at the one-year horizon but increased at the three-year horizon due to a strong increase in the 75th percentile. Both measures of short- and medium-term inflation disagreement remain elevated compared to their pre-COVID-19 levels.
- Expectations about year-ahead price changes were flat for food prices (at 7.1%), increased by 0.1 percentage point for rent (to 9.8%) and medical care (to 9.5%), and increased by 0.5 percentage point for the cost of a college education (to 7.5%). The median one-year-ahead expected change in the price of gas declined by 1.1 percentage points to 8.1%.
- Median one-year-ahead expected [labor] earnings growth rose 0.3 percentage point in July to 2.9%, its fourth consecutive increase and a new series high. The increase was driven mostly by respondents with no more than a high school degree and with annual household incomes under $50,000.
- The mean perceived probability of losing one’s job in the next 12 months increased slightly from a series low of 10.9% in June to 12.2%, the series’ second lowest reading. The mean probability of leaving one’s job voluntarily in the next 12 months also increased to 19.7% from 18.6%.
- The mean perceived probability of finding a job (if one’s current job was lost) rose sharply to 57.0% from 54.2% in June, the fourth consecutive month-to-month increase and the highest level since February 2020. The increase was broad-based across income groups and most pronounced among respondents with no more than a high school degree.
- Conditional on receiving an offer, the average expected annual salary of job offers in the next four months increased to $57,207 from $54,646 in July 2020. The average reservation wage—the lowest wage respondents would be willing to accept for a new job—increased sharply to $68,954 in July 2021, from $64,226 in July 2020.
- Median household spending growth expectations retreated slightly from a series high of 5.2% reached in June to 5.1% in July.
The first D: Delta
Supply chains are still super distressed due to high restriction levels and the “Zero Covid” policy seen in particular in Asia. (…) and as far as we can judge there is no political momentum whatsoever towards scrapping the zero tolerance policy. This likely means that supply chains will remain distressed for years ahead.
The second D: Dignity
Dignity has been re-introduced into fiscal policy. Bailouts have been provided to practically every sector and household – in particular in the US, but also in Europe.
(…) Politicians almost always calibrate the crisis response based on the lessons learned during the most recent crisis. In hindsight, it would have been a good idea to support demand via direct transfers in 2008-2009, which is why this has been the “weapon of choice” to underpin demand during the Covid-19 crisis. The thing is just that Covid 19 is clearly a supply-side crisis rather than a demand shock, but politicians treat it as a demand crisis. Just about everyone will continue to receive bailouts in coming years, even if it is not needed and hence you should expect the unfunded deficits to continue for years to come. Direct transfers are now permanent crisis instruments and will likely be put into use every time there is an economic setback.
This is an inflationary game changer compared to the decade of stand-alone QE policies. The asset swap QE that has been in place as a perma-instrument since the great financial crisis is NOT inflationary on a stand-alone basis, but if it is used to ensure that funding costs remain low, while governments (the true currency issuer) increase the money stock flowing around in the real economy via large unfunded deficits, then we have an inflationary cocktail in place. This is not true MMT, but it looks MMT-like in practice.
The third D: De-globalisation
If supply chain constraints remain a thing for years to come, it will likely also re-increase the incentives to move parts of the supply chain back closer to home soil. The lack of mobility likely also carries repercussions for labour markets where global mobility has been bombed back decades due to restriction levels and the subsequent practical obstacles of moving around. (…)
The fourth D: Dominance
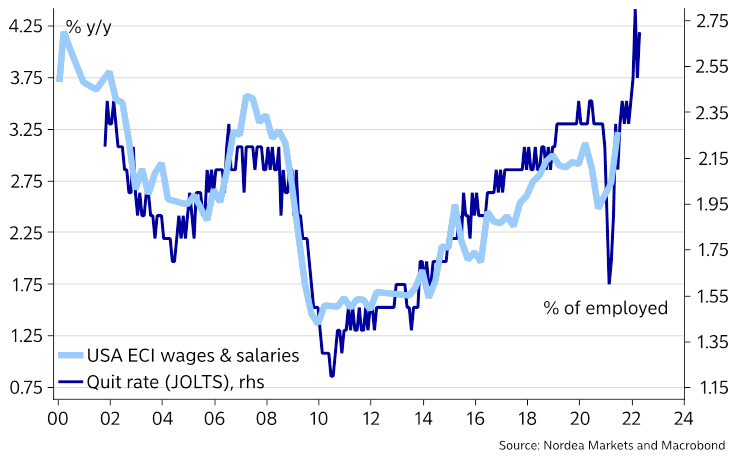
Low mobility paired with bizarre amounts of demand stimulus during a supply-side crisis has led to labour market dominance being turned upside down. Finally workers have the upper hand against employers again, which hasn’t been the case for at least a couple of decades. Consequently, reported issues of job openings being hard to fill have reached all-time highs and while this issue may partially fade if the Covid-19 crisis dissipates, it will likely take years before we return to 2019 levels of mobility. (…)
The fifth D: Disarray
Rising prices of necessities lead to a snowball effect in political risk. Regime shifts are more likely to occur now due to rising prices, which could lead to increased disruptions in central production points. (…)
The sixth D: Dollar
China’s attempts to reservenize the Yuan may also structurally lead to less disinflation exporting by China compared to the most recent couple of decades. Given that China is constantly increasing its trade partner presence across the globe, it may also lead to a structurally stronger CNY and a structurally weaker USD. Even if this view is clearly against our tactical view, it may prove to be an important and lasting structural story.
A potential early adoption of the digital renminbi by frontier and emerging markets may also open the door for a de-dollarisation and a yuanisation (Global: Bitcoin, the Chinese and the dollar) of the global economy.
As China’s GDP and role in world trade continue to grow, it seems natural to expect that countries, especially its neighbouring countries, will to an increasing extent start to use China’s currency as both invoicing and financing currency. And if demand for China’s currency increases, the appetite for dollars will decrease, which – keeping everything else equal – will lead to a continued de-dollarisation in global FX reserves. A process that is already slowly in the making.
The seventh D: Distribution
The above conclusions have likely also led markets to reprice the outcome space of inflation over the coming decade. There are fewer deflationary risk scenarios and more inflationary risk scenarios than before the Covid-19 crisis hit. The fiscal side is back in action, meaning that both monetary policy and fiscal policy will be put into use should disinflationary forces re-enter the frame, which is a game changer for the left-hand-side tail (deflation) of the inflation outcome space, while the potential risk of overheating and labour market-fuelled wage spirals have increased the potential amount of outcomes in the right-hand-side tail (inflation) of the outcome space. The AIT regimes of the Fed (and partly the ECB) have also solidified this conclusion.
Markets seem to acknowledge this as we have noted a much more resilient price action in 5y5y inflation expectations into a tapering scenario than what we e.g. saw in 2013/2014.
We are not certain that an inflationary regime shift has happened, but the outcome space has certainly changed compared to pre-Covid. Prepare accordingly.
So far, the big inflation surprises are concentrated in the USA:

Property sales in the four first-tier cities declined 16% in August from a year ago, according to Bloomberg calculations based on weekly data. Total automobile sales including to companies likely dropped about 22% over the same period, the biggest decline since last March when the nation was still in lockdown to control the initial cases. (…)
“A rapid slowdown in property sector activities could lead to a significant spillover effect on both upstream industrial demand and consumption,” Bank of America economists wrote in a report this week. They estimate that more than 28% of China’s gross domestic product is related to the property sector, and said more policy stimulus in the housing sector is needed to support growth.

(…) The move by Fitch came a day after Moody’s Investors Service cut Evergrande’s credit rating by three notches to Ca, which implies it is “likely in or very near default.” (…) With more than $300 billion of liabilities, Evergrande may roil lenders, suppliers, small businesses and millions of homebuyers should it collapse. Chinese authorities have kept quiet about their plans for the company so far, aside from urging it to resolve its debt risks. (…)
COVID-19


Commodity Markets Are All Gummed Up Commodities are a favorite play at times of high inflation, but there are unusual risk factors right now
(…) Buyers should be aware that they are betting on Chinese climate policy and global trade bottlenecks as much as supply and demand. (…)
Iron ore and steel are easiest to explain but also the most vulnerable to a quick reversal. In early 2021 Chinese property investment, the most important source of global steel demand, was rising at its fastest rate since the early 2010s, while Chinese steelmakers were running factories at full tilt. The combination lifted prices for both steel and iron ore.
The steelmakers were pushing in expectation of tough curbs on output in late 2021: Chinese regulators have repeatedly pledged to limit production this year to 2020 levels, as part of the national plan to cap carbon emissions. Now those restrictions are biting as expected. Many steelmakers can’t produce at all, which has hit iron-ore prices hard, while those still cranking out steel can charge a premium for it. Since June, U.S. hot-rolled coil steel futures are up 6%; iron ore, down more than 30%. (…)
Beijing’s emissions efforts are also supporting the price of aluminum—like steel, a metal whose production is one of the world’s most energy-intensive processes. Shipping bottlenecks are another factor. Last year China became a net importer of aluminum for the first time since 2009, an incentive for traders to move warehouse stocks to Asia. Now, as China’s economy slows, aluminum is marooned in Asian warehouses and struggling to head west—where the demand is—because of those bottlenecks.
One reason copper might be performing worse than aluminum is that the demand-chasing westward shift in inventories is further along. Since May, inventories at the Shanghai Futures Exchange have fallen by more than half, according to Wind, and inventories at the London Metal Exchange have roughly doubled. Sunday’s coup in Guinea, the largest exporter of bauxite—necessary to make aluminum—could exacerbate copper’s relative underperformance. (…)
EARNINGS RISKS?
Rising and unpredictable commodity prices, wage pressures, complexifying supply chains, shortages, all stuff that would normally negatively impact margins and profits.
But it ain’t happening so far, at least judged by pre-announcements: stable positives but fewer negatives than during Q2 through last Friday.

But rising costs are a reality, totally offset so far by very strong top line growth:

But revenues don’t grow out of thin air and top line growth will surely drop a lot in the next 12 months. Analysts don’t see it below 6% but that’s pretty high historically.


Yesterday, paint and specialty coatings giant PPG Industries warned that its Q3 sales would be $225 million to $275 million below what it had expected during its July 19 earnings announcement:
PPG’s sales volumes are being impacted by the increasing disruptions in commodity supplies; further reductions in customer production due to certain parts shortages such as semi-conductor chips; and continuing logistics and transportation challenges in many regions, including the U.S., Europe and China. In addition, raw material inflation for the third quarter is trending higher than previously communicated by about $60 million to $70 million.
Together with the previously disclosed $150M revenue disruption, overall revenues in Q3 appears to be 8-9% lower than expected on July 19, barely 6 weeks ago.
Thankfully, “aggregate global economic demand remains robust”, so these are merely “transitory” supply problems and “When supply conditions normalize, the company continues to expect strong sales growth into 2022”.
That is what needs to be carefully monitored, particularly for cyclical companies.
PPG is not simply waiting for “robust global demand” to transpire in its revenue line: “the company reported that it continues to make measurable progress implementing selling price increases to help offset the elevated raw material costs, and is seeking further increases. Overall price increases for the third quarter are estimated to be about 5% with similar contributions from both operating segments.”
That follows price increases of 3.5% implemented during Q2. Goldman Sachs estimates that PPG needs to boost pricing 10-12% during Q3 to cover rising costs.
Maybe they will succeed…but I wonder how that would impact demand volume…, let alone any negative cyclical slowdown.
And whether these price increases will prove transitory also remains to be seen.
Four weeks left before quarter end. Let’s hope!
This chart will soon come in handy:

BTW:
Morgan Stanley, Citigroup Inc. and Credit Suisse Group AG are all cautioning investors on the outlook for U.S. equities. Citing “outsize risks” to growth through October, Morgan Stanley slashed American stocks to underweight and global equites to equal-weight. With the Delta variant continuing to slow the return to normal, and policy debates in Washington getting bogged down, the bull case is getting harder to make. Citigroup said that bullish positions in U.S. stocks currently outnumber bearish ones by 10 to 1, meaning that any correction could quickly become amplified. (Bloomberg)
That’s today’s FT headline.
Bloomberg adds:
The debate on Wall Street over investments in China is heating up, with billionaire investor Ray Dalio saying the opportunities in the nation cannot be neglected. His comments come the day after George Soros criticized BlackRock Inc.’s push into the country as both a risk to clients’ money and U.S. security interests. Meanwhile, government mouthpiece publication The People’s Daily ran a front page editorial trying to ease foreign investor concerns that President Xi Jinping’s regulatory crackdown would hurt them. One unusual thing that Xi’s polices are causing is a robust public debate within China, something rarely allowed under Communist Party rule.
Two essays on China, from Bloomberg and Geopolitical Futures.
- Xi Jinping May Be Leading China Into a Trap “Common prosperity” has been portrayed as an effort to reduce income inequality and reassert core Communist Party values. In reality, it risks leaving the country stuck at middle-income status.
(…) The middle-income trap describes how economies tend to stall and stagnate at a certain level of development, once wages have risen and productivity growth becomes harder. Relatively few make the transition to high-income status. The history of those that have, such as South Korea and Taiwan, points to a need for the state’s role to retreat as markets advance. Ad hoc interventions by governments may work at more basic levels of development. At higher income levels, economies become too complex for command-and-control management by individuals. Systems are increasingly what matters. Rules that are transparent, predictable and fairly applied enable market forces to take over the job of directing economic activity, raising efficiency and allowing innovation to flourish.
This inevitably implies some ceding of power by the rulers. It also potentially implies political change. South Korea and Taiwan both transitioned from authoritarian to democratic political systems as they became richer. The largest high-income economies are almost all democracies. (…)
Browbeating technology corporations into making charitable donations or erasing wealthy, tax-dodging celebrities from the internet may grab attention but won’t change the fundamental equation. The real action is in institution-building: developing pension and social security systems; changing the hukou residential permits that discriminate against rural migrants; implementing a recurrent property tax; remodeling the system of land-use rights so that farmers get fair compensation when local governments appropriate their land for development. These reforms are necessary both to reduce inequality and to lay the foundation for further income growth. China has talked about such changes for years, and indeed China 2030 gives significant space to them. Yet progress has been scant to nonexistent in many areas. (…)
Populist crowd-pleasers such as bringing over-mighty tech corporations to heel deflect attention from the failure to tackle more intractable challenges. Xi’s motivation may have more to do with shoring up support for the party than effectively addressing the underlying issue. (…)
Magnus, who devoted a chapter to the middle-income trap in his 2018 book Red Flags: Why Xi’s China is in Jeopardy, argues that in pursuing these policies and strategies, “China’s government will stifle incentives and innovation, and make it even more difficult to generate the productivity growth that all high-middle-income countries need to avoid the middle income trap.” (…)
If Xi succeeds in steering China into the high-income bracket without undertaking the institutional reforms that have accompanied the transition in other countries, then it would rewrite the rules of conventional economics and burnish the international standing of Beijing’s authoritarian governance model. Developed democracies have hardly demonstrated their superiority in this regard recently, having failed to reverse their own decades-long trend of widening inequality (even if disparities mostly remain far narrower than in China). (…)
The likelihood is that in resisting reforms other economies have found necessary to compete at higher income levels, Xi will condemn China to a future of subpar growth. Galloping away from prescriptions that would limit the autocratic power of the Communist Party, he may end up inadvertently undermining the foundations of its legitimacy. Some appointments with destiny cannot be dodged.
(…) Xi’s approach to governing a state as large and unwieldy as China has generally been to test the limits of how much one man and his inner circle can effectively micromanage.
The bulk of Xi’s reforms have been motivated by one of two things. One set could be described as sound policies aimed at heading off one of the many potential existential crises keeping party leaders awake at night – a cascading financial collapse, environmental collapse, corruption and institutional rot, and so on. The other set has been aimed purely at cementing the CPC’s control over just about every critical lever of power, including propaganda, the dispensation of prosperity, and the People’s Liberation Army.
The latest campaign, though, is focused on reforming Chinese culture itself. Judging by the sheer number of domestic targets in the CPC’s crosshairs, there’s quite a bit preventing China from, to borrow from the aforementioned essay, “controlling all the cultural chaos” and developing a “lively, healthy, masculine, strong and people-oriented culture.”
There are, to start, the money-grubbing ways of China’s wealthy capitalists – those resisting a “transformation from the capital at the center to people at the center.” Since July, Xi and state media have been banging the drum about “common prosperity.” There’s fire behind the rhetorical smoke here: A number of new policies targeting “excessive incomes” are reportedly in the pipeline, and the recent tech crackdown illustrated just how far Beijing is willing to go to bring them into line. High-profile Chinese conglomerates have evidently been spooked; charitable donations have soared over the past month.
There’s also the influence of Western culture, with Beijing introducing new policies tightening its grip on the entertainment sector and clamping down on social media adulation of celebrities (at least one of whom is also being publicly targeted for tax evasion). Artists who don’t “meet political or moral standards” will be banned from transitional broadcasters and streaming platforms. On Sept. 2, Chinese regulators ordered entertainment programs to reject “sissy pants” celebrities, going out of their way to denounce the pernicious influence of effeminate men.
And then there’s education. Beijing effectively wiped out the lucrative private tutoring industry in July by requiring most companies to convert to nonprofits. This was meant partly to ensure equal access to education regardless of social class. It was also motivated by Beijing’s long-held desire to control what the kids are learning these days. Beginning this month, the president’s eponymous ideology – “Xi Jinping Thought on Socialism with Chinese Characteristics for a New Era” – will start being taught in lower levels of primary school. (To make the impossibly dry doctrine more interesting to grade schoolers, it’s being reframed as “Grandpa Xi’s” wisdom on being good party- and country-loving citizens.) And last month, Beijing banned minors from playing video games on school nights and all but a few hours on the weekend.
Combined with state media’s promotion of inflammatory Maoist articles, all this has sparked concern over whether a second Great Proletarian Cultural Revolution is taking shape. The first one, which Mao launched in 1966 as a way to cling to power, killed hundreds of thousands of people and basically set modernization of the Chinese economy and state back a full generation. The fear that Xi’s assiduous cultivation of a Mao-like personality cult (now strictly forbidden in the CPC’s constitution) will give him the power to burn down the system in order to save it is understandable.
To be sure, there are some similarities between now and then. Both Mao and Xi have demonstrated a willingness to sacrifice economic growth for the party’s power. Like Mao, Xi appears to have few qualms about scapegoating the rich and tagging them as capitalist, counterrevolutionary servants of the West. Both believe firmly in the power and importance of ideology and the corrosive potential of foreign influences. Both have had good reason to assume their power is never quite as secure as it appears, and both understand that catering to the masses at the expense of coastal elites is a good way to get what you want.
But there are also some important differences. For one, it’s doubtful that this is any sort of bid by Xi to reclaim lost power or head off a major internal challenge. The opposite was the case with Mao, who was sliding toward mere figurehead status in 1966 after the disasters of the Great Leap Forward had come to light. With Xi widely expected to buck precedent and stick around for a third term as party secretary at next year’s Party Congress – or even promote himself to some higher rank – continued grumblings about his consolidation of power from some corners of the party elite are inevitable. But it’s nearly impossible at this point for any faction to take him down without putting the party itself at serious risk.
Meanwhile, there are signs that Xi is attempting to prevent the cultural reform push from getting out of hand. Accompanying the calls for “common prosperity” in state media, for example, have been a number of articles aimed at assuaging the worst fears of China’s business community. Taken comprehensively, the message has effectively been: We don’t think being rich is bad and in fact want more people to be rich. Just do it on our terms, or else. This is very much in line with Xi’s philosophy, which sees markets as important and merely in need of oversight. Notably, state media edited out some of the most inflammatory parts of one prominent neo-Maoist essay (including a line describing recently targeted tech giants like Ant Group and Didi as foreign agents opposed to the people). And, for the first time, Xi, whose own father was purged and sent to work in a factory in the 1960s, appeared to implicitly denounce the Cultural Revolution, albeit quietly in the form of a footnote in one of the new primary school textbooks espousing his grandfatherly thoughts.
In reality, there’s probably not all that much new to see here. It’s doubtful that this is a desperate play by Xi to save himself and extend his reign ahead of the Party Congress, nor is there much reason to believe he’d wipe out the economy for the sake of party purity. It’s merely his latest flex in the service of several long-held goals, particularly finding a way to govern China and curb existential threats to its stability without snuffing out its dynamism. To date, he’s tried to do this mostly by micromanaging China through sheer force of will. This makes it so no amount of power will ever be enough for Xi. A government can only do so much. So he seems bent on getting the public, broadly speaking, to march to the same tune and get in the habit of reforming itself without being asked.
If there’s an added sense of urgency to the campaign, it’s because Beijing has good reason to think conditions are perpetually ripe for rapid deterioration. China has entered a prolonged slowdown in economic growth as the model that fueled its rise runs out of steam, and untold numbers of Chinese citizens are still very poor. Relations with the most important buyers of Chinese products and underwriters of Chinese investment, meanwhile, are quite likely to worsen, and a full-on clash with the U.S. and its friends can’t be ruled out. Given the magnitude of the pressures his country is facing, from both inside and out, Xi is pushing for a China that’s fully behind him when the time comes for painful decisions or an unavoidable period of severe deprivation. In Xi’s China, in other words, the next crisis is always, inevitably, just around the corner. This is no country for sissy pants.
Meanwhile, in America:

Data: National Student Clearinghouse. Chart: Kavya Beheraj/Axios