The Fed yesterday told us that it’s going to be lower for longer. Just about everything, actually: GDP growth, inflation, employment growth, interest rates. However, many pundits now say that this means higher for longer for equities.
Consumer Spending Grew at Slower Pace in July Americans increased their spending by 1.9% in July, the Commerce Department reported Friday, a slower pace than in the prior two months as coronavirus infections picked up across the U.S.


Jobless Claims Remain Historically High New applications for jobless benefits fell slightly to one million last week
The number of people collecting unemployment benefits through regular state programs, which cover most workers, edged down to about 14.5 million for the week ended Aug. 15. So-called continuing claims, which are released with a one-week lag, hit a high of nearly 25 million this spring but have declined in recent weeks, a sign companies are bringing back workers. (…)
Job postings on Indeed declined for two consecutive weeks in August, which Ms. Konkel said could point to an economic backslide. Indeed job listings for higher-wage occupations have declined more than for lower- and middle-wage positions. Such a trend could point to long-term uncertainty among employers, as those in higher-wage sectors might plan their head counts based on projections for business demand several quarters into the future, according to Indeed. (…)
The percentage of consumers in the Conference Board’s survey saying jobs are plentiful dropped to 21.5% in August from 22.3% in July. Meanwhile, those claiming jobs are hard to get rose to 25.2% this month from 20.1%. (…)
A combined 1.4 million Americans applied for regular state unemployment and Pandemic Unemployment Assistance last week. As of Aug. 8, over 27 million Americans relied on some form of unemployment.

Data: U.S. Department of Labor; Chart: Axios Visuals
Fed Shift on Inflation to Usher In Longer Era of Low Rates The Federal Reserve approved a major shift in how it sets interest rates by dropping its longstanding practice of pre-emptively lifting them to head off higher inflation, a move likely to leave U.S. borrowing costs very low for a long time.
(…) The revamp is designed to address the “reality of a quite difficult macroeconomic context of low interest rates, low inflation, relatively low productivity, slow growth and those kinds of things,” said Fed Chairman Jerome Powell during a conference broadcast online. “We’ve really got to work to find every scrap of leverage in helping stabilize the economy.” (…)
If investors believe the Fed’s words are credible, the changes announced Thursday “will increase the accommodative power of policy,” said former Fed Chairman Ben Bernanke. “When you go into a recession, markets will expect a longer period of easier policy and that will, in turn, increase the amount of effective stimulus.”
For years, the Fed justified plans to withdraw stimulus as the economy recovered by warning that waiting too long to do so could provoke an acceleration of price pressures, particularly as joblessness fell below a level expected to push prices higher, sometimes referred to as the natural rate of unemployment. (…)
The Fed said Thursday that decisions to raise interest rates would be guided by a desire to avoid shortfalls of employment from its maximum level, rather than all deviations above or below the maximum level.
“They believe, and I agree, that there are substantial social benefits from a strong labor market,” said Mr. Bernanke. “Under this strategy, they will not take any steps to cool the labor market unless there is clear evidence of inflationary pressure.”
The change “reflects our view that a robust job market can be sustained without causing an outbreak of inflation,” said Mr. Powell. (…)
The Fed didn’t specify exactly how high or how long it would allow inflation to rise above 2%. (…)
While Mr. Powell indicated the Fed had made a strong labor market its top priority, he said the central bank needed help from elected officials with the power to change taxes, spending and regulation. “It needs to be an all-of-government, all-of-society kind of thing,” he said. “We really need it to be broader than just the Fed.” (…)
-
The WSJ editorial board: Low Rates Forever! The Federal Reserve takes a leap into the monetary unknown.
(…) One happy result is that the Fed is all but abandoning the discredited Phillips Curve, the theory that policy makers must trade off between employment and inflation. The Fed previously tried to head off inflation by raising rates whenever it thought the unemployment rate was falling too far—whatever that meant—but now the Fed will wait for inflation to appear before acting.
Abandoning the Phillips Curve is a win for the economy, but it comes at a substantial cost in this review as the Fed also is overhauling its inflation target. Since the Fed adopted inflation targeting in the late 1990s and early 2000s (and formalized a 2% target in 2012), policy makers have viewed the target as a ceiling.
No longer. The Fed now will aim to achieve “average” inflation of 2%, meaning it will tolerate periods of faster price rises to compensate for periods when inflation falls short. Mr. Powell believes such a symmetrical target is necessary to “anchor” inflation expectations.
This is a political minefield because the definition of the inflation time period will always be open for debate. Mr. Powell and future Fed chairs will face pressure to maintain low rates to compensate for some protracted period of low inflation, or because a Senator or Twitter-happy President “believes” inflation will fall below target in the near future.
That increases the economic risk that the Fed might end up looking through inflation until it’s too late. Having effectively admitted it no longer fully understands the relationship between economic growth, employment and inflation, the Fed still promises to decide in real time when its healthy above-target inflation has become dangerous. If the central bank gets this wrong, it could be forced to raise rates much higher, much faster than it would want.
The more glaring problem is the long list of questions the Fed didn’t review. The most important is Mr. Powell’s observation, offered without elaboration Thursday, that business cycles now end in destructive financial crises. The Fed thinks this is a regulatory problem to be solved with stricter capital rules and stress tests.
It might instead ask whether its preference over two decades for “looking through” rising asset prices such as oil, gold and housing to keep rates low is contributing to financial instability instead of economic growth. Without exploring this question, the Fed has adopted a strategy with a built-in bias for low rates. The result is almost certain to be more financial manias, panics and crashes.
There are other unanswered questions. For instance, the Fed now assumes that the economy’s natural rate of growth, and thus its natural interest rate (“r-star” in the lingo) are in a natural decline for demographic or other reasons. Mr. Powell cites this as a justification for the Fed’s new symmetrical inflation target.
Well, what if there’s nothing natural about falling growth because the Fed’s policies are causing it? Research suggests sustained low rates can dent an economy’s growth potential by steering investment to unproductive uses, sustaining zombie companies, rewarding corporate financial engineering instead of capital expenditure, and contributing to asset booms and busts. It’s a shame the Fed has decided to double down on its low-rate, quantitative-easing bets before such a self-examination.
The Fed says its review is a result of careful study, including a national listening tour in which officials met with ordinary Americans. The truth is that it’s a leap into the monetary unknown and potentially a very expensive one.
-
John Authers: Powell’s Three-Wheeler Doesn’t Need a Speed Limit This economy can’t run hot enough to generate inflation of more than 2%.
(…) There are many reasons for the persistent undershoot. The critical one is that changes in the labor market, which is now dominated by relatively low-paying and non-unionized jobs in services, mean that rises in employment are less likely to lead to strong gains in wages. In these circumstances, pressing to eliminate inflation at the first sign of strength in the job market is politically unfeasible.
(…) the current leadership has concluded the Fed raised rates too quickly after the last crisis, and is determined not to make that mistake again. The problem, as put neatly by my colleague Brian Chappatta, is that while the Fed has demonstrated immense power to move markets and asset prices over the last decade, it has shown no similar power over the economy. Its conventional tools are no longer enough to push inflation permanently above 2% (…).
Plainly the Fed will be more dovish than before, all else equal. Berenberg’s Levy was caustic but fair:
(…) it reflects the Fed’s lack of understanding of the actual inflation process. In reality, inflation has remained sub-2% because the Fed’s policies have failed to stimulate a persistent increase in nominal GDP above productive capacity, so that, with little excess demand, there is only modest inflation. So the issue remains: will the Fed’s ultra-easy policies actually stimulate accelerating economic activity, or just pump up asset prices and make the stock market happy? (…)
One might suggest that the FOMC is disbanded, only to be revived if and when inflation exceeds 4% for more than 6 consecutive months. Even then, the bond vigilantes would take over and do the job for the FOMC.

- Job Seekers, Homebuyers, Stock Investors Are Expected to Benefit From Fed’s New Strategy Cost of borrowing is now likely to stay low ‘forever and a day’
(…) With the economy recovering slowly from a deep second-quarter contraction and unemployment above 10% in July, it could be years before the Fed gets to test its new strategy. Short-term interest rates are already near zero, meaning the central bank has little room to cut them to stimulate the economy, and much less than in past downturns. (…)
“The Fed has vowed to be supportive or as supportive as possible,” said Michael Lorizio, a senior trader at Manulife Investment Management. That, he said, is “going to increase the appetite for risk assets” like stocks and corporate bonds. (…)
(…) In view of how price deflation and slumps in profitability damage corporate credit quality, the Fed’s more relaxed approach to inflation targeting and increased tolerance of low unemployment rates ought to narrow corporate credit spreads. Notwithstanding a likely rise in longer term Treasury bond yields stemming from an increase in inflation expectations, corporate borrowing costs still might decline in response to a narrowing of the still historically wide spreads of medium- and speculative-grade corporate bonds and loans.
If the Fed can afford to push harder for economic growth and lower unemployment over the next five to 10 years, corporate debt ought to outperform U.S. Treasury debt. In turn, the downside risks facing corporate borrowing activity will be lower than otherwise. (…)
On balance, a more pro-growth strategy on the part of the Federal Reserve would benefit corporate credit quality and help to prevent the downturns in rated corporate borrowing that occurred in the past. If companies are more convinced of a long stay by a relatively low federal funds rate, balance sheet leverage is likely to be greater than otherwise. (…)

Perhaps, eventually. For now, the TD Bank, one of the best managed banks in North America, yesterday hiked its provisions for credit losses more than its peers, noting that “its credit provision models use historical data and that since we are in unprecedented times, an additional layer of conservatism was appropriate.”
U.S. Pending Home Sales Advance Slows, but Still Strong
After substantial gains in May and June, pending home sales increased by a more moderate amount in July. According to data compiled by the National Association of Realtors, their index was up 5.9% in July from June at 122.1 (2001=100 and +15.5% y/y). From a recent trough in the index of 69.0 in April, these home sales increased 44.3% in May and 15.8% in June. The July volume was the largest amount since October 2005. The home sales were supported by the continuing decline in mortgage rates during July, which reached a record low of 3.06% for the Mortgage Bankers Association contract rate during the week of August 7.
Pending home sales rose again in all the major regions of the country, although the gains were noticeably smaller than in June and just fractions of their May surges. The largest increase was in the Northeast, 25.2% (20.6% y/y) to 112.3, which is the largest amount for that region since April 2005. July sales were up 6.8% in the West to 106.4 (+13.2% y/y) and 3.3% in the Midwest to 114.6 (15.4% y/y); the latter is the highest since November 2005. Sales did increase in the South, but just barely, 0.9%, to 142.0 (+14.9% y/y), although that is the highest ever for that region

Attempting to smooth the V, the index averaged 98.8 in the last 5 months since March, 8.4% lower than the previous 5-month average and 3.2% below February’s level. With this 5-m averaging, the NE looks much weaker than July suggests: the NE index averaged 77.7 in the last 5 months, down 17.5% from the previous 5 months and 19.3% below February’s.
An extraordinary set of circumstances has created the perfect car seller’s market. (Axios)
- In mid-March, every major auto manufacturer stopped production — for the first time since World War II.
- That led to a shortage of vehicles on dealer lots, in particular pickup trucks and SUVs.
- Used cars grew scarce too, as fewer people traded in vehicles or returned leases during the pandemic’s early lockdowns. And many banks aren’t collecting on bad auto loans, either, meaning that fewer vehicles than usual were repossessed.

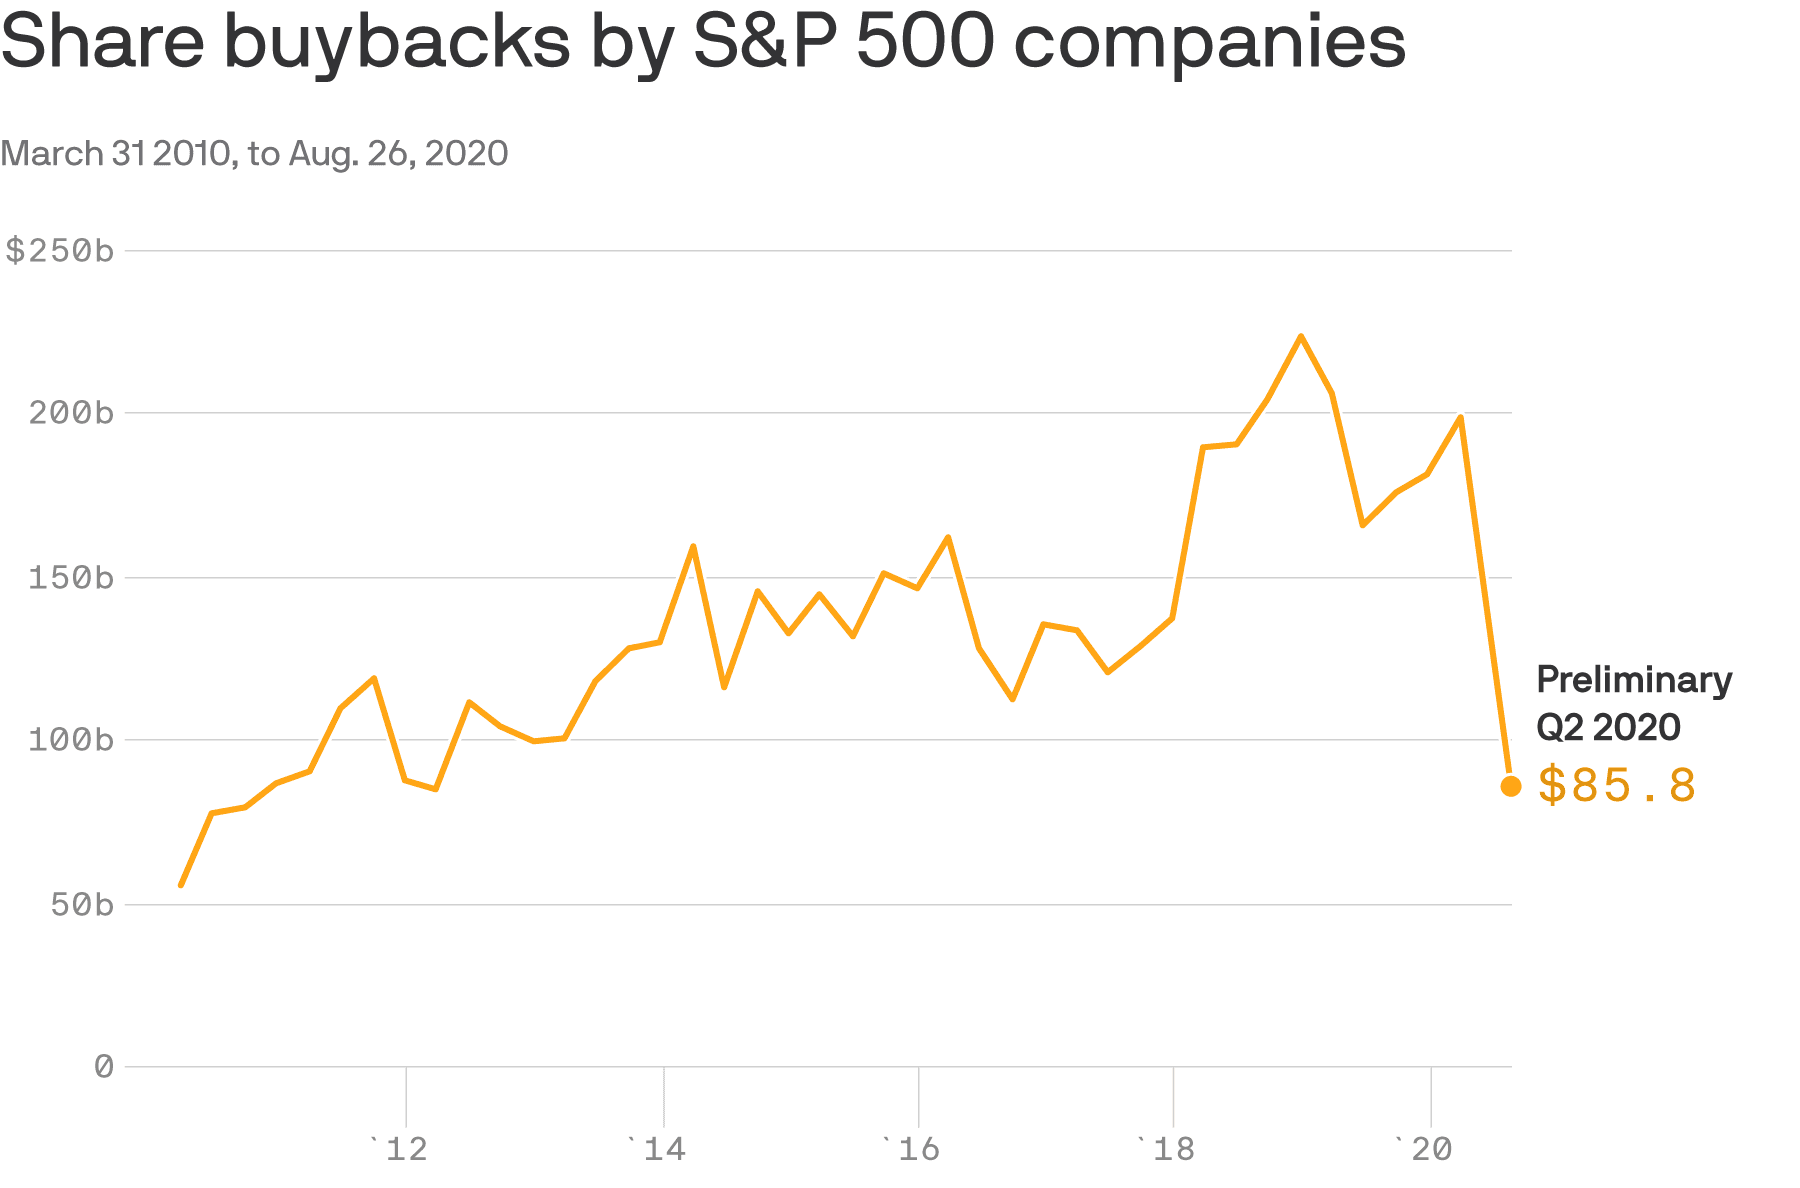
Buybacks stage a comeback (Axios)
A slew of companies put stock buyback plans on ice at the onset of the pandemic. Now some of them are beginning put share repurchases back on the table.
The ramping up of stock buybacks is a sign that swaths of corporate America feel confident enough to return to some sense of normalcy, even as millions of Americans are still dealing with the harsh fallout from the coronavirus-hit economy.
Intel said last week it would resume the previously announced $20 billion stock buyback plan that it put on ice when the pandemic hit. The company said “repurchases are prudent at this time, given the strength of the company’s balance sheet,” per its SEC filing.
- Auto parts retailer O’Reilly Automotive restarted its share repurchase program in May after evaluating “business conditions and liquidity,” executives said on an analyst call last month.
- Agilent, which manufactures lab equipment, also said it would restart its regular pattern of buybacks. “We felt for some time that [fiscal] Q3 … would be the toughest quarter for us for the year. We’re through that now,” CEO Mike McMullen said to analysts.
- A Barclays analyst predicts Honeywell is among manufacturers that will likely resume or ramp up stock buyback programs “as early as the current quarter,” Bloomberg notes.
(…) S&P 500 companies spent nearly $86 billion dollars on stock buybacks so far this quarter, by Silverblatt’s count — a marked slowdown from the $165 billion companies spent on repurchases this time last year. (…)

Yesterday, Lowry’s Research noted that “Buying Power dipped to another new low, its lowest since May 15, although Selling Pressure remained stable.”
FYI:




 More sad and dangerous messiness…