Virus Update
- Global cases reach 90,926; 53% of them have recovered; death toll rises to 3,123
- South Korea reports 374 more cases; total 5,186; 31 people have died. Just two weeks ago there were fewer than 50 confirmed infections there.
- Seattle officials requisition motel to quarantine patients
China’s death toll from the virus climbed by 31 on March 2 to 2,943, China’s National Health Commission said. All the latest fatalities were in Hubei province, the epicenter of the outbreak. The province had 114 additional confirmed cases on March 2. As a whole, China reported 125 additional infections, bringing total cases to 80,151.
Italy on Tuesday reported about a 20% increase in new cases to a total of 2,036, by far the largest number in Europe, and its death toll rose to 52.
The number of confirmed cases in Germany has risen to 188 and the virus has spread to 13 of the country’s 16 federal states, the Robert Koch Institute said on Tuesday.
Belgium’s federal public health service said they had found five new cases after conducting tests the previous night. All of the patients had been traveling in the north of Italy.
State officials confirmed Georgia’s first coronavirus infections in two residents of Fulton County who live in the same household. One recently returned from Italy, the center of the outbreak in Europe. Both individuals have mild symptoms and are isolated at home.
Over the past day, new cases were also reported in five other states. Six people have died in the U.S. after contracting Covid-19, the respiratory disease caused by the coronavirus.
The number of infected people in the U.S. is now 105, as the number of confirmed cases outside of mainland China crossed 10,000.
Massachusetts health authorities said a woman in her 20s who lives in Norfolk County is thought to be the state’s second coronavirus case. The woman traveled to Italy with a school group and is recovering at home. Massachusetts officials have tested 12 residents for the virus since January.
“TOTALLY PREPARED”?
(…) “We’re not remotely prepared,” Dr. Alex Greninger, an assistant professor in the Department of Laboratory Medicine and an assistant director of the Clinical Virology Laboratory at the University of Washington Medical Center, told Live Science. (…)
The United States has been “exceptionally fortunate to not have [had] many cases,” Greninger said, but the Trump administration has wasted precious time, which could have been used to develop and disseminate tests for the virus in all 50 states. (…)
In early February, the CDC sent testing kits to labs across the U.S., but a glitch in the kits made them unusable. Now, more than a month later, just five state health departments — in California, Illinois, Nebraska, Nevada and Tennessee — as well as the CDC, have the ability to test for the virus, known as SARS-CoV-2.
There’s so much backlog now, that getting results from the CDC can take several days, said Dr. William Schaffner, an infectious-disease specialist at Vanderbilt University in Tennessee. (…)
From ZeroHedge:
During VP Pence’s virus press conference, FDA Commissioner Stephen Hahn confirmed that the US will be able to perform around 1 million tests by the end of the week. (…) However, there is one more concerning thing as US authorities appear to take a page out of communist China’s authoritarian playbook. As Jedd Kegum noted on Twitter, the CDC has stopped disclosing the number of Americans tested for coronavirus.
On the left is how the website looked last night. On the right is what it looks like now, with the testing info removed.

FYI, South Korea has more than 500 coronavirus testing sites, which have screened more than 100,000 people. It is only by testing that you find infected people.
-
 “NYC ER doctor: I have to ‘plead to test people’ for coronavirus” https://youtu.be/0Wg_OTTzUv8
 Coronavirus far more likely than Sars to bond to human cells due to HIV-like mutation, scientists say
The new coronavirus has an HIV-like mutation that means its ability to bind with human cells could be up to 1,000 times as strong as the Sars virus, according to new research by scientists in China and Europe. (…)
Scientists showed that Sars (severe acute respiratory syndrome) entered the human body by binding with a receptor protein called ACE2 on a cell membrane. And some early studies suggested that the new coronavirus, which shares about 80 per cent of the genetic structure of Sars, might follow a similar path.
But the ACE2 protein does not exist in large quantities in healthy people, and this partly helped to limit the scale of the Sars outbreak of 2002-03, in which infected about 8,000 people around the world.
Other highly contagious viruses, including HIV and Ebola, target an enzyme called furin, which works as a protein activator in the human body. Many proteins are inactive or dormant when they are produced and have to be “cut” at specific points to activate their various functions.
When looking at the genome sequence of the new coronavirus, Professor Ruan Jishou and his team at Nankai University in Tianjin found a section of mutated genes that did not exist in Sars, but were similar to those found in HIV and Ebola.
“This finding suggests that 2019-nCoV [the new coronavirus] may be significantly different from the Sars coronavirus in the infection pathway,” the scientists said in a paper published this month on Chinaxiv.org, a platform used by the Chinese Academy of Sciences to release scientific research papers before they have been peer-reviewed.
“This virus may use the packing mechanisms of other viruses such as HIV.” (…) Compared to the Sars’ way of entry, this binding method is “100 to 1,000 times” as efficient, according to the study. (…)
In a follow-up study, a research team led by Professor Li Hua from Huazhong University of Science and Technology in Wuhan, Hubei province, confirmed Ruan’s findings. (…)
Chinese researchers said drugs targeting the furin enzyme could have the potential to hinder the virus’ replication in the human body. These include “a series of HIV-1 therapeutic drugs such as Indinavir, Tenofovir Alafenamide, Tenofovir Disoproxil and Dolutegravir and hepatitis C therapeutic drugs including Boceprevir and Telaprevir”, according to Li’s study.
This suggestion is in line with reports by some Chinese doctors who self-administered HIV drugs after testing positive for the new coronavirus, but there is as yet no clinical evidence to support the theory. (…)
Coronavirus Is Rapidly Hitting Supply and Demand Fast-spreading disease snarls factories, business travel; White House vows epidemic is ‘not going to sink the U.S. economy’
BMW says coronavirus hit China sales but sticks to 2020 global target
BMW (BMWG.DE) on Tuesday said its China sales have taken a hit this year because of the new coronavirus, but stuck to its target for growing passenger car sales for the year, and said its global supply chain has not been disrupted. (…)
“We see no impact outside China. We’re sticking to our target of achieving slight growth in car sales,” Zipse said. (…)
“We only have short-term visibility. Supplies have been secured for the next three weeks,” Zipse added.
Coronavirus delays PC and smartphone shipments for weeks China factories struggle to hit full capacity amid warnings of lasting supply chain impact
iPhone Maker Expects Return to Normal in China by End-March The manufacturer expects to resolve severe labor shortages brought on by the coronavirus outbreak.
Hon Hai Precision Industry Co., [Foxconn] Apple Inc.’s most important manufacturing partner, expects its Chinese plants to begin operating normally by the end of March after resolving severe labor shortages brought on by the coronavirus outbreak. (…)
Hon Hai said Tuesday its factories are now operating at about 50% of seasonal capacity but that should ramp up over the course of the month as workers stream back into its plants. (…)
Business across all of Hon Hai’s four major divisions should decline in the March quarter compared with the previous year, meaning sales in the first half could end up being flat, Liu told investors and reporters on a conference call.
“There’s not a huge hit on demand yet so far, but I dare not and don’t want to predict the outlook of the outbreak,” Liu said. “We don’t see a huge issue with our suppliers and we are helping them to secure resources.” (…)
Hon Hai, which also makes products for companies from HP Inc. to Sony Corp., has said it is restarting facilities throughout China in an orderly manner. Other key tech and Apple suppliers with major Chinese operations, such as Quanta Computer Inc., Inventec Corp. and LG Display Co., are also gradually bringing their factories back online. (…)
From the FT:

G-7 Set for Emergency Virus Call With Economy Under Threat
Group of Seven finance chiefs will hold a rare conference call Tuesday under pressure from investors to match their pledges to shield the world economy from the coronavirus with action.
Bank of England Governor Mark Carney reiterated his institution will act to safeguard the U.K. economy if needed, after European Central Bank President Christine Lagarde belatedly followed counterparts on Monday to say officials are also “ready to take appropriate and targeted measures.” (…)
A draft of the communique lacks a call for easier and united fiscal and monetary policies, according to Reuters. (…)
Governments are facing demands to shore up demand too and target spending on corners of economies that need it, such as healthcare or cash-strapped businesses. Indonesia’s government said on Tuesday it is working on a second aid package. (…)
Australia Cuts Rates to Tame Virus Pain
China will further reduce taxes and fees to deal with the coronavirus situation and support the economy, Wang Jianfan, head of tax administration department at finance ministry, said.
Coronavirus shatters trust in Iran’s leaders Islamic regime isolated and under pressure as outbreak spreads
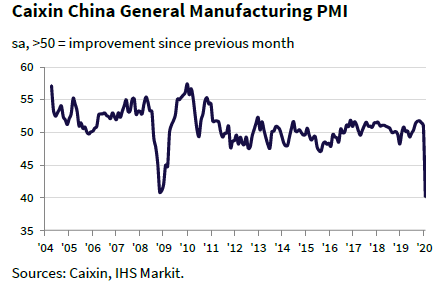
U.S. Manufacturing PMI: Manufacturing output growth weakens amid slower upturn in new orders
U.S. manufacturing firms signalled a loss of growth momentum in February as operating conditions improved at only a marginal pace. Overall growth was the slowest for six months amid historically subdued expansions in output and new orders. Nonetheless, firms registered the strongest degree of optimism for ten months. Greater confidence in higher future output did not translate into faster job creation, as employment growth slowed despite a renewed rise in backlogs.
At the same time, subdued inflationary pressures continued to be reported midway through the first quarter, with slower growth of costs helping keep selling price inflation muted.
The seasonally adjusted IHS Markit final U.S. Manufacturing Purchasing Managers’ Index™ (PMI™) posted 50.7 in February, little-changed from the ‘flash’ figure of 50.8, and down from 51.9 seen at the start of the year. The improvement in the health of the manufacturing sector was the weakest since last August and only marginal overall.
A key contributing factor behind slower manufacturing growth was a weaker upturn in output. The marginal expansion was the softest since July 2019, and although some firms reported higher new order volumes, supply chain issues following the outbreak of coronavirus in China were reported to have affected production and constrained output in some cases.
The pace of expansion of new orders meanwhile eased to the slowest since orders began rising in June 2019 and was only fractional overall. Some companies linked softer demand growth to hesitancy among clients to place orders. Meanwhile, new business from abroad fell at a slightly faster pace.
Despite softer demand conditions, manufacturers registered a stronger level of optimism regarding future production in February as expectations were buoyed by greater marketing efforts and investment in new products and factories. Positive sentiment reached a ten-month high but remained below the long-run series average. Concerns included supply chain issues, weaker demand in the lead up to the presidential election and a general slowing of the economy.
Supply chain delays stemming from supplier factory shutdowns in China and the outbreak of coronavirus led to a further deterioration in vendor performance, which reportedly held back output and the processing of backlogs due to a shortage of components. As a result, firms registered a renewed rise in outstanding business and a drop in pre-production inventories.
Concurrently, the rate of input cost inflation slowed in February as successful negotiations with suppliers following weaker demand for inputs reportedly resulted in softer price rises. The modest increase in costs was the slowest for three months and well below the series trend.
At the same time, the pace of selling price inflation ticked up slightly as firms sought to partially pass on higher costs to clients. Nonetheless, the pace of increase was only marginal overall and among the slowest in the current sequence of inflation that began in October 2016.

Chris Williamson, Chief Business Economist at IHS Markit:
Manufacturing production and order book trends deteriorated markedly in February as producers struggled against the double headwinds of falling export sales and supply chain delays, both in turn often linked to the coronavirus outbreak.
Any growth in sales was once again largely driven by domestic consumers, though even here the rate of growth was weakened considerably compared to late last year
Historical comparisons against official data indicate that the survey is consistent with factory production and orders both falling at annualised rates of around 3%, with manufacturing jobs being lost at a monthly rate of roughly 20,000. (…) companies have become increasingly concerned that the COVID-19 outbreak will also hit demand, which is reportedly already cooling amid uncertainly leading up to the presidential election. (…)
NARRATIVES VS FACTS
So, investors now confidently feel that world central bankers have their backs. John Authers:
Could central banks really provide a catalyst? This isn’t a crisis that can be resolved with a change in monetary policy; the virus is impervious to cheaper money. But in the short term, the fall in risk assets has meant a sharp tightening in financial conditions, even though bond yields are lower. Bloomberg’s measure of financial conditions (where numbers are above zero show easy conditions, while negative numbers show tight financial conditions), demonstrates the extent and suddenness of the shock. Money hasn’t been this tight since the Chinese devaluation crisis of 2015:

Easier money should release the pressure (to use Jim Cramer’s famous phrase) on dealers holding illiquid debt, and also make life easier for heavily leveraged companies. It would reduce the risk of this financial shock turning directly into an economic shock unaided by the virus, by averting the risk of forced selling and forced bankruptcies. It would also allow central banks to show that they retained some power over the situation.
Authers then talks about Russell Napier’s book Anatomy of the Bear,
(…) an analysis of how the four greatest secular bear markets of the 20th century (as he diagnoses them) came to an end, and how it might have been possible to spot an historic buying opportunity in real time. It casts considerable light on how bear markets start and end, and that is useful for the present moment. (…)
One other fascinating finding from re-reading Napier’s book concerns the Spanish flu, by far the worst pandemic of the 20th century and the realistic worst-case scenario that now confronts us. It lasted roughly from January 1918 to December 1920, and the first great bear market bottom in the book happens in the summer of 1921. Yet Napier never mentions the flu, and it doesn’t appear in the copious news articles he cites from the months when the nadir had been reached.
The flu might well have contributed to the brief economic depression that began the 1920s, but that bear market can be explained without reference to it. Instead, Napier focuses on the difficulty investors had in assimilating the role of the Fed, then a brand-new institution, and understanding the impact of huge amounts of government debt issued to fund the war. Plainly there are close parallels with today’s confusion over the new active role that central banks have taken since the crisis, and the effect this has had on growth, profits and valuations.
For one example of how difficult it has become to understand the signals that markets are sending, the 30-year bond yield is now lower than the dividend yield on the S&P 500 — an extraordinary fact that should mean that equities are a screaming “buy.” The only previous time it happened was at the worst of the financial crisis in late 2008 and early 2009. Yet this time, it has happened within weeks of an all-time high. This creates the same kind of dissonance and confusion that a century ago was created by the arrival of the Fed, and the escalation of war-time borrowing. It is dangerous.
It is human nature for all of us to look at the advance of the virus and try to work out how serious its toll could be. For the long-term future of the market, we just need to know about its economic impact. We are only at the start of trying to work that out.
So many known unknowns and unknown unknowns. But we know this:
Q1’20 earnings estimates keep getting revised downward. They are now seen up 2.4%, from +2.7% last Friday, +3.9% on Feb. 10 and +6.3% on Jan. 1. Nobody really cares about Q2 for now. Still seen up 5.5% (+7.2% on Jan. 1).
Trailing EPS are now $164.60. The Rule of 20 P/E is back to 21.0.
The Rule of 20 Strategy raised cash from 20% to 30% at yesterday’s close (3090). The R20 P/E touched 19.6 on Friday, down from its Feb. 19 high of 22.9.

TECHNICALS WATCH
Lowry’s Research says that “while NY volume remained extremely heavy at over 6 billion shares, Up Volume only accounted for 78% of Up/Down Volume. Advancers took 82% of total Adv/Dec Issues so the resurgence of Demand fell a bit short in confirming that a bottom had been made. The market remains oversold with the % of Lowry’s Stocks above their 10-DMA at 5.47%.”
A Bond Giant Calls a Top in Treasury Prices
Bond-investing giant Western Asset Management Co. is calling a top on the red-hot market for U.S. Treasury bonds and buying into corporate debt instead. (…)
“The market is way ahead of the Fed now, and we could give back a lot of this rally very quickly,” Mr. Buchanan said. (…)


 The vast majority of infected people show only mild or no symptoms and people without symptoms can transmit the disease to others (which differs from past outbreaks of SARS/MERS, in which people didn’t typically become infectious until after they showed severe symptoms).
 In most [simulated] scenarios, highly effective contact tracing and case isolation is enough to control a new outbreak of COVID-19 within 3 months. (The Lancet)


