Virus Update
- Confirmed cases worldwide pass 83,000; deaths top 2,800
- Iran reports 143 more infections; Iran also reported eight more deaths, taking the total death toll to 34. “Iran expects an upward trajectory in confirmed coronavirus cases in the next few days,” the health minister said.
- South Korea adds 571.
- Limited virus testing in Japan masks true scale of infection. Japan’s northern island of Hokkaido has declared a state of emergency due to the outbreak of coronavirus there, national broadcaster NHK said. Residents have been asked to stay indoors over the weekend.
- China is making progress in the battle to get back to work
Cases in Italy soared to 650 on Thursday from 400 a day earlier, bringing the European total to more than 700. South Korea has raised its travel advisory for Italy’s Lombardy, Veneto, and Emilia-Romagna regions to level 2.
Germany quarantined about 1,000 people. Authorities in Heinsberg, near the Dutch border, asked people who came into contact with a married couple with the disease to stay at home.
Switzerland banned large events, leading to the Geneva car show being canceled. Nigeria, Africa’s most populous country, confirmed the first infection south of the Sahara desert. Algeria has also reported a case.
Netherlands reported its second confirmed infection. Five new cases were earlier confirmed in Sweden, bringing the total confirmed cases in the country to seven.
A patient admitted to Mexico’s INER hospital tested positive for coronavirus and a counter-test is now being made, El Universal reported, citing the Health Secretary. The patient is a 35-year-old man who recently traveled to northern Italy, five family members are also under observation.
New Zealand confirmed its first case after a person who recently returned from Iran was diagnosed with the illness, the Ministry of Health said Friday. The person in their 60s is in isolation in Auckland hospital, the ministry said in an emailed statement.
Separately, Lithuania reported its first case. The person was infected in the Italian city of Verona, RIA Novosti said.
Fast Retailing Co., the owner of the Uniqlo clothing brand, reopened more than 100 stores in China in the past week, Reuters reported, citing a statement. Almost all partner factories restarted work, while 125 stores in China are still closed because of the virus.
The Food and Drug Administration confirmed the first drug shortage relating to the coronavirus, Commissioner Stephen Hahn said in a statement. The announcement didn’t name the manufacturer but said “there are other alternatives that can be used by patients.” The shortage is due to an active ingredient used to make the drug, the FDA said.
FYI: the Johns Hopkins University Center for Systems Science Engineering maintains a nice and up-to-date dashboard. The FT has this chart today:

This chart suggests that the growth of new coronavirus cases, ex-Mainland China, might be peaking. From Pantheon Macro via Isabelnet

Some personal observations FYI:
- This all started in one area in China with the usual Chinese news repression and mismanagement. It then spread outside Wuhan and the Hubei region before authorities started adequate containment measures.
- But it was too late to prevent the virus from travelling.
- The Diamond Princess got infected and an unprepared staff also totally mismanaged the situation.
- The world got to know the meaning of “quarantine” and its potential economic and financial impact.
- Then came Italy and a spreading of cases throughout the world as people, travelling from Iran and Italy and other places, carried the virus worldwide.
- Yaddi, yaddi, yadda, recession(s) became possible (probable somewhere), further aggravated by a correction in very overvalued equity markets, in complacent mode, increasingly influenced by small investors joining in this apparent one-way market.
- Machine trading and the ETF phenomenon kicked in and we got a 13.5% correction in 9 days. In the end, we will have broken all previous economic and financial records when this cycle is over.
The coronavirus vs influenza:

Uncertainty and the impacts of quarantines makes it scary as we are in totally uncharted territory. Yet, the reasonable odds are that this epidemic will be contained and that the world will return to normal during Q2.
What we don’t know:
- the short-term economic impact and the shape of the recovery
- Recession(s) somewhere?
- the hit on profits in Q1
- how it will affect supply chains and operating costs longer term
- black swans out there, given all the debt accumulation
What we know:
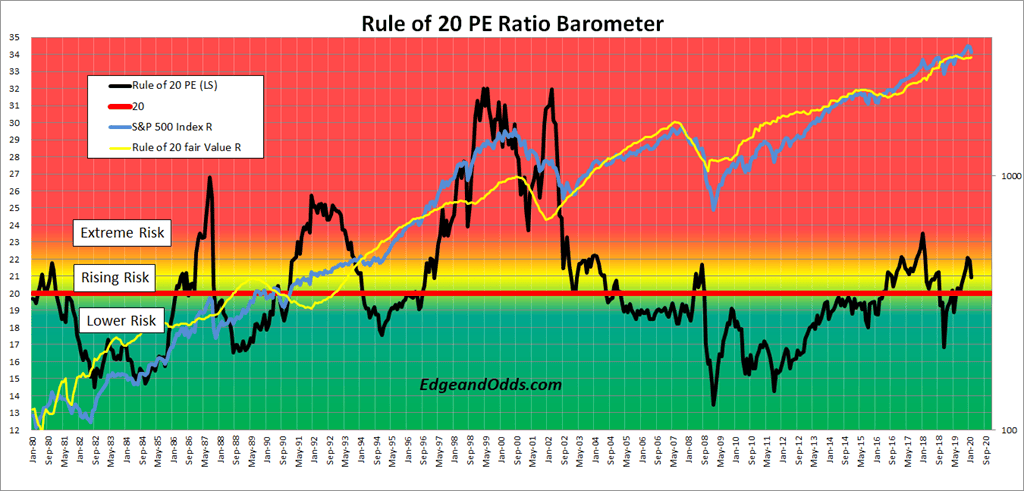
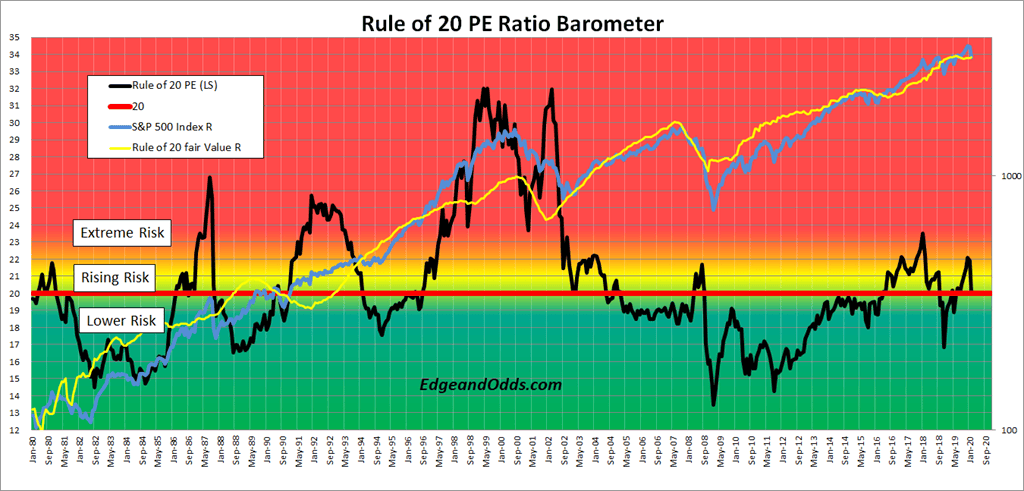
- We have had the correction we deserved and equities have re-priced at “fair value” per the Rule of 20.
- Interest rates have come down world wide
- commodity costs have dropped
- central banks and governments world wide will be leaning towards stimulation
- sentiment has changed and cost control will get back to center stage
So:
- Tempting to bottom fish. Possible home runs in some battered sectors (e.g. travel).
- Recessions? Could profits tumble 20% making current valuation readings still too high?
- Is panic/machine selling over? March/April stats will be pretty bad…
Remember
- the December 2018 low was at 16.85 on the Rule of 20 P/E (now 20.0) and 14.6 on the regular P/E on trailing EPS (now 17.7). So this market is not cheap, just fairly valued on trailing data
- trailing earnings could start declining again in Q1 or Q2
- a recession would hit hard given widespread indebtedness
- An adviser to Prime Minister Shinzo Abe said Japan should compile another economic package with fresh spending of at least 5 trillion yen ($45 billion) to respond to a severe hit from the coronavirus outbreak. “We should take it very seriously that this is terrible timing, coming right after the sales tax hike,” Etsuro Honda, one of the key architects of Abenomics, said in an interview. “The impact could be devastating in the short term.” (BB)
Personal Income and Outlays, January 2020
Real income growth remains fairly solid at +3.3% a.r. in the last 2 and 3 months but real spending was a slow +1.6% a.r.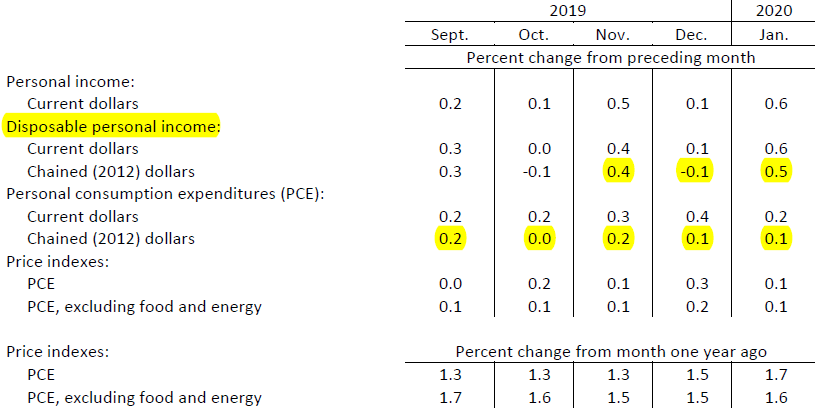
OPEC leaning towards larger oil cuts as virus hits prices, demand: sources
Saudi Arabia, the biggest producer in OPEC, and some other members are considering agreeing an output cut of 1 million barrels per day (bpd) for the second quarter of 2020, more than an initially proposed cut of 600,000 bpd, the sources said. (…) They are scheduled to meet on March 5-6 in Vienna to decide further policy. (…)
Saudi Arabia is already making unilateral curbs of more 500,000 bpd in crude supplies to China for March, two sources with knowledge of the matter said. (…) A source in a Russian oil company said it made sense to deepen the cuts.
U.S. Pending Home Sales Rebound Amidst Lower Interest Rates
The National Association of Realtors (NAR) reported that pending home sales gained 5.2% in January (5.7% year-on-year), more than reversing December’s 4.3% drop. Pending sales are up 9.6% since the four-and-a-half year low reached at the end of 2018, when mortgage rates hit 4.71%.
The number of signed contracts in December increased in every region of the country except the West, where they declined 1.1% (+5.5% y/y). Pending sales jumped 8.7% and 7.3% in the South and Midwest (7.1% and 6.5% y/y respectively). Activity was up 1.3% in the Northeast (1.2% y/y).

HERE AND THERE
JPMorgan Chase & Co. issued global restrictions on non-essential travel to protect its employees and its business against the spreading coronavirus.
British Airways parent IAG SA slumped after saying it couldn’t provide an earnings forecast this year, as weak demand in Asia rippled across to Europe and companies cut back on business travel. EasyJet Plc said that it had seen a softening in demand and made plans to cancel flights.
Finnair dropped after it revised outlook, citing the coronavirus and its wider than originally estimated impact. Alitalia plans to extend temporary layoffs for about 4,000 workers following the outbreak in Italy, Ansa reported. Amadeus IT Group SA, which operates software for flight bookings, fell 5% after saying that airline travel sales are slowing globally.
Cisco Plans New Round of Layoffs The networking-equipment maker faces the prospect of slowing sales growth because of global economic uncertainty.
(…) The San Jose, Calif.-based company said this month it expects revenue to drop between 1.5% and 3.5% in its current quarter. The decline would come on top of a 3.5% year-over-year drop in revenue for the company’s fiscal second quarter, which ended Jan. 25. (…)
The chemical industry became the latest sector to be hit by the coronavirus after German giant BASF SE warned the outbreak could help lead to the lowest growth in production since the financial crisis more than a decade ago.
Hyundai Motor Co. halted operations at its No. 2 plant in Ulsan for disinfection after a worker tested positive, Maeil Business Newspaper reported, without citing anyone.
TECHNICALS WATCH
Lowry’s Research says its “short-term indicators such as the % of NYSE Issues above 10-DMA and Stochastics, are now deep in oversold territory. The longer-term % NYSE Issues above 30-DMA is also at a level last seen at the Dec. 2018 low. In order to know that a bottom has been formed, the market needs to demonstrate the return of Demand (…). It is the two-step process of Supply exhaustion and Demand resurgence that creates a quality market bottom.”
 The prestigious Wharton business school’s new dean will be first woman and person of color in its nearly 140-year history
(…) She has a Ph.D. and master’s degree in organizational psychology from the University of Michigan, in Detroit and received a bachelor’s degree in psychology from Pomona College of the Claremont Colleges, in California. (…)
From the WSJ:
(…) Applications to U.S. M.B.A. programs have fallen for five straight years as young professionals have questioned the wisdom of taking two years out of a hot job market to go back to graduate school. Applications to Wharton’s two-year M.B.A. program were down about 5% in 2019.