The enemy of knowledge is not ignorance, it’s the illusion of knowledge (Stephen Hawking)

It ain’t what you don’t know that gets you into trouble. It’s what you know for sure that just ain’t so (Mark Twain)

Invest with smart knowledge and objective odds

THE DAILY EDGE: 14 JANUARY 2020

The Conference Board Employment Trends Indexâ„¢ (ETI) Declined in December

The Conference Board Employment Trends Indexâ„¢ (ETI) declined in December, following an increase in November. The index now stands at 109.68, down from 110.51 (an upward revision) in November. The decrease marks a 1.2 percent decline in the ETI over the past 12 months.

“The Employment Trends Index decreased in December and continues to be on a flat trend since the summer of 2018. In the current state of the labor market, a flat index is consistent with an ongoing labor market expansion. We expect job growth to remain solid and the labor market to continue tightening,” said Gad Levanon, Head of The Conference Board Labor Markets Institute. “In Friday’s job report, the broadest measure of labor market slack, known as the U6 rate, fell to 6.7 percent, the lowest level on record. Such a tight labor market is a growing obstacle for further economic growth, but not a big enough obstacle to derail the US economy from its two percent growth trajectory.” (…)

image

image

Ned Davis Research says that economic contraction signals are generated when the index falls by 4.8% from a high point. The high point this cycle is 111.13 (August 2018), meaning a recession signal would occur at 105.8 on the ETI.

China posts strong December exports as world awaits Sino-U.S. trade deal signing 

China’s exports rose for the first time in five months in December and by more than expected, signaling a modest recovery in demand as Beijing and Washington agreed to defuse their prolonged trade war.

After a rough year, China’s exports ended 2019 on an upbeat note, rising 7.6% in December from a year earlier, customs data showed on Tuesday. The median forecast from a Reuters poll of analysts had been for a 3.2% rise in shipments, following November’s 1.3% drop.

Imports also beat expectations, jumping 16.3% from a year earlier, though boosted in part by higher commodity prices. The Reuters poll had forecast 9.6% growth versus 0.5% in November. (…)

For all of 2019, its total exports proved remarkably resilient to trade tensions, rising 0.5%, though that was well off a near 10% gain in 2018, reflecting weaker U.S. sales.

Imports fell 2.8% last year as China’s economic growth cooled to near 30-year lows, after rising 15.8% in 2018. (…)

China exports to the United States fell 12.5% in 2019, compared with a rise of 11.3% in 2018. Imports from the United States fell 20.9%, versus a 0.7% rise in the previous year. (…)

U.S. Removes China’s Currency Manipulator Label Ahead of Deal The U.S. ended its designation of China as a currency manipulator just two days before negotiators from Beijing and Washington are set to sign the first phase of the trade deal between the two countries.

(…) “China has made enforceable commitments to refrain from competitive devaluation, while promoting transparency and accountability,” Treasury Secretary Steven Mnuchin said in a statement Monday. (…)

As part of the agreement, China will commit not to depress its exchange rate and will make additional disclosures about its foreign-exchange practices. The Treasury also noted that the Chinese currency had strengthened in recent months, a development that helps address U.S. concerns that the yuan is too weak.

The currency component has been a focus of Mr. Mnuchin in talks with China, and the administration has said it was one of the trade deal’s most significant parts. (…)

The Treasury Department refrained from branding China a manipulator until August, the first time it did so since 1994. (…)

IMF research, however, didn’t support the conclusion that China had manipulated its currency. (…)

In case you wonder, the yuan was 6.895 to the USD on Aug. 2, the last trading day before the “currency manipulator” designation was made on Aug. 5.
It closed at 6.893 yuan per dollar on Monday when the label was removed.

How the U.S. and China Settled on a Trade Deal Neither Wanted

The WSJ gives us the back story of the deal to be announced tomorrow. Some excerpts:

Looking for a direct route to the president, Chinese Ambassador Cui Tiankai spoke with President Trump’s son-in-law and adviser, Jared Kushner, say people familiar with the episode. The U.S. offer didn’t roll back enough tariffs, he told Mr. Kushner.

It was time to settle, Mr. Kushner responded. If not, on Dec. 15 the president was ready to proceed with new tariffs on about $156 billion in Chinese imports, including smartphones and toys. “Don’t think in terms of tariff reduction,” he advised. “Think in terms of what will happen if you don’t make a deal.”

To Chinese negotiators dealing with a president they considered erratic, Mr. Kushner’s words at least offered certainty, say the people familiar with episode. They also recognized an opportunity: The agreement wouldn’t force them to make economic-policy changes Washington had long insisted on.

(…) the deal isn’t what either side said it had wanted. The U.S. doesn’t get the fundamental reforms in Chinese economic policy it sought to help American businesses. And levies remain on about $370 billion of China’s exports. (…)

[In August], Sheldon Adelson, the Las Vegas Sands Corp. CEO who contributed $20 million to Mr. Trump’s presidential campaign and whose Macau casinos depend on Chinese goodwill, warned the president new tariffs would hurt the economy and Mr. Trump’s re-election chances by increasing consumer prices.

Mr. Trump had long claimed China was paying the cost of tariffs. Executives from Best Buy Co. were among those pointing out the burden falls on U.S. businesses and customers. (…)

Mr. Trump had long instructed his chief negotiator, U.S. Trade Representative Robert Lighthizer, to get a “great deal.” Now, Mr. Lighthizer was after the best deal available. (…)

Negotiators on both sides started exploring a settlement with different phases, the first focused on agriculture purchases and other less contentious issues. That had long been China’s strategy. Since 2018, Chinese negotiators had pushed what they called a 40-40-20 plan: They said 40% of American demands were doable because they involved reforms China planned anyway, 40% were negotiable and 20% were off-limits, impinging on national security.

Mr. Lighthizer and other negotiators had earlier privately derided the effort because Beijing categorized as off-limits issues the U.S. considered priorities. That included further opening China’s cloud-computing market. Now the U.S. essentially was ready to accept China’s framework. (…)

After listening to Mr. Kushner’s counsel, the Chinese side was ready to settle if Mr. Lighthizer approved one more compromise—reduce the 15% tariffs to 7.5% instead of 10%. Both sides could live with that and worked to clear remaining issues. (…)

The U.S. is counting on remaining tariffs to compel Beijing to continue negotiating and agree to economic-policy changes. Failing that, Washington could use other pressure points, such as limiting the ability of Chinese firms to list shares in U.S. markets.

Still, Chinese officials feel they have little to gain from a phase-two deal forcing Beijing to ease state control of the economy, and Mr. Trump recently said that a phase-two agreement probably wouldn’t conclude until after the Nov. 3 election. The Chinese government continues to plan for a future where the two economies would be less intertwined and China would develop technology rather than rely on American imports. (…)

China to ramp up U.S. car, aircraft, energy purchases in trade deal: source China has pledged to buy almost $80 billion of additional manufactured goods from the United States over the next two years as part of a trade war truce, according to a source, likely giving a much-needed boost for planemaker Boeing.

Under the terms of the trade deal to be signed on Wednesday in Washington, China would also buy over $50 billion more in energy supplies, and boost purchases of U.S. services by about $35 billion over the same two-year period, the source told Reuters on Monday.

The Phase 1 agreement calls for Chinese purchases of U.S. agricultural goods to increase by some $32 billion over two years, or roughly $16 billion a year, said the source, who was briefed on the deal.

When combined with the $24 billion U.S. agricultural export baseline in 2017, the total gets close to the $40 billion annual goal touted by U.S. President Donald Trump. (…)

BlackRock Puts Climate at Center of $7 Trillion Strategy

BlackRock Inc. will ditch investments with high sustainability-related risk as climate concerns drive a sweeping change in the way the world’s largest asset manager invests its $7 trillion in assets.

“Climate change has become a defining factor in companies’ long-term prospects,” Chief Executive Officer Larry Fink wrote in his annual letter to corporate executives on Tuesday. “Awareness is rapidly changing, and I believe we are on the edge of a fundamental reshaping of finance.” (…)

Fink outlined a number of initiatives, including: making sustainability integral to portfolio construction and risk management; exiting investments that present a high sustainability-related risk, such as thermal coal producers; launching new investment products that screen fossil fuels; and strengthening the firm’s commitment to sustainability and transparency in its investment stewardship activities. (…)

The company also listed environment and climate risk among its top priorities for meetings and discussions with the public companies it owns, according to its 2019 investment stewardship report. (…)

Bank of Canada says business outlook ‘broadly positive’, labour market tightening

The central bank said its closely watched Business Outlook Survey suggested that the small amount of slack that had remained in the economy in the third quarter “has been absorbed,” as companies reported rising pressures in production capacity and labour shortages in much of the country, with the exception of the Prairies.

For the first time, the bank also published its Canadian Survey of Consumer Expectations, which showed that consumers remain buoyant about spending plans over the next year, despite a mixed outlook for employment and modest wage growth expectations. The survey showed that consumers generally expect house prices to accelerate, although overall inflation expectations eased slightly from the third quarter. (…)

SENTIMENT WATCH

SentimenTrader:

Primarily because of a large, sudden uptick in these speculative bullish strategies, and a continued lack of interest in anything that smacks of protecting the downside, the Options Speculation Index jumped again, this time to a 19-year extreme.

imageBecause the bubble years distort the scale, if we only look at data since the end of the financial crisis, we can see just how much speculation has jumped in the past few weeks, and how extreme it is relative to any other week during this tremendous bull run.

Fewer in U.S. Continue to See Vaccines as Important

Widespread public support for childhood vaccines creates a wall preventing contagious diseases like measles and polio from spreading in the U.S., but a breach in that wall appeared in 2015 and it has not been repaired. A recent Gallup survey finds 84% of Americans saying it is extremely or very important that parents vaccinate their children. That matches Gallup’s prior reading in 2015 but is down from 94% in 2001.

image

THE DAILY EDGE: 13 JANUARY 2020: The Taal Equity Markets (3)

Jobs Report Offers Little Reason for Fed to Change Its View Steady payroll gains but few signs of accelerating wages could keep central bank rate policy on hold

(…) At the margins, the December report suggests the labor market cooled at the end of last year, though economists have expected this for some time as employment rates rise and the pool of available workers declines.

While payroll growth in December was strong enough to hold the unemployment rate at a 50-year low, wage growth decelerated. Average hourly earnings of private-sector workers rose 2.9%, down from a recent high of 3.4% in February 2019. Measures of aggregate hours worked for private-sector employees also showed slower rates of growth. (…)

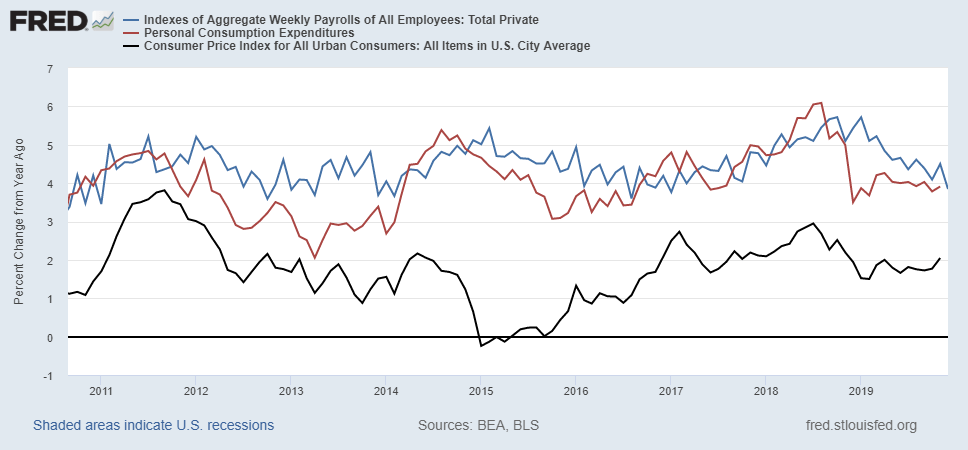
We should all be focused on the U.S. consumer and its ability to sustain a decent level of growth in spending. The payrolls index (employment x hours x hourly wages) has decelerated to +3.8% YoY in December with total CPI in the 2.0% range.

fredgraph (37)

Employment growth has decelerated to +1.4% in December (2019 average = +1.6%) while hourly earnings are now rising 2.8% compared with a +3.2% 2019 average.

fredgraph (39)

All the components of the payrolls index are decelerating, even weekly hours back at their 5 year low point of 34.3 hours. The curious trend, however, is in hourly earnings. On a YoY basis, hourly earnings are up 2.9%, down from 3.4% last February. For all of Q4, wages are up at a 2.8% annualized rate but December was up only 1.2% a.r..

Maybe only statistical noise but what kind of noise is this 4-month slide in Production workers’ wage growth rate from +3.6% annualized in September, to +3.0% in October, +2.0% in November and +1.0% in December. This group represents 80% of the labor force. This wage puzzle keeps getting puzzling…

fredgraph (38)

Bloomberg’s John Authers today discusses this trend and its potential ramifications:

(…) The following chart, produced by Steven Blitz, chief U.S. economist of TS Lombard, compares the aggregate index of weekly payrolls (the product of average earnings, hours worked and employment) with discretionary demand. At the margin, it looks as though the current apparently booming employment market could in fact bring deflationary forces with it, and presage reduced revenues for companies. (…)

relates to These Great Jobless Numbers Are Just Miserable
China’s U.S. trade deal commitments not changed in translation: Mnuchin China’s commitments in the Phase 1 trade deal with the United States were not changed during a lengthy translation process and will be released this week as the document is signed in Washington, U.S. Treasury Secretary Steven Mnuchin said on Sunday.

Mnuchin told Fox News Channel that the deal reached on Dec. 13 still calls for China to buy $40 billion to $50 billion worth of U.S. agricultural products annually and a total of $200 billion of U.S. goods over two years. (…)

This is a very, very extensive agreement,” he added. (…)

Asked if he still expected China to purchase $40 billion to $50 billion in U.S. farm products under the deal, Mnuchin said: “I do. Let me just say, it is $200 billion of additional products across the board over the next two years, and, specifically in agriculture, $40 billion to $50 billion.” (…)

NYC Housing

From the NYT:

(…) Nearly half of new condo units in Manhattan that came to market after 2015, or 3,695 of 7,727 apartments, remain unsold, according to a December analysis of both closed sales and contracts by Nancy Packes Data Services, a real estate consultancy and database provider. The report looked at buildings with about 30 or more units. (…)

In 2011, the average sale price of a new condo was $1.15 million, just a 9 percent premium over resales. By 2019, the average price of a new condo was $3.77 million, a 118 percent premium over resales, Ms. Packes said.

That disconnect has led to a glut of unsold luxury condos. Including shadow inventory — the units held off the market until conditions improve — there were 7,050 new condo units available for sale in Manhattan in January, according to a Halstead Development Marketing report. That is the equivalent of more than six years of inventory at the current pace of sales, when a balanced market typically sells out in two to three years. (…)

EARNINGS WATCH

From Refinitiv/IBES:

Through Jan. 10, 19 companies in the S&P 500 Index have reported earnings for Q4 2019. Of these companies,
84.2% reported earnings above analyst expectations and 15.8% reported earnings below analyst expectations. In a typical quarter (since 1994), 65% of companies beat estimates and 20% miss estimates. Over the past four quarters, 74% of companies beat the estimates and 19% missed estimates.

In aggregate, companies are reporting earnings that are 4.2% above estimates, which compares to a long-term (since 1994) average surprise factor of 3.3% and the average surprise factor over the prior four quarters of 4.9%.

Of these companies, 68.4% reported revenue above analyst expectations and 31.6% reported revenue below analyst expectations. In a typical quarter (since 2002), 60% of companies beat estimates and 40% miss estimates. Over the past four quarters, 58% of companies beat the estimates and 42% missed estimates.

In aggregate, companies are reporting revenue that are 0.4% above estimates, which compares to a long-term (since 2002) average surprise factor of 1.5% and the average surprise factor over the prior four quarters of 1.0%.

The estimated earnings growth rate for the S&P 500 for 19Q4 is -0.6%. If the energy sector is excluded, the growth rate improves to 1.9%.

The estimated revenue growth rate for the S&P 500 for 19Q4 is 4.2%. If the energy sector is excluded, the growth rate improves to 5.4%.

What the Refinitiv account does not say is that these 19 early reporters (November year-ends) incurred a 17.2% earnings decline in Q4 on a 2.4% revenue growth rate. One year ago, the first 20 reporting companies had a 19.6% earnings jump on a 10.9% revenue growth rate. The sample comprises 12 consumer-centric companies, 5 IT and 2 Industrials.

These companies’ woes actually began in Q1’19 when earnings fell 4.6% YoY, followed by –11.2% in Q2, -17.5%  in Q3’19 and now –17.2% in Q4. During that year, revenue growth slowed from +5.5% in Q1, to +2.8% in Q2, to +1.0% in Q3 and +2.4% in Q4.

The Q4’19 earnings season gets in second gear this week.

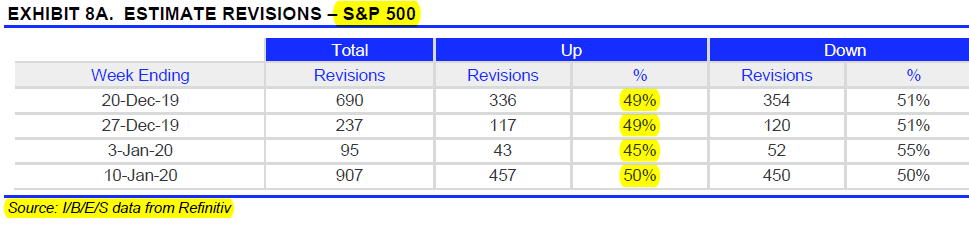
Analysts have been busier revising their estimates last week with upgrades still equal to downgrades.

image

image

Fingers crossed Analysts are expecting a 6.1% rebound in Q1’20 earnings, down from +8.9% on October 1. From there, growth accelerates to +7.2% in Q2, +10.1% in Q3 and +14.4% in Q4 for an estimated gain of 9.6% for the year, down from +11.2% on Oct. 1.

Consumer-centric companies are seen rebounding from a rather dismal Q4’19 period, much like IT companies.

image

How will revenue growth accelerate from 2.2% to 8.3% (CD companies) or from 3.5% to 7.5% (IT) is not revealed, sadly enough.image

As this Fidelity chart illustrates, actual annual earnings generally finish 8.2% lower, on average, than the initial estimate (excluding 2018-tax cut) with a range of –5.1% to –14.0% since 2011. Hence the current $177 estimate for 2020 is more likely to end up between $152 and $168.

S&P 500 Earnings Estimates

THE TAAL EQUITY MARKETS (3)

In December 2017, I posted THE TAAL EQUITY MARKETS, comparing the eerie calmness of this mountain in the Philippines as we climbed to the top of the crater to the then calmness in U.S. equity markets, confidently sporting Image result for taal eruption imagesa 15-year high 22.4 on the Rule of 20 scale and 20.6 on the conventional P/E scale.

What to worry? The economy was strong enough to get the Fed prudently, preemptively press on the brakes while tax reform would boost profits and investments, eventually taking care of whatever excess leverage there might be out there. The market, obviously overvalued, seemed to be in a good place looking forward.

“Under most calculations and scenarios, equities seem fully valued currently with a 15-20% downside.

As legendary mountaineer Ed Viesturs wisely said, “getting to the top is optional, getting down is mandatory.” He also said:

What some people call “summit fever,” he calls “groupthink,” which is when a majority of the group, desperate to reach the top, disregards dangerous weather, route conditions, or other important factors. The least experienced climber tags along thinking if everyone else is going, then it should be just fine. It’s almost a lemming-type effect. People get swept up in it, it’s that psychological feeling of safety. No one gives any thought to the acceptable level of risk.’

When I am climbing, I listen to the mountain. All the information is there, which helps me decide what to do. Arrogance and hubris need to be put aside, and humility and thoughtfulness are essential. I truly believe that is how I survived so many expeditions into a dangerous arena.”

In a February 6, 2018 sequel, I wrote after the S&P 500 had climbed down 9.7% between its Jan. 26 high to 2587 on Feb. 6 (then to 2529 on Feb. 8 to qualify as a bona fide correction of –11.8%):

Valuations are notorious poor timing tools, but they sure are good at warning of impending danger.

That calm volcano we serenely climbed with our son and his Filipino family in late 2017 violently erupted without notice on Sunday, forcing David and his family to hurriedly leave their toxic countryside and drive 3 hours on an ash covered road, amid several scary earth tremors, to Manilla.

Image result for taal eruption images

Investors keep serenely climbing this equity volcano as Morgan Stanley and BCA Research show (via Isabelnet):

U.S. Equity Indices Futures

MSCI World vs. Global Composite PMI
  • “This is a market looking through fundamental data, looking through corporate guidance and data points, looking through Fed guidance itself,” Lisa Shalett, the chief investment officer at Morgan Stanley Wealth Management, told Bloomberg Television. “It is a market that wants to go up in the short term. That is what makes it so profoundly dangerous.” (Bloomberg)
  • Short sales in the SPDR S&P 500 ETF Trust, known by its ticker SPY, as a percentage of shares outstanding fell to 1.1% Tuesday, according to data from IHS Markit Ltd. That’s the lowest level since January 2018, before the event known as “Volmageddon” sent stocks swooning. (Bloomberg)

Short interest on SPY falls to the lowest in two years
TECHNICALS WATCH

Lowry’s Research says that its primary measure of Demand, the Buying Power Index, “has set new rally highs in an uptrend dating from mid-Aug. 2019. At the same time, our primary measure of Supply, the Selling Pressure Index, remains in a well-established downtrend and close to its lowest level since early April 2019. A sustained pattern of expanding Demand and contracting Supply historically represents the strongest phase of a bull market and provides a much more reliable indication of higher prices ahead than any Wall St. statistical oddity.”

But, “On a strictly short-term basis, there is some evidence that Demand is growing more selective.” The recent gains in Lowry’s Adv-Dec Lines have been dependent primarily on Large Cap stocks and “a significant percentage of Lowry stocks are in short-term downtrends.” Lowry’s also notes that “stocks recording new highs are concentrated in a handful of Sectors, primarily the Info Tech and Communication Services Sectors” warnings that a “narrowing focus to the strongest stocks in a handful of Sectors provides another example of the selective Demand that can leave the market vulnerable to a short-term pullback.”

The S&P 500 has, in effect, decoupled from its equal-weight clone…

rsp

…and even more so from the S&P 600 Index:

sly
The S&P 500 is now more overvalued than ever, per this measure

(…) The above chart, from Ned Davis Research, shows that price relative to sales for the S&P 500 is at a record high, “well in excess of what they were in 2000 or 2007 at those peaks,” wrote Ned Davis in a Wednesday note to clients. (…)

If I showed you 2 companies, one with 5% net margins and the other one with 10% net margins, would you be willing to pay more per dollar of the more profitable sales?

image

This CPMS/Morningstar chart illustrates the link between P/S and Net Margins. It is true that P/S is at a historical high but so are net margins…unlike the late 1990s. And while a decline in margins would likely take P/S down, note the long-term uptrend in margins. The “mean reversion” most people have been forecasting has not happened, just yet anyway.

Like it or not, sustainable or not, desirable or not, the fact is that corporate America’s larger companies have become more profitable over time. Remember the 2018 corporate tax cut?

Another measure also popular within the bear circle is Price to Book, also reaching new highs recently, other than during the dot.com bubble. But look at ROE, the rate of return on said book equity:

image

The WSJ MarketWatch keeps quoting Ned Davis:

“But the S&P 500 could be overstating earnings due to buybacks and other financial engineering of profits,” Davis wrote, because corporate buybacks reduce shares in circulation, increasing earnings-per-share even if overall profits haven’t risen. Therefore, looking at the ratio of market valuations to overall profits suggests “P/E ratios are some 80% above the long-term norm,” Davis wrote.

The problem with buyback bashing is that, in reality, stocks trade on an earnings per share basis and that share buybacks do impact the per share calculation, like it or not. As it happens, S&P 500 companies’ price per share generally fluctuates roughly in line with earnings per share and this cycle is no exception (log scales don’t change the picture).image

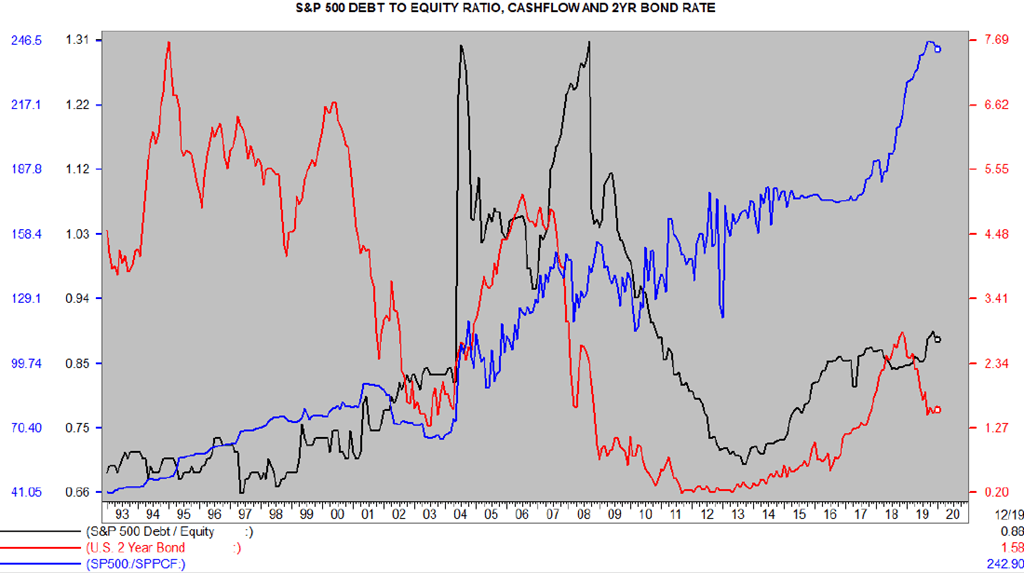
What must be watched with buybacks is whether corporate debt gets boosted beyond prudent levels as a result, which could negatively impact valuations and subsequent earnings cycles. While the S&P 500 D/E ratio has increased, it is below 1:1 and well below previous record highs. This when interest rates are historically low and corporate cashflow (blue line) is up nearly 40% in the last 2 years. Remember the 2018 corporate tax cut?

image

Trailing P/E ratios are currently 20.1, at the every high end of their historical 10-20 “normal” range but not “80% above the long-term norm”. If we exclude the 1974-1985 period, the “norm” was more like 12-22.

image

The Rule of 20 P/E, which incorporates inflation in the earnings valuation equation, displays a more stable range between 16 and 24. At its current 22.3 level, it says that the upside from valuation is 7.6% (to 24.0) while the downside from valuation is 28.3% (to 16.0). Remember that it went from 21.2 in September 2018 to 16.9 on December 24, 2018.

image

Also consider that the Rule of 20 Fair Value is now 2885 [(20 – inflation (2.3%) x $163.09)] and has been falling since June 2019 (2952). The correlation between the R20FV and the Index is 98% since 1957, 92% since 1997 and 96% since 2007). Higher earnings and/or lower inflation are needed soon. Higher earnings would be much more preferable than lower inflation which would make generating higher earnings more challenging.