The enemy of knowledge is not ignorance, it’s the illusion of knowledge (Stephen Hawking)

It ain’t what you don’t know that gets you into trouble. It’s what you know for sure that just ain’t so (Mark Twain)

Invest with smart knowledge and objective odds

THE DAILY EDGE: 4 NOVEMBER 2019

Crying face Sunday morning, my laptop suddenly died on me. I will be working on a less effective backup and limited resources for about 2 weeks. Turtle Snail 

U.S., China Signal Progress Toward Initial Trump-Xi Trade Deal

(…) “We’re relatively close to an agreement,” O’Brien told reporters in Bangkok on Monday, adding that Trump invited Xi to the U.S. if the two sides are ready to sign the phase one agreement. “I’m cautiously optimistic about it.”

In an interview with Bloomberg on Sunday, Ross expressed optimism the U.S. would conclude an initial agreement with China this month before working on additional phases. He also said licenses would be coming “very shortly” for U.S. firms to sell components to China’s Huawei Technologies Co.(…)

Job Gains Help Extend U.S. Economic Growth The U.S. economy has cooled but continues to expand with employers hiring, consumers spending and growth stabilizing.

Employment grew by a seasonally adjusted 128,000 jobs in October, the Labor Department reported Friday, a solid performance considering a strike at General Motors plants and a decline in the federal workforce temporarily reduced payrolls by more than 50,000.

The unemployment rate ticked up from a 50-year low to 3.6% in October as hundreds of thousands of Americans joined the labor force. Wage growth remained steady, up 3% from a year earlier.

Friday’s figures also showed job growth was stronger in August and September than previously reported. (…)

Employers added an average 167,000 jobs to payrolls each month this year. That is a slowdown from the 223,000 jobs added each month, on average, last year, and on pace to be the worst year for job creation since 2010.

But job growth remains strong in areas of the economy that serve U.S. consumers and are generally shielded from global trends and trade disputes. Health care and social services added 34,200 jobs in October, business services added 22,000, and hospitality, including restaurants, added 61,000. (…)

Employment in auto manufacturing fell by 41,600 “reflecting strike activity,” according to the Labor Department. The 40-day GM strike ended last week, but the government didn’t count those workers on payrolls in October because they were on picket lines the week of the employer survey. The federal government shed 17,000 jobs because many temporary workers completed their jobs for the 2020 census. The Census is planning to add a half-million temporary jobs next year. (…)

David Rosenberg (@EconguyRosie) seemed frustrated by the NFP:

Wow! What a jobs report!! Fully 80% of the HH gain was in part-time work because of lousy biz conditions. And 100% of the NFP jump were teachers, nurses, state-local civil servants, burger flippers, bell boys, bus captains and folks who work in waste management

Total employment growth keeps slowing, now at +1.4% YoY. Main bread-winners: +0.5%.

fredgraph (1)

Aggregate payrolls growth hanging in at +4.5%:

fredgraph (2)

Average hourly earnings: +3.5%:

fredgraph

Are We in a Recession? Experts Agree: Ask Claudia Sahm Sahm rule is reassuring to economists looking for new ideas on stimulus when interest rates are already low

(…) For now, the so-called Sahm rule is sending a reassuring signal: The economy may be slowing but no recession has begun. (…) If the average of unemployment rate over three months rises a half-percentage point or more above its low over the previous year, the economy is in a recession. Her formula would have accurately called every recession since 1970 within two to four months of when it started, with no false positives, which could trigger unnecessary and costly fiscal stimulus. (…)

Eurozone PMI little-changed at seven-year low in October

The euro area manufacturing sector continued to contract during October, according to the latest PMI® data from IHS Markit. After accounting for usual seasonal influences, the IHS Markit Eurozone Manufacturing PMI recorded 45.9 in October. Although up from September’s 45.7 and the earlier flash reading, the index remained well below the 50.0 no-change mark to indicate a rate of contraction that was the second-sharpest in the past seven years. All three market groups covered by the survey once again recorded a deterioration in operating conditions on the previous month. Investment goods and intermediate goods producers both registered marked contractions, compared to consumer goods where the rate of deterioration remained marginal.

Germany remained the principal source of manufacturing weakness in the region, despite experiencing a slight improvement in its respective PMI. Austria also registered another month of sharply deteriorating operating conditions, whilst Spain saw its manufacturing PMI fall to a six-and-a-half year low. Italy also recorded a sub-50.0 PMI reading, whilst the Netherlands, Ireland and France barely expanded. (…) Sharply falling volumes of incoming new orders remained a key depressor of overall operating conditions during October. Whilst not as severe as September’s near seven-year record, the drop in new orders remained notable and extended the current period of contraction to over a year.

Demand weakness was apparent across domestic and international markets. Export orders* fell during October to a considerable degree, again led by sharp reductions in Austria and Germany. Against the backdrop of deteriorating order books, euro area manufacturers made further cuts to both their output and purchasing activity in October. Whilst rates of decline eased since September, they nonetheless remained historically marked. Firms also made notable inroads into their backlogs of work to extend the current period of contraction to 14 months.

With evidence of continued spare capacity in the sector, job cuts were registered for a sixth month in a row. Moreover, the degree of job shedding was the sharpest recorded by the survey since the start of 2013. Employment fell to the greatest degree in Germany, where the rate of job shedding was the sharpest in nearly a decade.

There was a renewed effort amongst manufacturers in October to reduce their stock holdings. Input inventories were lowered to the greatest degree since March 2013, whilst finished goods inventories deteriorated to the greatest degree for over three years.

On the price front, average input costs fell the most since March 2016 during October. Commodities such as copper and steel, plus plastics, were amongst the inputs reported to be down in price. Manufacturers responded by making downward adjustments to their own charges for a fourth month in a row.

Finally, economic and political uncertainties (such as Brexit and US trade policy) continued to weigh on sentiment during October. Although expectations were at their highest for three months, confidence remained historically low.

Chris Williamson, Chief Business Economist at IHS Markit:

Eurozone manufacturing remained stuck in its steepest decline for seven years in October, meaning the goods producing sector is on course to act as a severe drag on GDP again in the fourth quarter. The survey data are consistent with industrial production falling at a quarterly rate in excess of 1%. (…)

Meanwhile in China:

New orders rose at the fastest rate for over six-and-a-half years, supported by a return to growth of export sales. Foreign demand for Chinese goods increased at the quickest pace since February 2018 during October. However, firms also perceived that sales had gained momentum and the business environment had improved on the back of policy support.

The ‘mother of all bubbles’ could blow up the economy if profits don’t improve, warns Blackstone strategist

(…) Among the recent troubles he thinks are connected are repo market woes, negative-yielding debt, global trade conflicts and collapsing manufacturing. And every cycle ends with excess. (…)

The “mother of all bubbles” in the sovereign debt market, Zidle says, is the catalyst that will likely trigger the next recession. He expects that to happen between mid-2020 and the end of 2021.

The good news for investors is a rise in quarterly profits that will boost markets in the near term. “The first three quarters of 2019 faced the toughest [comparables] since this profits cycle started in 2016,” he writes. “Earnings are flat this year. Next year, year-over-year comps should be easier.” (…)

EARNINGS WATCH

Actual earnings growth for the 356 companies having reported so far is +1.2% on revenue growth of +4.9%. The beat rate is 76%, the surprise factor +4.6% and the blended growth rate –0.8% (+1.6% ex-Energy), down from +0.3% on July 1

By comparison, after 355 reports during Q2, the beat rate was 74%, the surprise factor +6.1% and the blended growth rate +2.5%, up from +0.3% on July 1. Actual earnings growth for the 355 companies having reported was +5.9% on revenue growth of +3.6%.

Trailing EPS are now $163.59, still down from $163.69 at the same time in Q2 and 0.5% lower than the $164.43 and $164.31 at the end of August.and September respectively.

Revisions were somewhat positive last week (second consecutive week) but Q4 estimates keep being ratcheted down to +1.1% (+3.3% ex-Energy from +5.0% last week). This is down from +4.1% on Oct.1. and +2.2% last Friday.

TECHNICALS WATCH

Lowry’s Research says that, “on balance, the weight of evidence continues to point to healthy primary and intermediate-term uptrends in the market. Any signs of potential weakness are strictly short term in nature. These include signs that Demand has been growing more selective over the past few weeks (…). At the same time, while short-term measures of Demand have been falling (…), there has been no corresponding increase in measures of Supply (…). Historically, a lack of Demand, rather than rising Supply, is a characteristic shared by minor, short-term market tops. In summary, the dominant trends in Supply and Demand, along with expanding breadth and improving strength in Small Cap stocks, all suggest a bull market that remains alive and well.”

The Key to Electric Cars Is Batteries. One Chinese Firm Dominates the Industry. Beijing built the world’s largest EV market, then pressured foreign car makers to use its batteries

(…) China is by far the biggest EV market, and to boost its standing in the fast-growing industry, China began pressuring foreign auto makers to use locally-made batteries in the country several years ago. One company—Contemporary Amperex Technology Ltd., known as CATL—was the only shop capable of producing them at scale. (…)

China accounted for 60% of the 2.1 million electric vehicles sold world-wide last year. By 2030, global plug-in car sales are expected to be between 23 million and 43 million annually, according to the International Energy Agency. In its highest estimate, EVs will comprise 57% of vehicle sales in China, 26% in Europe and 8% in the U.S.

To meet demand, auto makers will need millions of lithium-ion batteries—by far the most lucrative part of an EV.

Leading the charge is CATL, which became the world’s biggest EV battery maker by installed production capacity this year—the number of battery factories and their combined scale—according to Benchmark Minerals Intelligence, a research firm. CATL modeled itself after another Chinese company, telecommunications giant Huawei Technologies Co., copying its departmental structures and culture of demanding workloads, employees said. CATL also mimicked Huawei’s practice of prioritizing research and development to deliver frequent technology improvements. (…)

China has also been seeking to lock up much of the world’s supply chain for cobalt, a vital battery component, through purchases from mines in places like the Democratic Republic of Congo. (…)

While Asian companies took the lead in EV battery technology, the European automotive sector was focused on developing diesel-engine technology until recently, and U.S. companies have doubted the business case for electric vehicles at home.

The U.S., which accounted for 13% of global EV sales in the first half of 2019, has so far let the free market take its course. (…)

By 2028 [CATL] will have enough capacity to supply 4.2 million EVs annually, narrowly ahead of South Korea’s LG Chem Ltd. and way ahead of the industry’s other major players, including Samsung SDI Co. and Panasonic.

CATL is branching out beyond China. The company is investing $2 billion in its first overseas plant in Germany, to open in 2021, with BMW AG as its first major customer. It also opened a U.S. sales office in Detroit in December, though U.S. trade battles with China make its prospects uncertain. The shortage of U.S.-based battery production makes the opening of a CATL plant in North America a likely next step, politics allowing, said Simon Moores, managing director of Benchmark Minerals Intelligence. (…)

Beijing rolled out a subsidy program starting in 2013 to encourage local and foreign auto makers to sell more EVs. China promoted EVs as part of a program to boost its capabilities in future industries, and as a way to combat pollution and reduce its dependency on foreign oil. (…)

As the market took off, in 2015, the government told auto makers they would only qualify for subsidies if they used batteries from a list of approved suppliers, which included dozens of Chinese firms but excluded foreign ones.

Auto makers willing to forgo subsidies were still free to use foreign batteries. But executives at global car companies say they were warned by Chinese officials to use local batteries or face reprisals in a country where foreign companies face a constant struggle to stay on good terms with the authorities. (…)

People in the battery business say CATL has now substantially closed the gap in cost and power output on Korean and Japanese companies, and will draw level within three years as it plows funds into research. It is in position to be at the top of the market pyramid, with many auto makers having already factored the company into their long-term plans. (…)

In June, Beijing announced plans to scrap its controversial restrictions on foreign EV batteries and reopen its market to the big Korean and Japanese players. China needs them, said Mr. Moores at Benchmark Minerals Intelligence, with total demand for EV batteries forecast to far exceed levels Chinese producers can meet by themselves. (…)

THE DAILY EDGE: 1 NOVEMBER 2019: Manufacturing PMIs

U.S. Added 128,000 Jobs as Hiring Remained Resilient U.S. employers hired at a solid clip in October, showing the job market remains strong even in the face of labor strikes and trade disputes.

The economy added 128,000 jobs in October, the Labor Department reported Friday. Job creation in September and August was revised up by a net 95,000. The jobless rate ticked up to 3.6% last month from 3.5% in September.

The 40-day GM strike ended last week. The government wouldn’t have counted thousands of GM workers on picket lines last month because they were on strike the week of the employer survey. Friday’s report stated employment in auto manufacturing fell by 42,000, “reflecting strike activity.” When excluding autos, manufacturing employment increased last month.

Employers have added an average 167,000 jobs to payrolls each month this year, a slowdown from the 223,000 jobs added each month, on average, last year. Next month’s hiring will get a boost with auto workers returning to the job.

Meanwhile, wage gains continued to outpace inflation. Average hourly earnings climbed 3% from October 2018. (…)

NBF:

The U.S. labour market is more resilient than you think. That’s the message from October’s jobs reports which shrugged off talk of recession and displayed no signs of losing steam. The establishment survey not only showed a consensus-topping 128K increase but also upward revisions to prior months which added an extra 95K to non-farm payrolls. That was made possible by a rampant private services sector whose net hiring dwarfed the expected decline in factory employment due to the strike at General Motors ─ the latter will reverse, hinting that overall employment could remain strong in November. Also encouraging were wage gains which left the year-on-year print unchanged at a healthy 3%, well above inflation.

The household survey was also strong with its net job creation of 241K tilted towards generally higher-paying full-time positions. As today’s Hot Chart shows, full-time positions now account for 83% of employment, the highest since March 2008. That will help support consumer spending on durable goods and housing. True, the latter survey also showed a jobless rate creeping up slightly to 3.6%, albeit still near 50-year lows. But that was largely due to the participation rate rising to a six-year high of 63.3%, a positive development (which we explained in a Hot Chart last week). All told, this morning’s data will validate the Fed’s decision of taking a pause in its easing cycle.

image

ING:

(…) Nonetheless, payrolls growth remains on a softening trend. Having averaged 223,000 jobs per month through 2018, employment creation is running at a net 167,000 for 2019. Interestingly, this can be broadly seen in all components expect one – leisure and hospitality – which has recorded consecutive gains of 48,000, 45,000 and 61,000 per month. The fact that this one, relatively modest-sized component was responsible for half of all the jobs created is perhaps a signal that we shouldn’t get too excited by today’s figures (…)

 Source: Bloomberg, ING

Rise in U.S. Employment Costs Quickens in Q3

The employment cost index (ECI) for civilian workers rose 0.7% q/q in 2019 Q3, up from a 0.6% quarterly rise in Q2. The y/y growth of total compensation was unchanged at 2.8% in Q3, down from 2.9% in 2018 Q4 and 2019 Q1. Wage and salaries jumped up 0.9% q/q (2.9% y/y) in Q3 versus 0.7% q/q in Q2 while benefits for civilian workers picked up, rising 0.6% q/q (2.4% y/y) in Q3 versus 0.5% in Q2. Civilian workers include those in private industry and in state and local governments, but not in the federal government.

Total compensation gains in private industry quickened even more in Q3, rising 0.8% q/q (2.7% y/y) versus 0.5% q/q in Q2. This was the fastest pace of quarterly advance since 2018 Q3. The pickup in quarterly compensation growth in Q3 was concentrated in services-producing industries though the pace of compensation gains rose in both. Compensation in goods production increased 0.8% q/q, up marginally from 0.7% in Q2. Compensation in service production jumped 0.8% q/q in Q3 after having slowed sharply to 0.5% q/q in Q2. In contrast to the quarterly pattern, the y/y pace of service-producing compensation was unchanged at 2.7% in Q3 while the y/y pace for goods producing jobs jumped up to 3.0% in Q3 (the fastest annual pace since 2008 Q1) from 2.4% in Q2.

Wage and salary gains within private industry accelerated to 0.9% q/q (3.0% y/y) in Q3 from 0.6% in Q2. The quarterly pickup was led by growth in goods production, where wages rose 1.0% q/q in Q3 versus 0.7% in Q2. Wages in service production also posted a solid increase, rising 0.8% q/q in Q3versus 0.6% in Q2. Manufacturing wage growth was unchanged at 0.7% q/q in Q3 while wages in construction jumped up 1.4% q/q in Q3 after a 0.9% rise in Q2.

Private industry benefits growth rose slightly to 0.5% q/q in Q3 from a 0.4% q/q rise in Q2 with the y/y pace picking up to 2.0% from 1.8%. Annual growth in benefits in goods-producing sectors shot up to 2.3% in Q3 from 1.5% in Q3 while annual growth of service-producing benefits was unchanged at 1.9%.

This FRED chart plots QoQ growth in wages and salaries for private industries. The red lines are the year averages:

image

This chart contrasts the ECI for private industries YoY with Business Sales which are now running only +1.1% YoY, underscoring the margin squeeze:

image

U.S. Consumers Stay on a Spending Streak Households increased spending heading into the fourth quarter, suggesting consumers have continued to help prop up U.S. economic growth.5

Personal-consumption expenditures, or household spending, rose a seasonally adjusted 0.2% in September from August, the Commerce Department said Thursday. Outlays rose at a similar pace in August after growing more briskly in the first half of 2019. (…)

After the release of Thursday’s data, forecasting firm Macroeconomic Advisers lowered its estimate for fourth-quarter gross-domestic-product growth to a 1.6% annual rate from 1.7%. (…)

U.S. Inflation Remains Soft in September The personal consumption expenditures price index fell a seasonally adjusted 0.01% from August, its weakest monthly reading since January

Compared with September 2018, the index was up 1.33%, well below the Fed’s 2% target.

An index of so-called core prices, which excludes volatile food and energy components, rose 0.05% last month from August and was up 1.67% on the year. Economists surveyed by The Wall Street Journal had expected a 0.1% gain in the core index in September from August. (…)

The Labor Department said its employment-cost index, a broad gauge of compensation that measures the combined cost of wages and benefits for civilian workers, rose 0.7% in the third quarter from the previous three months and 2.8% from a year earlier. That was less than the 2.9% gain notched in the fourth quarter of 2018, suggesting that, at the very least, compensation growth isn’t accelerating. (…)

September could have been an aberration given good consumer demand and rising tariffs:

image

MANUFACTURING PMIs
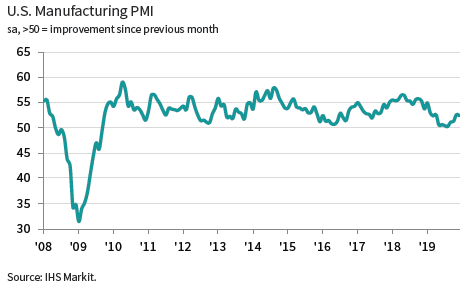
USA: PMI rises to six-month high in October

The U.S. manufacturing sector saw a further modest improvement in operating conditions in October, supported by faster expansions in output and new business. Rates of growth in both production and new orders accelerated to six-month highs. Subsequently, employment rose at the quickest pace since May and business confidence picked up to a four-month high. Meanwhile, rates of input price and output charge inflation softened and remained subdued, with selling prices broadly unchanged during the month.

The seasonally adjusted IHS Markit final U.S. Manufacturing Purchasing Managers’ Index™ (PMI™) posted 51.3 in October, up slightly from 51.1 in September. The latest headline figure was the highest since April, but remained consistent with only a modest improvement in the health of the manufacturing sector. The overall rate of growth remained well below the long-run series average.

image

Supporting the improvement in the PMI was a faster rise in production in October. Although still moderate, the rate of expansion in output accelerated to a six-month high and was accompanied by a quicker upturn in new business. New orders across the manufacturing sector increased for the fifth consecutive month and the rate of growth quickened to the fastest since April. Firms noted that their clients were exhibiting less hesitancy in placing orders and market conditions had improved. Foreign demand also ticked up following three successive monthly contractions in new export orders, with new business from abroad rising marginally overall.

On the price front, cost burdens rose at only a modest pace at the start of the fourth quarter. Although some firms reported higher input prices stemming from the ongoing impact of tariffs, many suggested that subdued price pressures were often linked to price drops at suppliers, notably for metals. Subsequently, average factory gate charges across the goods producing sector were broadly unchanged as manufacturers only partly passed on higher costs to clients.

At the same time, greater production requirements contributed to the fastest rise in workforce numbers since May. Some firms also noted that higher staffing levels were due to the filling of previously held vacancies. Backlogs, however, were unchanged in October following a three-month sequence of decline.

In line with stronger client demand, manufacturers registered a greater degree of confidence in output growth over the coming year. More favourable market conditions partially drove  optimism to its highest level since June. Nonetheless, the overall degree of sentiment was below the long-run series trend.

Finally, despite a renewed rise in input buying, the stronger increase in new business meant firms increasingly dipped into stocks to ensure new orders were fulfilled in a timely manner. Therefore, pre-production inventories fell at the quickest rate for three months and stocks of finished goods decreased slightly. (…)

However, while the outlook has improved, further growth is by no means assured. Survey respondents continue to report widespread concerns over issues such as tariffs, the auto sector’s ongoing malaise, a lack of pricing power amid weak demand and uncertainty about the economic and political situation over the coming year. While the survey data are moving in the right direction, the overall picture therefore remained one of only very modest growth and guarded optimism.

The ISM:

The October PMI® registered 48.3 percent, an increase of 0.5 percentage point from the September reading of 47.8 percent. The New Orders Index registered 49.1 percent, an increase of 1.8 percentage points from the September reading of 47.3 percent. The Production Index registered 46.2 percent, down 1.1 percentage points compared to the September reading of 47.3 percent. The Backlog of Orders Index registered 44.1 percent, down 1 percentage point compared to the September reading of 45.1 percent. The Employment Index registered 47.7 percent, a 1.4-percentage point increase from the September reading of 46.3 percent. The Supplier Deliveries Index registered 49.5 percent, a 1.6-percentage point decrease from the September reading of 51.1 percent. The Inventories Index registered 48.9 percent, an increase of 2 percentage points from the September reading of 46.9 percent. The Prices Index registered 45.5 percent, a 4.2-percentage point decrease from the September reading of 49.7 percent. The New Export Orders Index registered 50.4 percent, a 9.4-percentage point increase from the September reading of 41 percent. The Imports Index registered 45.3 percent, a 2.8-percentage point decrease from the September reading of 48.1 percent. (…)

Of the 18 manufacturing industries, five reported growth in October (…)

(ZeroHedge)

CHINA: Operating conditions improve at quickest pace since February 2017

October data showed the strongest improvement in operating conditions faced by Chinese manufacturers since February 2017. Output and new orders both expanded at steeper rates, with the latter supported by a renewed increase in export business. As a result, companies increased their purchasing activity, and at the quickest pace for 20 months. However, efforts to contain costs contributed to a further drop in staffing levels, which underpinned another solid increase in outstanding business. Prices charged by manufacturers meanwhile fell slightly due to competitive market pressures, while cost burdens rose only slightly. Business confidence regarding the 12-month outlook for output improved to its highest since April, with a number of firms optimistic that market conditions will strengthen.

The headline seasonally adjusted Purchasing Managers’ Index™ (PMI™) rose from 51.4 in September to 51.7 in October. The index has now signalled an improvement in operating conditions for three months running, with the latest improvement the strongest seen since February 2017.

image

Total new work received by Chinese goods producers rose solidly in October, with the rate of expansion the quickest recorded for 81 months. Companies commented on firmer underlying market conditions and improved client demand both at home and abroad. Notably, new export business increased for the first time in five months, albeit marginally. The subindex for new orders stayed in positive territory and rose to the highest level since January 2013. The gauge for new export orders returned to expansionary territory and reached the highest point since February 2018, due likely to the U.S.’ move to exempt more than 400 types of Chinese products from additional tariffs.

Greater amounts of incoming new work prompted manufacturers to expand production again in October. The upturn in output was solid overall, with the rate of growth the quickest since December 2016.

In contrast, staffing levels declined further, with the rate of job shedding quickening since September. A number of firms mentioned this was due to the non-replacement of voluntary leavers and efforts to contain costs. As a result, capacity pressures persisted, as highlighted by a solid increase in outstanding business.

Improved client demand led firms to expand their purchasing activity, with the rate of growth the quickest since February 2018. This contributed to a further rise in stocks of inputs, albeit marginal. Inventories of finished goods meanwhile declined amid reports of the greater use of stocks to fulfil orders. Average suppliers’ delivery times increased again in October, with some firms blaming this on the impact of stricter environmental protection policies.

Factory gate prices in China fell slightly at the start of the fourth quarter as firms sought to remain competitive. At the same time, average cost burdens rose only marginally.
Manufacturers expressed the strongest degree of positive sentiment towards the one-year outlook for output since April. However, confidence remained subdued in the context of historical data.

JAPAN: PMI falls to 40-month low amid strong deterioration in demand

Japan’s manufacturing economy sank deeper into contraction during October, according to the latest PMI survey. The stronger deterioration reflected a further weakening in demand conditions, with new orders falling at the sharpest pace since May 2016. Production was subsequently cut, as were inventory levels and purchasing volumes. Output charges were also discounted as firms sought to attract greater demand. That said, employment growth picked up to a six-month high, input cost inflation remained relatively subdued, and business confidence edged up slightly.

The headline Jibun Bank Japan Manufacturing Purchasing Managers’ Index™ (PMI)® fell to 48.4 in October, from 48.9 in September, its lowest mark in nearly three-and-a-half years and indicative of a stronger downturn in Japan’s goods-producing economy.

image

The sharper deterioration in business conditions was driven by a steeper drop in demand. Latest survey data pointed to a marked decline in new orders placed at Japanese manufacturers. According to anecdotal evidence, the month-on-month fall in sales was partly reflective of the end of last-minute purchases before the consumption tax hike, which took effect in October. That said, underlying demand from both domestic and external markets reportedly remained unfavourable. Total new orders fell at the fastest rate since May 2016, while new export business also declined for an eleventh successive month.

With inflows of new work decreasing, Japanese manufacturers cut production during October. Overall, the reduction was the strongest for seven months and broad-based across each of the three market groups. Capital goods producers observed the fastest cutback, followed by intermediate and then consumer goods makers. Panellists attributed lower output volumes to the typhoon, as well as spillover effects from trade frictions with the US and China.

In line with falling order book volumes, Japanese manufacturers trimmed their purchasing activity during October to the quickest extent in three months. A reluctance to hold items in stocks was also signalled by simultaneous draw-downs to pre- and post-production inventories during the latest survey period. In fact, rates of depletion in both cases accelerated during the month, with stocks of finished goods falling at the fastest rate since survey data were first collected 18 years ago.

Capacity pressures subsided during the latest survey period, as evidenced by a decline in backlogs of work at Japanese goods producers. Nevertheless, employment levels increased at the fastest pace in six months. Job creation was broad-based across all three manufacturing sub-categories.

On the price front, input price inflation held close to that recorded in September, which was the weakest for almost three years. Yen appreciation and drops in some raw material prices curbed cost pressures, according to some firms. In order to boost demand, firms took advantage of the low cost inflation environment and discounted charges.

Europe PMI to be released on Monday.

EARNINGS WATCH

Actual earnings growth for the 356 companies having reported so far is +1.2% on revenue growth of +4.9%. The beat rate is 76%, the surprise factor +4.6% and the blended growth rate –0.8% (+1.6% ex-Energy), down from +0.3% on July 1

By comparison, after 355 reports during Q2, the beat rate was 74%, the surprise factor +6.1% and the blended growth rate +2.5%, up from +0.3% on July 1. Actual earnings growth for the 355 companies having reported was +5.9% on revenue growth of +3.6%.

Trailing EPS are now $163.59, still down from $163.69 at the same time in Q2 and 0.5% lower than the $164.43 and $164.31 at the end of August.and September respectively.

Q4 estimates keep being ratcheted down to +1.1% (+3.3% ex-Energy from +5.0% last week). This is down from +4.1% on Oct.1. and +2.2% last Friday.

image