The enemy of knowledge is not ignorance, it’s the illusion of knowledge (Stephen Hawking)

It ain’t what you don’t know that gets you into trouble. It’s what you know for sure that just ain’t so (Mark Twain)

Invest with smart knowledge and objective odds

THE DAILY EDGE: 31 OCTOBER 2019

Personal Income and Outlays, September 2019

Just out. Consumer still ok. Inflation MIA…

Personal income increased $50.2 billion (0.3 percent) in September according to estimates released today by the Bureau of Economic Analysis. Disposable personal income (DPI) increased $55.7 billion (0.3 percent) and personal consumption expenditures (PCE) increased $24.3 billion (0.2 percent).

Real DPI increased 0.3 percent in September and Real PCE increased 0.2 percent. The PCE price index decreased less than 0.1 percent. Excluding food and energy, the PCE price index increased less than 0.1 percent.

image

Fed Cuts Rate for Third Time This Year, Signals Pause Central bank statement indicates a higher bar for future rate reductions

“The current stance of [interest-rate] policy is likely to remain appropriate” as long as the economy expands moderately and the labor market stays strong, Fed Chairman Jerome Powell said at a news conference Wednesday after the conclusion of a two-day meeting. He didn’t rule out additional cuts if that favorable outlook faltered. (…)

Mr. Powell indicated Fed officials were now comfortable entering a wait-and-see phase by highlighting the accumulation of the Fed’s recent rate cuts, which he said would provide significant support for the economy, and by noting how it takes time for the bank’s moves to ripple through the economy. (…)

  • Here are the components of the quarterly GDP changes. (The Daily Shot)

(…) The final analysis is that we have a monetary policy that has tried to take out some insurance, but does not presuppose a recession. Meanwhile, the extreme Fed-sensitivity of the last 12 months or so is likely to dissipate. Hoping for further rate cuts at this point is tantamount to hoping for a recession. It is possible that more Fed cuts will indeed prove to be helpful, but that would not be enough to stop risk assets from falling. From now on, equity markets, no less than the Fed, must be data-dependent. We all can share a hope that the next FOMC meetings will matter a lot less. (…)

Different folks, different strokes:

At a press conference after the Bank of Canada’s decision to keep the current 1.75% policy interest rate unchanged for an eighth straight meeting, Poloz said his governing council discussed the possibility of implementing an “insurance” cut to counter global economic headwinds, but decided against it because of the potential costs to such a move. These include driving up inflation already at the central bank’s 2% target, and fueling household debt levels that are among the highest in the world.

“Governing Council considered whether the downside risks to the Canadian economy were sufficient at this time to warrant a more accommodative monetary policy as a form of insurance against those risks, and we concluded that they were not,” Poloz said. The Bank of Canada “is mindful that the resilience of Canada’s economy will be increasingly tested as trade conflicts and uncertainty persist.”

While the decision to remain on hold for now will cement Poloz’s status as an outlier, markets will interpret his comments about an insurance cut as an attempt to lay the groundwork for a future move if the domestic economy deteriorates. Earlier, the central bank released a rate statement that was more dovish than other recent communications, along with a set of reduced growth forecasts. (…)

Poloz Holds
Small Business Wage Growth Gains Momentum, Job Growth Holds Steady in October

The tight labor market positively impacted wage growth in October, according to the latest Paychex | IHS Markit Small Business Employment Watch. Hourly earnings are on the rise, reaching 3.00 percent ($0.80) growth in October. Additionally, after hovering just above two percent to start the year, weekly earnings growth has quickly improved to 3.36 percent as month-to-month gains grow larger. At 98.14, the national jobs index remains essentially the same as last month (98.22).

“The recruitment and retention challenges presented by this tight labor market are becoming more noticeably reflected in employees’ paychecks,” said Martin Mucci, Paychex president and CEO. “We anticipate wage growth will continue as employers work to attract and keep top talent.”

Broken down further, the October report showed:

  • The South remains first among regions in employment growth; the West retained its lead among regions in wage growth.
  • Tennessee remains the leader among states in small business job growth; New York took the top spot among states for wage growth.
  • Dallas is again the top metro for job growth; Los Angeles became the leading metro in wage growth.
  • Leisure and Hospitality reached 5.00 percent hourly earnings growth in October, best among industry sectors.
National Jobs Index
  • Giving up a portion of its September gain, the pace of small business job growth remains a percentage point below a year ago.
  • At 98.14, the jobs index has remained essentially flat since July’s 98.18.

Chinese Manufacturing Slumps to Eight-Month Low Chinese manufacturing activity fell to an eight-month low in October, raising another warning signal as hopes for a temporary truce in the U.S.-China trade talks were dealt a further blow.

China’s official gauge of factory activity, the manufacturing purchasing managers index, dropped to 49.3 in October from 49.8 in September, the National Bureau of Statistics said Thursday. (…)

A subindex measuring total new orders received by China’s manufacturers decreased to 49.6 in October from 50.5 in September, the statistics bureau said.

New export orders, an indicator of external demand for Chinese goods, fell to 47.0 from 48.2 in September, while import orders tumbled to 46.9 from 47.1 a month earlier. Production also eased to 50.8 in October, compared with 51.9 in September.

Meantime, business activity outside China’s factory gates expanded at the slowest pace in October in nearly four years, as weaker growth among service providers outweighed strength in the construction sector, a separate official gauge showed.

China’s official nonmanufacturing PMI, also released Thursday, dropped to 52.8 from 53.7 in September. (…)


  • It should be noted that the official PMI figures have recently diverged from those published by Markit (Caixin PMI). (The Daily Shot)

Source: Commerzbank Research

We get Markit’s PMIs tomorrow, together with non-farm payrolls.

China’s auto market could shrink about 8% this year: industry official Auto sales in China may skid to 26 million this year, a drop of around 8%, a senior industry executive warned, as the world’s largest auto market braces for a second year of contraction amid slowing economic growth and tighter vehicle emissions standards.

The latest prediction, by Fu Bingfeng, executive vice chairman of the China Association of Automobile Manufacturers (CAAM), is lower than the group’s previous forecast for a 5% drop, issued in July. (…)

Around 28 million cars were sold in China in 2018, down 3% from a year earlier, the first sales drop since 1990s. Monthly sales dropped in September to mark the 15th consecutive month of decline. (…)

China Doubts Long-Term Trade Deal Possible With Trump

(…) In private conversations with visitors to Beijing and other interlocutors in recent weeks, Chinese officials have warned they won’t budge on the thorniest issues, according to people familiar with the matter. They remain concerned about President Donald Trump’s impulsive nature and the risk he may back out of even the limited deal both sides say they want to sign in the coming weeks. (…)

In meetings ahead of that plenum some officials have relayed low expectations that future negotiations could result in anything meaningful — unless the U.S. is willing to roll back more of the tariffs. In some cases, they’ve urged American visitors to carry that very message back to Washington, the people said. (…)

EARNINGS WATCH
Better-Than-Expected Earnings Ease Growth Fears Earnings are on track to decline for the third consecutive quarter, but about 75% of the 280 companies in the S&P 500 that have posted results through Wednesday morning have beaten expectations.

Although earnings are on track to decline for the third consecutive quarter, about 75% of the 280 companies in the S&P 500 that have posted results through Wednesday morning have beaten expectations, according to FactSet. That is slightly above the five-year average of 72%. More than 100 companies report through the end of the week.

While overall profits are expected to fall about 3.2% from a year earlier, the steepest decline since 2016, most analysts have called a bottom. They project earnings growth to accelerate next year, helping to allay fears of a potential recession.

“Earnings…are truly better than expected,” said Peter Vanderlee, a portfolio manager at ClearBridge Investments who helps oversee $22 billion in assets. “As a result, there hasn’t been a moment where you would say, ‘Look, it is upon us. A recession is nearing.’” (…)

Thirty-nine companies in the S&P 500 have issued negative outlooks, compared with 15 giving positive guidance, according to FactSet. (…)

Those that get less than 50% of revenue from the U.S. are on track for an 8.6% earnings decline and a 2.4% fall in revenue, FactSet data show, compared with a more modest 0.3% earnings decline and 4.9% jump in revenue for those that generate more than half of their revenue in the U.S. (…)

Actually, a more recent Factset release says that

For companies that generate more than 50% of sales inside the U.S., the blended earnings decline is -0.8%. For companies that generate less than 50% of sales inside the U.S., the blended earnings decline is -9.1%. (…)

For companies that generate more than 50% of sales inside the U.S., the blended revenue growth rate is 4.6%. For companies that generate less than 50% of sales inside the U.S., the blended revenue decline is -2.0%.

Other facts but these are from Refinitiv/IBES:

Actual earnings growth for the 278 companies having reported so far is +0.3% on revenue growth of +3.2%. The beat rate is 74%, the surprise factor +4.4% and the blended growth rate –1.6% (+0.9% ex-Energy), down from +0.3% on July 1

By comparison, after 261 reports during Q2, the beat rate was 76%, the surprise factor +6.1% and the blended growth rate +0.9%, up from +0.3% on July 1. Actual earnings growth for the 261 companies having reported was +6.5% on revenue growth of +4.2%.

Trailing EPS are now $163.21, still down from $163.69 at the same time in Q2 and 0.7% lower than the $164.43 and $164.31 at the end of August.and September respectively.

Q4 estimates keep being ratcheted down to +1.6% (+3.8% ex-Energy from +5.0% last week). This is down from +4.1% on Oct.1. and +2.2% last Friday.

We are now more than half way through the season with a broad spectrum of sectors in. The media highlight the beat rate and the surprise factor but fail to mention that reported earnings are flat (+0.3%), a meaningful slowdown from the +6.5% reported by the roughly same companies at the same stage during Q2. The second half of the Q2 earnings season came in much weaker and brought full quarter earnings growth down to +3.2%.

On the positive side, conference calls have been generally good as most companies sounded positive on the economy and their prospects going forward in spite of all the uncertainties around.

image

TECHNICALS WATCH

Lowry’s Research says that rising Demand provided nominal support for yesterday’s rally “as Up Volume and Down Volume were evenly split, each with 50% of total NY Up/Down Volume. Breadth was only marginally better with Advances at 52% of total Adv/Dec Issues. Despite today’s new high in the S&P 500, buying continued to grow more selective, as the % of stocks above their 10-DMAs fell to 68.86% versus its recent high at 79.60% set on Oct. 21.”

  • The 13/34–Week EMA Trend remains bullish (CMG Wealth)
SENTIMENT WATCH
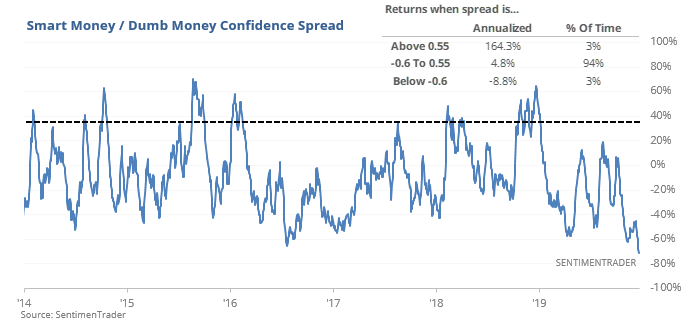
Smart Money vs Dumb Money Is Getting Extreme

Quite a few times over the past couple of months, we’ve discussed how various aspects of sentiment were curiously subdued. From individual investor surveys to fund flows to hedge fund exposure, and many more, we were seeing readings typically present during much more prolonged and severe pullbacks.

That’s starting to change.

Smart Money is becoming less confident that stocks will rally in the weeks and months ahead, while Dumb Money is becoming more confident than they will. The spread between them is getting extreme, dropping below -40% for the first time in months.

image

image

This is a volatile, short term indicator for the trader in you. How smart do you feel? CMG Wealth offers another incentive (this is as of yesterday from NDR):

  • NDR Daily Trading Sentiment Composite: Extreme Optimism (S/T Bearish for Equities).

Current regime is highlighted in yellow below.

  • Current daily sentiment reading is 64.44. It was 48.89 last week.
  • Buying opportunities occur at “Extreme Pessimism” readings below 41.5.  Selling opportunities occur at “Extreme Optimism” readings above 62.5.
  • Note: The most attractive buying opportunities have historically occurred with readings occur when Daily Trading Sentiment Composite is below 25.  While the strongest sell signals have occurred with readings above 75.  The super extreme “extremes.”
  • 1994 to Present and 2006 to Present below (current indicator score shaded below):

Source: Ned Davis Research
NDR Disclosure; CMG Disclosure.

Confused smile But, be also aware of this:

  • NDR Crowd Sentiment Poll: Extreme Pessimism (S/T Bullish for Equities).

The current weekly sentiment reading is 65.6. It was 61.8 last week.  The current regime is highlighted in yellow.

NDR measured 92 incidences of Crowd Sentiment extremes since 1996.  There have been 92 extremes since 1996. The crowd was right just one time and wrong 91 times. Had one followed the crowd at the time at those extremes, one would have lost over 12,000 S&P 500 points (according to NDR).  The last Extreme Pessimistic was reached on December 24, 2018 and the last Extreme Optimistic was reached in early April 2019.

It is important to note, the most attractive Extreme Pessimism buy signals have historically occurred with readings below 47.  The most attractive sell signals have historically occurred with readings above 70. Call them super extreme “extremes.”  These are the most important levels I am keeping my eye on when it comes to investor sentiment.

Here is how to read the next data box:

  • Best buying opportunities occur at “Extreme Pessimism” readings below 57.
  • Gain/Annum for the S&P 500 Index (data from December 1, 1995 to present).
  • Current indicator score highlighted in yellow:

Source: Ned Davis Research
NDR Disclosure; CMG Disclosure.

This is interesting and requires some more work:

High dividend yield stocks are trading at their cheapest level since the late 1990s.

Source: Wolfe Research, @DriehausCapital (via The Daily Shot)

And this:

The improvement in global leading economic indicators could signal more upside for equities and bond yields. (The Daily Shot)

Source: BCA Research

Now, the latest OECD LEIs do not suggest a turn except for China. Financial Sense also has its own LEIs:

But since this post is decidedly trying to confuse, here’s Hoisington Investment’s view (these guys are very good with a great track record on bonds):

(…) At a minimum, the current drop in world trade volume confirms that world manufacturing is in recession. Although this sector is not as important as it was historically, it is the high value-added component of economic activity, amounting to about a 20% contribution to real GDP in the United States. Even as the manufacturing sector’s role has diminished, it has continued to be a leading indicator of economic activity. (…)

During the past four years both the increase in the Fed funds rate (the price effect), and the global impact of a reserve reduction in U.S. and global banks’ liquidity (quantity effect) have had a simultaneously negative impact on economic growth here and abroad thus lowering price pressures. Accordingly, investors in the U.S. and around the world lowered expectations of both the real rate and inflation, with the result that government bond yields fell globally. Reflecting the inexorable lagged impact of a tightening of monetary policy, this process is far from over.

Despite the evidence that monetary policy works with long lags, the Fed appears to be waiting for a downturn in the coincident economic indicators before attempting to “get ahead” of where the market has priced interest rates. The three-month bill rate, for instance, is rate sensitive to the policy rate (Fed funds) and stood at 1.84% at the end of the quarter, versus the 10-year note yield at 1.68%. This yield curve has been inverted for over four months which has historically been associated with a policy rate which is too high for the current economic conditions. The proof, of course, is historic.

During the period from 1921 to 2008, there were ten inversions of this yield curve each of which preceded the ten recessions. The lags between initial inversion and recession have been variable but the market is presently within the historical lagged periods. The current overrestraint of Fed policy is why 5, 10, and 20-year Treasury security yields have not set new record lows, but it is only a matter of time.

The more restrictive monetary conditions originated in the U.S. but were transmitted globally and fell upon very fragile economies experiencing an increasing debt overhang. Major economies are carrying too much debt, and too much of the wrong kind of debt, therefore the GDP generated per dollar of debt is falling. This is more properly referred to as the marginal revenue product of debt. (…)

image

The global over indebtedness has clearly restrained growth, and therefore has had a profound disinflationary impact on every major economic sector of the world. This fact, coupled with an overzealous U.S. Central Bank have created the conditions for an economic contraction in the U.S. and abroad. This has also created a worldwide decline in inflation and inflationary expectations. It is therefore unsurprising that record lows in long term interest rates have been established in all major economic regions. A quick and dramatic shift toward greater accommodation by the Fed could begin to shift momentum from contraction toward expansion. However, policy lags are long and slow to develop, therefore despite the remarkable decline in long term yields this year, we are maintaining our long duration holdings. A shift towards shorter duration portfolios would be appropriate when the forward-looking indicators of expansion, in the U.S. and abroad, begin to appear.
Van R. Hoisington
Lacy H. Hunt, Ph.D.

Airplane Boeing 737 cracks: union calls on Qantas to ground entire 737 fleet for investigation

Australia’s aircraft engineers association has called on Qantas to ground all of its Boeing 737 aircraft after cracks were discovered in one of its planes.

Steve Purvinas, the federal secretary of the Australian Licensed Aircraft Engineers Association (ALAEA), said the fleet of 33 should be “grounded until such time that Qantas can establish which aircraft are safe and which aircraft aren’t”.

According to Purvinas, the crack was discovered in a part of the plane known as the “pickle fork”, which is part of the landing gear.

“It is a primary structure which takes the load off the wing,” he told the ABC on Thursday. “This could cause loss of control of an aircraft, and Qantas shouldn’t be flying them.”

“The first [crack] found on a Qantas aircraft was about an inch long, it’s very small. But these things do propagate very quickly when they’re under load…It’s when that grows, and that grows very quickly, that you have problems.”

He told the ABC on Thursday that another crack had been found in a second plane overnight.

On Thursday morning, Qantas announced it would be checking more than 30 of its Boeing 737 aircraft after cracking was discovered in one plane during a maintenance check.

But Purvinas said the airline should go further and ground the fleet.

Earlier this year, the US Federal Aviation Administration ordered global airlines to check any 737s that had completed 30,000 flights for cracks.

The Qantas plane involved had completed fewer than 30,000 cycles.

“None of Qantas’ 737s have reached the 30,000 cycle mark. However, out of an abundance of caution, we will have inspected 33 aircraft with more than 22,600 cycles by the end of the week rather than the seven months required,” the carrier told the ABC on Thursday. (…)

“Detailed analysis by Boeing shows that even when a crack is present, it does not immediately compromise the safety of the aircraft, as indicated by the timeframe given by regulators to perform the checks.”

The problem came to light after Boeing said that it had found cracking in a part of the 737NG (the model before the troubled 737 Max) called the “pickle fork” on jets being overhauled in China.

Nearly 5% of 810 inspections subsequently conducted have found cracks in the part, which attaches the plane’s fuselage to the wing.

Purvinas told the ABC that repairs on this kind of crack take “months to fix” and require a special Boeing team.

If you have followed the saga of the 737MAX, you know we cannot trust Boeing here…

THE DAILY EDGE: 30 OCTOBER 2019

Posted yesterday: TIME TO GET SCARED?
U.S. Pending Home Sales Strengthen

The National Association of Realtors (NAR) reported that U.S. pending home sales rose 1.5% (3.9% y/y) during September following a 1.4% August increase. The index level of sales increased to 108.7, the highest level since December 2017.

Sales were mixed last month across the country. In the Midwest sales increased 3.1% (2.7% y/y) last month after a 0.2% rise. In the South sales rose 2.6% (5.7% y/y) following a 1.3% gain. Working 1.3% lower (+3.4% y/y) were sales in the West after a 3.1% rise. In the Northeast sales eased 0.4% (+1.3% y/y) following a 1.4% increase.

image

  • According to the Case-Shiller index, home prices declined in August. (The Daily Shot)
U.S. Consumer Confidence Unexpectedly Slips

image

  • The Conference Board’s index that tracks consumers’ plans to purchase a vehicle has deteriorated.

Source: Pantheon Macroeconomics (via The Daily Shot)

Incoming ECB President Lagarde says big European countries aren’t spending enough: report
EARNINGS WATCH

As of Oct 25th, close to the halfway mark in reporting season, 8% of S&P 500 companies had issued 4Q guidance. Of those, 60% have been negative, 18% have been positive, and 23% have been in line. Negative pre-announcements are still high vs. history, stuck around 2013-2015’s highs, but they are admittedly tracking a little lower than last quarter. (RBC)

The price that equity investors are willing to pay for fast growth is being tested again as slumps in Beyond Meat Inc. and Shopify Inc. show they’re demanding more of companies with premium valuations.

The veggie-burger maker and e-commerce platform on Tuesday became the latest examples of firms that delivered on revenue-growth expectations only to see their stocks fall. Meanwhile, the food-delivery company GrubHub Inc. showed how damaging the fallout can be when that growth fades.

Shopify slid as much as 7.7% in Toronto despite boosting its revenue forecast for the year. The company reported an unexpected third-quarter loss after it increased spending to expand its customer network and build out fulfillment centers across the U.S. The stock was up 124% year to date through Monday’s close and has a forward price-to-estimated sales ratio of 18, compared with an average of 1.6 for the S&P/TSX Composite Index.

A higher sales forecast also proved insufficient for Beyond Meat, which saw its shares tumble as much as 24% on concerns about competition and the expiration of a lockup for early investors. Beyond Meat shares are still up 240% since their initial public offering in May, but that’s far from their 800% returns back in July. The stock trades at a forward price-to-sales ratio of 12, more than 6 times the average multiple for stocks in the S&P 500 Index, according to data compiled by Bloomberg.

GrubHub may provide a cautionary tale. Its shares plunged a record 44% after the food-delivery company gave a fourth-quarter outlook that was well below expectations, as intensifying competition and “promiscuous” customers weighed on growth trends.

Vestager eyes toughening ‘burden of proof’ for Big Tech EU antitrust chief says dominant groups such as Google should face tougher obligations
How China Now Manages Money American-Style China has long been a nation of savers. Now, 40 years into the greatest accumulation of money the world has ever seen, the pattern is reversing. The impact will be felt world-wide, in ways good and bad.

(…) While Chinese families still sock away more than Americans—about five times more income—their overall savings rate is declining.

In 2010, average Chinese workers saved 39 cents of every dollar of income. Today, it is 33 cents. Many young Chinese save nothing at all. (…)

This shift toward saving less and spending more could help correct imbalances in the global economy that built up in years when Americans did much of the world’s buying, and China did much of its saving and lending. Consumer spending creates new growth momentum for China, and some foreign companies.

But it also means China will have less firepower to buy U.S. Treasurys, which helped keep U.S. interest rates low, and to use its savings to peddle influence abroad through programs like its Belt and Road development initiative. (…)

Industrial and Commercial Bank of China Ltd. and three other Beijing-headquartered banks leapt into the top four spots globally, based on capital.

The funds financed government priorities, like an 18,000-mile network of trains that can transport passengers at 200 miles an hour. Depositor savings help explain how Beijing has lifted military spending annually for around two decades, to $170 billion.

China built up $3.1 trillion in foreign-exchange reserves, including $1.12 trillion in the form of U.S. Treasurys. (…)

The wealthiest 10% of households have 80% of the savings, while 40% save nothing. Debts equal 13 times income for the bottom third of Chinese wage earners—all while Chinese lag behind Americans in earnings and wealth by big margins.

The average Chinese household controls 1.62 million yuan in real estate and other assets, or around $230,000, according to the Survey and Research Center for China Household Finance at Chengdu’s Southwestern University of Finance and Economics.

American household net worth is around $692,100, according to the Federal Reserve Board. Only about a third of U.S. household assets are real estate, while most Chinese wealth is. (…)

In a sign of how leveraged some Chinese have become, four-fifths of one firm’s loans are collateralized with used cars, according to one study. China’s central bank tracked a 19% rise in credit-card delinquencies last year, to 79 billion yuan and 10 times the 2010 level.

Default rates for some lenders have surpassed 20% on personal loans delivered online. (…)

Sun Sun Chateau Viking: Climate Change Makes Northern Wine a Reality

On the 61st parallel—the latitude of Anchorage, Alaska— Bjorn Bergum’s vineyard is set to become the world’s northernmost commercial wine estate, a testimony to how global warming is disrupting century-old landscapes, traditions and oenological preconceptions. (…)

When he and his wife, Haldis Nedrebø, planted the first vines in 2014, neighbors believed them crazy, he says, rotating an index finger over his temple. Last year, the temperature on his property reached 37 degrees Celsius (100 Fahrenheit), burning some grapes but helping produce wine that won a gold medal at a local blind-tasting competition.

Before, tourists would flock to the Nigardsbreen glacier. Now the glacier is receding, and the local tourist board touts Mr. Bergum’s vineyard as a new attraction. (…)