The enemy of knowledge is not ignorance, it’s the illusion of knowledge (Stephen Hawking)

It ain’t what you don’t know that gets you into trouble. It’s what you know for sure that just ain’t so (Mark Twain)

Invest with smart knowledge and objective odds

THE DAILY EDGE: 9 AUGUST 2019

Core U.S. Producer-Price Index Posts First Drop in Two Years

Excluding food and energy, producer prices dropped 0.1% from the prior month, compared with projections for a 0.1% gain, a Labor Department report showed Friday. The 2.1% annual increase was the slowest in two years. The overall producer-price index rose 0.2% from June, matching projections. (…)

U.S. Wholesale Inventories Steady; Sales Decline

Some say inventories are voluntarily boosted to avoid tariffs. The problem is that sales are sinking in the meantime.

image
US retailers ‘at war’ with suppliers over price rises Trump’s threat to impose tariffs on more consumer goods leaves industry anxious

(…) “It’s much easier for someone like Walmart to say ‘this is the price we will accept or we’ll walk away’,” said Jeff Lenard, vice-president of strategic industry initiatives at the National Association of Convenience Stores. The rise of retailers’ own brands, known as private-label goods, had given the likes of Costco and Walmart even more control in negotiations, said Ken Harris, managing partner at Cadent Consulting Group. “They’ve been pushing back for a long time [against price rises],” he said. (…)

China’s Factory-Gate Prices Slip Into Deflation Producer prices fell into deflation for the first time in three years, as worries over the trade war with the U.S. sapped demand.

(…) While producer prices fell 0.3% from a year earlier in July—lower than economists’ median forecast for a 0.1% drop—consumer prices edged up to a 17-month high, squeezing households’ spending power. (…)

China’s consumer-price index, meanwhile, rose 2.8% in July from a year earlier, higher than June’s 2.7% growth and beating market expectations of a 2.7% increase. (…)

U.S. Holds Off on Huawei Licenses as China Halts Crop-Buying
U.S.-China Trade Battle Is Crimping Global Oil Demand In its oil-market report, IEA downgrades its forecast for global oil demand for the third time in four months

In its closely watched oil-market report, the IEA downgraded its forecast for global oil-demand growth for the third time in four months, lowering it to 1.1 million barrels a day from 1.2 million barrels a day. Demand for the January-to-May period was at its weakest since 2008. (…)

The organization’s output was down 2 million barrels from the same month last year—also because of lower output from Venezuela and Iran—and production dropped by 190,000 barrels a day from June levels. Saudi Arabia was again the largest cutter, lowering production by 120,000 barrels a day, while half of that was offset by a 60,000-barrel-a-day increase from Iraq.

Iranian production, meanwhile, fell 50,000 barrels a day to 2.23 million barrels a day in July, its lowest since the late 1980s, amid U.S. attempts to cut exports to zero through sanctions.

That said, “it is widely reported that significant volumes are moving under-the-radar,” and tanker storage is close to an all-time high, the IEA noted. (…)

OPEC’s cut in July slightly outweighed a 160,000-barrel-a-day rise in non-OPEC production in July, with the IEA citing rebounds in North Sea and Brazilian production as offsetting a fall in U.S. output. Hurricane Barry at one point shut down around 70% of production in the Gulf of Mexico.

Canada’s Jobs Machine Gears Down on Private-Sector Hiring Plunge

The economy lost 24,200 jobs in July, Statistics Canada said Friday in Ottawa, versus expectations for a gain of about 15,000. That comes after a decline of 2,200 jobs in June. The unemployment rate rose to 5.7%, a second monthly increase after reaching a four-decade low of 5.4% in May.

Evidence of accelerating wages was one of the few pockets of strength, with hourly pay up 4.5% in July from a year ago. That’s the strongest annual pay rise in a decade and may reflect the effects of labor-market tightening earlier this year. (…)

  • Hours worked on a year-over- year basis slowed sharply, and the number of people employed by private sector companies plunged by the most since the last recession.
  • The labor market had been on a torrid pace in the first half, when it added 247,500 jobs — the bulk of them full time. Over the past three months however, employment has been little changed.
Canada shed 24.2K Jobs in July, most in nearly a year
Canadian wage growth is highest in a decade
OECD LEIS Continue to Decay

(…) OECD LEI data point to ongoing weakening of a relatively severe and worsening nature. (…)

Only China is showing improving momentum.

image

U.K. Economy Shrinks for First Time Since 2012 The British economy unexpectedly contracted in the second quarter as uncertainty over the country’s planned departure from the European Union on Oct. 31 took its toll on business confidence.

Global recession now a question of when, not if, economist David Rosenberg warns

“Fully 30 per cent of the world’s GDP now has their yield curves in an inverted state,” he added.

“Only the classic lags separate where we are now and the eventual downturn. Carry an umbrella and be ready to take it out. This means de-risking and becoming very defensive and well hedged.”

For investors, cash and gold are “kings” as yields decline.

“This meltdown in global market interest rates has happened, not at the bottom of the economic and equity cycle, but at the top!” Mr. Rosenberg added.

“Imagine where they go when the recession comes, unemployment rates rise and equities decline. Even in the USA, a move to negative yields out to the 10-year part of the curve is probable.” (…)

But this indicator, one of Rosenberg’s favorite, ain’t flashing anything bad just yet, is it?

image

EARNINGS WATCH

As of last night, we have 450 reports in, a 73% beat rate, a +5.7% surprise factor and a blended growth rate of 2.8%.

Trailing EPS are $164.24. The Rule of 20 P/E is back to Fair Value 19.9.

Speaking of earnings, Uber is not delivering just yet. Here’s how you can lose $5.2 BILLION in one quarter:

Surprised smile Uber moves into grocery deliveries as it posts $5bn loss Ecommerce push puts ride-hailing company in competition with Amazon

(…) The quarterly net loss, which hit $5.2bn vs $878m a year ago and included $3.9bn in stock-based compensation expenses related to the IPO, was spectacular in its own right. (On an adjusted basis the EBITDA loss came in at $656m, which marks an improvement on Q1.)

But the thing that really hit market sentiment was the slowdown in revenue growth at 14 per cent to $3.2bn. (…)

THE DAILY EDGE: 8 AUGUST 2019

Trio of Central Banks Surprise Markets With Aggressive Rate Cuts

Central banks in Malaysia, Indonesia, South Korea and South Africa have also reduced policy rates in recent months.

Fed’s Evans Says Trade Headwinds Could Justify Additional Rate Cuts

Evans said the risks have “gone up”, which can justify “more accommodation”, and acknowledged the other central bank moves: “once a substantial number of central banks consider repositioning their monetary policy, it’s natural that other central banks might be thinking that too”.

US agencies barred from buying Huawei equipment Trump administration rule also covers ZTE, Hikvision, Dahua and Hytera

US government agencies from the Pentagon to Nasa will be banned from buying Huawei equipment after the Trump administration implemented a congressional measure to crack down on Chinese companies seen as security threats. A rule issued by the administration bans Huawei, the Shenzhen-based telecoms company, and other Chinese groups from supplying the federal government. It also covers ZTE, a telecoms company; Hikvision and Dahua, manufacturers of surveillance cameras; and Hytera, which produces two-way radios. (…)

China Exports Stage Surprising Turnaround Chinese data show exports rose 3.3% last month, but economists say the reversal will likely be transient

China’s exports rose 3.3% from a year earlier last month, reversing a 1.3% decline in June, data from the General Administration of Customs showed. A Wall Street Journal poll of 13 economists had forecast a drop of 2%.

Shipments to Europe and Southeast Asia—China’s top two trading partners—also bounced back, while the decline in exports to the U.S. eased after President Trump and Chinese President Xi Jinping struck a conciliatory tone on trade at the Group of 20 summit in Japan in June.

Many Chinese exporters have made an effort to diversify their overseas markets in recent months as trade uncertainties loomed. Exports to the Association of Southeast Asian Nations bloc and EU rose 15.6% and 6.5%, respectively, from a year earlier in July, according to official data. (…)

U.S. Customs and Border Protection said it has identified illegal transshipments of Chinese goods in recent months through several countries, including Vietnam, Malaysia, and the Philippines. Data from China’s customs bureau Thursday showed double-digit export growth to these Southeast Asian countries, higher than the outbound-shipment growth to all trading partners.

China’s exports to the U.S. fell 6.5% in July from a year earlier, compared with a 7.8% decline in June, customs data show. Imports from the U.S. fell 19.1% from a year earlier, compared with a 31% drop the previous month. (…)

China also faces the prospect of slackening demand at home: Overall imports continued to slump in July, sliding 5.6% from a year earlier. (…)

 image image

But Grizzle’s Chris Wood argues that China’s domestic economy is not falling apart:

(…) nominal GDP growth accelerated last quarter, rising from 7.8%YoY in 1Q19 to 8.3%YoY in 2Q19 (…). Nominal and real retail sales growth rose from 8.6%YoY and 6.4%YoY respectively in May to 9.8% and 7.9% in June, the highest level since March 2018. Urban retail sales rose by 9.8%YoY in nominal terms in June while rural retail sales were up 10.1%YoY. (…) The household survey’s consumption expenditure per capita growth, which includes spending on services, rose from 7.3%YoY in 1Q19 to 7.5% in 1H19 in nominal terms (…). Residential real estate investment rose by 14.3%YoY in June and was up 15.8%YoY in 1H19, compared with 13.4% growth in 2018. (…)

CHINA RETAIL SALES GROWTH

ING gets into the details of China’s exports:

(…) Unusual items appeared to be very supportive to exports. China exported more coal (64% month-on-month), which could be due to a surplus in coal mining, as well as more fertiliser (42% MoM). It even exported more crude oil (56% MoM), which is very unusual because China’s crude exports had fallen 61.8% YoY year-to-date. 

It is possible that these exports are going to the Belt and Road economies which, if true, could be the start of a new trend for China’s exports.  

The more typical export items put in a fairly average performance. Handsets grew 9% MoM but were down 15.8% YoY YTD and auto-process computers fell 8.0% MoM. Combining the two, we don’t hold a very positive view of China’s exports because these two items usually comprise much of the growth. (…)

Downturn in global auto sector worsens in July

Latest PMI data signalled a deepening downturn in the global automobiles & auto parts sector at the start of the second half of 2019. Output, new orders and employment all contracted at the fastest rates since the global series began in late-2009. Moreover, indices for new export orders and purchasing activity also hit record lows in July. Overall growth of consumer goods output – also including beverages & food and household & personal use products – was the weakest in over three years in July.

image

Other areas of global manufacturing remained weak in July. Industrial goods, metals & mining, forestry & paper products and technology equipment all recorded further declines in output, and all except the latter posted lower new orders.

Finance-related sectors performed comparatively well in July, occupying three of the top five spots in the growth table, joined by pharmaceuticals & biotechnology and tourism & recreation. The exception was real estate, which posted only a marginal rise in business activity.

image

In fact, the whole goods sector is in recession. German industrial production sank 5.2% YoY in June. The weakness has spread to the point where non-auto IP is now falling apart.

imageSource: Goldman Sachs (via The Daily Shot)

And don’t think the U.S. goods sector is spared:

  • The July jobs report showed average weekly hours declining in 7 out of 13 industries. (The Daily Shot)
image
EARNINGS WATCH

We have 426 reports in (Thursday night), a slipping 73% beat rate, a +5.5% surprise factor and a blended growth rate of +2.7%, up from +0.3% on July 1. The Goods sectors (56% of the Index) are not performing well:

image

Q3’19 estimates are now –1.1%, down from +0.8% on July 1. Q4: +5.5% vs +7.2%.

Trailing EPS are now $164.26. At 2888, the Rule of 20 P/E is 19.7.

image
TECHNICALS WATCH

The next several charts are from CMG Wealth updated at the yesterday’s close, except where otherwise noted:

  • 13/34–Week EMA Trend Chart
  • Volume Demand vs. Volume Supply


Source: Ned Davis Research

  • But Lowry’s Research’s own analysis of supply/demand suggests caution:

image
  • Lowry’s adds that recent market actions have not been supported by strong demand/volume.
  • S&P 500 Index 200-day Moving Average Trend

a sell signal occurs when the 200-day MA price line drops from a high point by 0.5% or more. A buy signal occurs when the 200-day MA price line rises from a low point by 0.5% or more.

The 200dma is still rising. The same is observed for the S&P 500 Equal Weight Index, the NDX and NDXE, the NYSE and the W5000. But definitely not for any of the smaller cap indices which are still falling.

spy

  • S&P 500 Index 50-day vs. 200-day Moving Average Cross

Sell signals occur when the 50-day shorter-term moving average trend line drops below the longer-term 200-day moving average trend line.  This trend-following process is also in a buy signal.

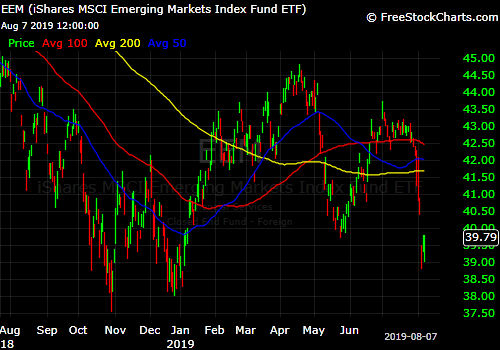
Emerging-Market Stocks Correct Sharply as Trade Battle Flares Investors are fleeing emerging-market stocks and currencies, fearful that an escalating trade war between the U.S. and China will weigh on global growth.

(…) The sudden flight from the boom-and-bust asset class illustrates how drastically investor views shifted as the conflict between Washington and Beijing intensified in recent days. Many now believe the trade battle will likely weigh on global growth for the long term, undercutting the case for owning assets of emerging-market countries, particularly those with deep economic and trade links to China. (…)

eem
Devil Rosy Bond Ratings, a Financial Crisis Driver, Are Back

(…) In the hottest parts of the booming bond market, S&P and its competitors are giving increasingly optimistic ratings as they fight for market share. All six main ratings firms have since 2012 changed some criteria for judging the riskiness of bonds in ways that were followed by jumps in market share, at least temporarily, a Wall Street Journal examination found. These firms compete with one another to rate the debt of borrowers, who pay for the ratings and have an incentive to pick rosier ones. (…)

The Journal’s analysis suggests a key regulatory remedy to improve rating quality—promoting competition—has backfired. The challengers tended to rate bonds higher than the major firms. Across most structured-finance segments, DBRS, Kroll and Morningstar were more likely to give higher grades than Moody’s, S&P and Fitch on the same bonds. Sometimes one firm called a security junk and another gave a triple-A rating deeming it supersafe. (…)