The enemy of knowledge is not ignorance, it’s the illusion of knowledge (Stephen Hawking)

It ain’t what you don’t know that gets you into trouble. It’s what you know for sure that just ain’t so (Mark Twain)

Invest with smart knowledge and objective odds

THE DAILY EDGE (1 Octobre 2018): PMIs

IHS MARKIT US MANUFACTURING PMI Output and new order growth gains momentum in September

September data indicated a strong improvement in operating conditions across the U.S. manufacturing sector. The overall performance was driven by sharper rises in output and new orders, though new business from abroad continued to expand at only a marginal pace. A faster increase in new orders contributed to greater capacity pressures, with backlogs accumulating at the joint-fastest rate since September 2015.

Meanwhile, input prices continued to increase sharply. Components shortages and increased demand for inputs reportedly pushed purchase costs higher. Firms were able to partly pass greater costs onto clients through a solid rise in charges.

The seasonally adjusted IHS Markit final U.S. Manufacturing Purchasing Managers’ Index™ (PMI™) registered 55.6 in September, up from 54.7 in August. The headline figure rose to a four-month high and was well above the series trend. Although the average for the third quarter was strong overall, it signalled the softest expansion since the fourth quarter of 2017.

image

Production across the goods-producing sector rose at an accelerated and sharp rate in September. The upturn was the fastest since May and was attributed to a sustained rise in new business and more favourable demand conditions. New orders received increased markedly, with the rate of expansion quickening to reach a four-month high. Panellists stated that stronger client demand and increased marketing activity drove the rise in order book volumes. New export orders, however, rose marginally as firms noted concerns surrounding the effect of tariffs on foreign demand.

Reflective of a sharp increase in overall new orders, the rate of backlog accumulation accelerated. Moreover, September data signalled the joint-quickest rise in outstanding business in three years. As a result, employment continued to expand, albeit at the softest pace for 13 months. Growth of purchasing activity accelerated amid the faster expansion of new orders. Input buying rose at the quickest rate since April and pre-production inventories increased at the strongest pace since December 2016.

On the price front, cost burdens continued to rise markedly. The rate of input price inflation matched that seen in August, with panellists commonly attributing the increase to tariffs and greater demand for inputs. Firms were able to partly pass higher costs on to clients, with charges increasing solidly. That said, the rate of inflation dipped to a nine-month low, amid reports that some companies were reluctant to raise factory gate prices.

Manufacturers exhibited ongoing confidence towards the outlook for output, with optimists continuing to exceed pessimists. Expected growth was generally linked to new product development and forecasts of firmer demand conditions. However, the overall degree of optimism was the lowest recorded for a year.

The September PMI®registered 59.8 percent, a decrease of 1.5 percentage points from the August reading of 61.3 percent. (…)

image

WHAT RESPONDENTS ARE SAYING (My emphasis)
  • “The market is in a state of chaos with the latest round of tariffs. As an electronics original equipment manufacturer, our component prices have been impacted almost across the board. The tariffs have caused a mass rush to buy up inventories of affected products in order to minimize the long-term financial impact. This, in turn, is causing market constraints, which further drive up the cost and increase lead times.” (Computer & Electronic Products)
  • Tariffs starting to take a bite out of profitability.” (Chemical Products)
  • “Business is strong and relatively stable. Tariffs are putting pressure on Chinese imports. Labor rates are increasing as it is very difficult to find help.” (Furniture & Related Products)
  • “The economy’s strength is holding [and] outlook for the industry is positive, although continuing margin compression in consumer packaged goods is restricting general growth momentum from the greater economy.” (Food, Beverage & Tobacco Products)
  • “Still extremely strong through November; starting to see a decline for steel prices for December.” (Fabricated Metal Products)
  • “General available capacity at suppliers continues to decrease, creating supply issues.” (Machinery)
  • “Tariffs are creating a drag on some of our export opportunities.” (Plastics & Rubber Products)
  • “Sourcing hourly workers for remote locations continues to be a challenge for both full-time and part-time opportunities. Have implemented a wide variety of recruiting techniques and suppliers to aid us in sourcing this hard-to-find talent.” (Paper Products)
  • “Orders are coming in, but from a limited number of customers. The future looks very promising.” (Primary Metals)
  • “Suppliers are impacted by China tariffs, [which is] delaying or cancelling manufacturing transfer projects.” (Miscellaneous Manufacturing)
IHS Markit Eurozone Manufacturing PMI® Slowest growth of manufacturing sector for two years

September’s survey of eurozone manufacturers indicated a further improvement in operating conditions, extending the current period of expansion to 63 months. Growth was the weakest since September 2016, however, in line with the downward trend seen since the start of the year. This was reflected by the IHS Markit Eurozone Manufacturing PMI, which slipped to 53.2, broadly unchanged on the earlier flash reading of 53.3 and down from August’s 54.6.

image

imageThe slowdown was broad-based, with only the Netherlands (three-month high) recording an improvement in its PMI when compared to August. Of the four largest eurozone economies, Germany remained the best-performing, but growth here slid to its lowest in over two years. Similar trends were seen in Spain and Italy, with the latter registering a stagnation and the worst performance within the single currency area. France saw a solid expansion, but nonetheless the weakest in three months.

The general slowdown in the manufacturing sector was again closely linked to a weakening trade cycle. Eurozone new export orders were little-changed during September, rising only slightly and at the weakest rate in the current 63-month sequence of growth. Whilst the Netherlands, Ireland and Greece all continued to record notable increases in exports, outright falls were seen in France and Germany.

The impact of the slowdown in exports naturally spilled over to overall order books in September, with the latest data showing the weakest gain in total new work for 25 months. Eurozone manufacturers subsequently suffered a similar slowdown in output expansion. Output rose to the weakest degree since May 2016, although growth remained a little firmer than the rise in new work. This allowed manufacturers to reduce their backlogs of work marginally for the first time in nearly three-and-a-half years.

Labour market conditions remained nonetheless positive during September. Growth in employment was again solid, albeit the weakest in over a year-and- a-half. Manufacturing job gains were again recorded across the eurozone, with especially marked growth seen in Germany, Ireland, the Netherlands and Austria. In contrast, relatively modest gains were seen in France, Italy and Spain.

Latest prices data showed that cost inflation was again elevated as the price of steel and oil-related goods remained high and supply-side shortages persisted. However, with evidence that some of these pressures had abated a little, input price inflation eased in September to the lowest in 13 months.

In contrast, manufacturers were able to raise output charges at a stronger rate, with inflation reaching a three-month high. Pricing power was especially strong in the Netherlands and Germany.

Finally, business sentiment weakened to a 35-month low in September. Geopolitical worries and concerns over global trade protectionism measures were key factors behind the deterioration in confidence.

Caixin Purchasing Managers’ PMI Operating conditions stagnate in September

Chinese manufacturers signalled stagnant operating conditions at the end of the third quarter, following improvements in the prior 15 months. Production growth eased to a marginal pace, while total new work was broadly unchanged from the previous month. New export business fell at the quickest rate since early 2016. At the same time, companies continued to reduce their headcounts, while subdued demand conditions led to more cautious approaches to inventories and buying activity.

Looking ahead, firms expressed the weakest level of optimism towards the 12-month business outlook in 2018 so far. Concerns continued to mount about the ongoing global trade frictions as well as the near-term impact of strict environmental policies.

The headline seasonally adjusted Purchasing Managers’ Index™ (PMI™) fell from 50.6 in August to the neutral level of 50.0 in September. This signalled no change in the health of China’s manufacturing sector following improvements in each of the prior 15 months.

image

Although Chinese manufacturing output continued to rise in September, the latest expansion was only marginal and the weakest recorded for nearly a year. The slowdown in growth of production coincided with a broad stagnation in total new work received by goods producers. According to panellists, subdued market demand and reduced export sales had weighed on overall new business. Moreover, new export orders declined at the quickest rate since February 2016 amid a number of reports that the China-US trade war and subsequent tariffs had impacted foreign sales.

Companies reported a further fall in staff numbers, partly due to company restructuring plans and the non-replacement of voluntary leavers. Notably, the rate of job cuts was the quickest for 14 months. Concurrently, backlogs of work rose further, albeit at the weakest pace for a year.

Purchasing activity was left unchanged in September, which contrasted with greater input buying in the previous 15 months. Muted demand conditions meanwhile led firms to become more cautious towards their inventory holdings, with stocks of inputs rising only fractionally while inventories of finished goods fell for the fifth month in a row.

Suppliers’ delivery times continued to lengthen amid reports of strict environmental policies and low stock levels among vendors. That said, the rate at which supplier performance deteriorated was the weakest for 16 months.

Average purchasing costs rose solidly in September, and was generally linked to supplier price hikes for raw materials and the impact of stricter environmental policies. However, efforts to boost competitiveness meant that selling prices rose only modestly.

  • Official manufacturing PMI vs Markit:

Japan manufacturing sector continues to expand at robust pace

Japan’s manufacturing economy continued along an expansionary path in September, with output, demand and employment all rising. That said, production growth dipped to a 14-month low, and although total new business growth accelerated, manufacturers faced a further month of declining export sales. The slower rise in output contributed to a stronger accumulation in backlogs of work, while slower input delivery times also weighed on operating capacities. Looking ahead, firms were upbeat, but the level of positive sentiment was the weakest for nearly two years.

The headline Nikkei Japan Manufacturing Purchasing Managers’ IndexTM (PMI)® concluded the third quarter by posting 52.5 in September. This was unchanged from August and signalled a relatively robust rate of improvement in the health of the goods-producing sector. That said, the average PMI reading for Q3 (52.4) was notably weaker than those seen during the first and second quarters of 2018.

image

Supporting the business environment in September was a further rise in sales. Indeed, new orders have now increased in each month for the past two years. That said, the pace of expansion remained weaker than the average seen across the current upturn. Meanwhile, manufacturers observed a further monthly decline in new export business. Demand conditions were robust enough to warrant greater production levels, but the rate of increase in output slowed to a 14-month low and was only modest overall.

Despite softer production growth, anecdotal evidence suggested that firms are anticipating order book volumes to expand further. As such, manufacturing sector employment rose during September as firms sought to boost capacities. The rate of job creation accelerated, but was among the weakest seen during the current 25-month stretch of recruitment. Input purchases were also raised by Japanese manufacturers in September, albeit to the weakest extent since November 2016.

Continued growth of input buying, in conjunction with raw material shortages, reportedly weighed on the ability of vendors to fulfil deliveries in a timely manner. Average lead times lengthened to a historically sharp extent in September. Panellists also indicated that deteriorating vendor performance had contributed to a rise in outstanding work. The rate of backlog accumulation quickened to a three-month high during the latest survey period.

Increased raw material prices, particularly for oil and metals, yen weakness as well as higher labour and shipping expenses resulted in sharp cost inflation in September. Output prices were increased as part of efforts to offset greater cost burdens. Although the rate of inflation eased, it remained close to August’s near-decade high.

Consumers Pulled Back Slightly on Spending in August U.S. consumer spending cooled slightly in August, but consumer sentiment is sky high heading into the holiday season.

Household spending—what Americans paid for all goods and services, such as groceries and health care—rose 0.3% in August from the prior month, the Commerce Department said Friday.

Consumer spending powers the U.S. economy, and August’s gain was the smallest since February, marking a modest pullback from a 0.4% increase in both June and July, and 0.5% rises in April and May. (…)

The saving rate in August was 6.6%, the same as in July but down from 7.4% six months ago.

Americans’ spending matched the pace of their income gains, which also rose 0.3% in August from the prior month, the government said. (…)

The price index for personal-consumption expenditures, the Federal Reserve’s preferred inflation measure, was flat in August from July, excluding volatile food and energy costs. From a year earlier, it increased 2%, hitting the Fed’s target for the fourth month in a row. (…)

From my lens, the important stats in the below Haver Analytics table are that Wages and Salaries are rising at an annualized rate nearing 5.0% and that core PCE inflation, +2.0% YoY in August, has been rising at a 1.2% annualized rate in the last 3 months.

image

Similar trend in Europe:

image

Durable Goods Orders Jump in August But It’s Almost All Due to Aircraft

(…) Overall trends in durable goods still look quite good. This month we set aside the strength in aircraft and when we do that we see a relatively listless month but that still comes amid very solid trends. If there is slowing in durable goods, it is quite new and ‘too new’ to be identified as such. The sector looks very solid with broad-based gains and only a few blemishes in its details. July was an uneven month for machinery investment with four of eight sectors showing declines and two of four in electrical equipment categories exhibiting monthly drops. But the up-to-date August aggregate report is very solid and with no hint of an inventory cycle. The sector appears to remain on sound footing.

Hmmm…note the slowdown in core new orders which may be due to all the uncertainties stemming from unresolved trade issues:

image

U.S. Pending Home Sales Fall Again

The National Association of Realtors (NAR) reported that pending sales of existing homes fell again in August, dropping 1.8% after July’s 0.8% decrease, revised from -0.7%. This latest move was the fourth decline in the last five months, taking the August sales index level down to 104.2 (2001=100) compared to 106.1 in July and off 2.3% y/y. (…)

large image

The U.S. housing market, already struggling with tight inventory and rising building costs, faces a fresh headwind as 30-year mortgage rates rise close to the 5 percent threshold for the first time in years. (…)

Mortgage rates have surged to 4.97 percent from 4.23 percent in January, according to the Mortgage Bankers Association. Including fees, most 30-year mortgage costs have reached 5 percent or higher. (…)

Cars, Cows and a Crisis Averted: Highlights of a New Nafta Deal

(…) The deal struck Sunday offers a measure of protection for both Canada and Mexico, ensuring each country won’t be affected by any auto tariffs unless exports top 2.6 million units annually. For each, that represents their current exports plus growth of at least 40 percent — enough to mean that if the tariffs are leveled against the rest of the world, they likely wouldn’t hit Canada and Mexico for a couple of years. There’s no guarantee that the Trump administration will impose the tariffs at all, or keep them in place that long.

As expected, the deal calls for cars to have 75 percent of their content originate in the U.S. and Mexico, up from the current 62.5 percent, and for 40 percent of a car to come from workers whose pay averages more than $16 per hour. The rules are a central part of the U.S. strategy to rebalance manufacturing to benefit American workers.

The deal doesn’t resolve the dispute over U.S. tariffs on steel and aluminum imports from Canada and Mexico — or the retaliatory tariffs that each country placed on them. But going forward, it did give a guarantee that no tariff applied under the same U.S. law could be imposed against Canada or Mexico for at least 60 days. During that period, “the United States and Canada shall seek to negotiate an appropriate outcome based on industry dynamics and historical trading patterns,” the countries agreed.

Nafta had three kinds of dispute settlement systems. The new deal will see two remain basically unchanged, but renamed, according to senior White House officials. State-to-state dispute settlement — formerly in Chapter 20 — is being kept. It has many critics, particularly in the labor community, because panels often get blocked and disputes linger for years.

The old Nafta’s so-called Chapter 19 dispute-settlement mechanism — which hears bi-national anti-dumping and countervailing duties cases — remains untouched in the new agreement, the officials said. Canada dug in to save those.

Investor-state dispute settlement, formerly in Chapter 11, will be phased out between the U.S. and Canada but remain in place for certain key sectors — such as oil and gas, infrastructure and telecommunications — between the U.S. and Mexico, according to the White House officials.

As part of the deal, the U.S. is getting expanded access to Canada’s protected dairy market, long a thorn in the side of trade talks. Canada will eliminate its so-called Class 7 milk pricing system, a senior U.S. administration official told reporters. New measures will prevent Canada’s system from spilling outside its borders, while market access for the U.S. will exceed Canada’s concessions in Trans-Pacific Partnership talks, the U.S. official said. Canada gave up 3.3 percent of its market in those TPP talks, but the U.S. has since quit the deal.

In the end, the countries agreed to a 16-year term for the deal, with a review to identify and fix problems and a chance of a deal extension after six years. (…)

  • Solid Canadian economic growth seen bolstering case for October rate hike

Statistics Canada reported that real gross domestic product grew 0.2 per cent month over month on a seasonally adjusted basis, up from a flat reading in June. The key driver was a 1.2-per-cent jump in the manufacturing sector, its strongest growth in eight months. (…)

However, economists noted that the July GDP upturn was not widely distributed across the economy; only 12 of 20 segments posted growth. (…)

Economists suggested that the July GDP result puts the economy on track for something close to 2-per-cent annualized growth in the third quarter. While that would represent a significant slowdown from the second quarter’s 2.9-per-cent pace, it would be well above the 1.5 per cent that the Bank of Canada forecast in its most recent quarterly economic projections, released in mid-July. (…)

In a speech on Thursday night, Bank of Canada Governor Stephen Poloz reiterated that the bank believes further rate increases “will be warranted to achieve our inflation target,” while effectively dismissing the notion that the deep uncertainties surrounding the NAFTA talks should justify delaying rate hikes.

“Being uncertain about the future does not justify inaction. It does not mean keeping interest rates on hold until inflation momentum begins to build,” Mr. Poloz told an audience in Moncton.

  • CANADA MANUFACTURING PMI Weakest improvement in manufacturing
    business conditions in 2018 so far

(…) New work expanded at the least marked pace for 11 months. Manufacturers noted that global trade frictions
continued to hold back export sales growth. (…)

image

JPMorgan Sees All-Out U.S.-China Tariffs, Lowers Yuan Call
China to Further Cut Taxes and Red Tape, Li Says

Chinese Premier Li Keqiang vowed to further cut taxes, administrative fees and red tape in an effort to support the real economy, according to a government statement on Friday.

Li also called for speedy efforts to build a “market-oriented, legalized and internationalized” business environment. (…)

The remarks followed president Xi Jinping’s pledge on Friday that the nation will “unswervingly” encourage, support and protect development of the private economy, while at the same time encouraging SOEs to be “stronger, better and bigger”.

Separately, Finance Minister Liu Kun said total tax reductions scheduled for this year will exceed 1.3 trillion yuan ($189 billion), higher than the 1.1 trillion yuan target set at the beginning of the year, in order to fend off pressure from escalating trade tension with the U.S., the state-owned China Daily newspaper reported on Friday.

Mattis Trip to China Canceled Security talks between U.S. Secretary of Defense Jim Mattis and his Chinese counterpart have been canceled amid mounting friction between Beijing and Washington.
U.S. Ship Sails Near Disputed Islands, Challenging China An American warship patrolled near at least two Chinese-held outposts in the disputed Spratly island chain in the South China Sea, challenging Beijing’s maritime claims amid growing tensions between the two countries. 166
Emerging Markets Face Expensive Oil, Weak Currencies Emerging markets’ currencies have been hit by a mix of global trade tensions, a strong dollar and rising U.S. interest rates, and are facing another threat: $80 oil.

(…) The price of Brent crude, the international oil price gauge, has risen by 22% this year. But the cost has doubled if you’re buying in Turkish lira. It is up 39% in Indian rupees and 34% in Indonesian rupiah. (…)

India, the world’s third-biggest oil importer, is weighing temporarily limiting oil imports, while Brazil and Malaysia have introduced fuel subsidies. On Thursday, central banks in Indonesia and the Philippines raised interest rates to tame rising inflation.

In South Africa, where fuel prices are at a record high, the central bank said in a statement last week that “the impact of elevated oil prices and a weaker exchange rate on domestic fuel costs is increasingly evident.” (…)

EARNINGS WATCH

Analysts are busy revising their 2018 estimates and they are increasingly using the red pencil, particularly for smaller companies. Last week, 53% of revisions on S&P 500 companies were downward.

image

Taking all companies, TR shows that 56% of revisions were negative in the last 2 weeks…

image

…which means that 66% of all non-S&P 500 companies had downward revisions in the last 2 weeks (67% last week).

As pointed out in the last 2 weeks, Lowry’s Research analysis shows that small cap technicals have been deteriorating lately. Lowry’s said Friday that “thus far, small cap weakness does not appear to have migrated into mid caps and has not affected the OCO Adv-Dec Line, which reached a new all time high on Sept. 20th 2018, confirming the recent new all time high in the S&P 500. That said, weakness among small caps appears to be expanding, through a rise in the % of small caps down 20% or more from their 52-week highs and small caps at or within 2% or their 52-week highs, a % that has fallen sharply over the past few weeks.”

Chaikin Analytics’ work also confirms the trends: the larger the caps, the better are their Chaikin rating. Marc Chaikin adds

(…) large cap stocks have performed well over the past month while small and mid-cap stocks have been down. This is particularly impressive given the escalation of the tariff wars and rhetoric and the strength of the U.S. Dollar.

The two biggest U.S. trading banks, JPMorgan Chase JPM -1.47% & Co. and Citigroup Inc.,C -1.66% expect to report lukewarm results in their markets businesses for the third quarter. JPMorgan said this summer it anticipated a small decline from the year-ago period, while Citigroup said it might record a small uptick. (…)

Susan Roth Katzke, an analyst at Credit Suisse Group AG, forecasts that fixed-income trading will log a year-over-year revenue decline of around 5% to 10% for the third quarter, even as equities revenue rises by as much as 5%.

Wall Street’s fixed-income, currencies, and commodities businesses are still a shadow of what they were. In 2012, the dozen biggest banks globally generated some $100 billion in revenue from those desks, versus less than $70 billion last year, according to industry data tracker Coalition. (…)

Druckenmiller Sees ‘Massive’ Debt Fueling Next Financial Crisis

Billionaire investor Stan Druckenmiller says the next financial crisis will be worse than the last due to soaring levels of debt.

“We have this massive debt problem,” Druckenmiller said an interview with Kiril Sokoloff, chairman of 13D Global Strategy & Research. “We tripled down on what caused the crisis. And we tripled down on it globally.”

But Steve Blumenthal provides this NDR chart that suggests that credit conditions are not unfavorable just yet:

Red Ink Floods IPO Market Money-losing companies are going public at a record rate as investors hunger for new issues

More than 80% of U.S.-listed initial public offerings in this year’s first three quarters involve companies that lost money in the 12 months leading up to their debut, according to data compiled by University of Florida finance professor Jay Ritter. That is the highest proportion on record, according to Mr. Ritter, an IPO expert whose data goes back to 1980.

Investors’ tolerance for red ink has been rewarded, with stocks of money-losing companies listing in the U.S. this year soaring 36% on average from their IPO price through Thursday. That is better than the 32% return for IPO stocks with earnings and a 9% gain for the S&P 500.

The euphoria has powered a surge in new listings. More than 180 companies raised over $50 billion in IPOs in the U.S. in the first three quarters, putting 2018 on track to be the busiest year for new issuance by both measures since 2014, according to Dealogic. (…)

The prior high-water mark was 2000, when 81% of companies going public were unprofitable, compared with 83% so far this year, according to Mr. Ritter’s data. Unlike then, it is more than just money-losing technology companies getting a warm welcome today. A surge in biotech offerings has pushed up the current tally of newly traded companies without earnings. (…)

In 2000, just 14% of tech companies listing shares in the U.S. were profitable, compared with 19% so far this year, according to Mr. Ritter’s data. (…)

FYI, the correlation between the S&P 500 Index and its Index companies EPS is 97% over the last 60 years.

  • What to Watch: Zombie Companies

This is from Joe Zidle, investment strategist at Blackstone:

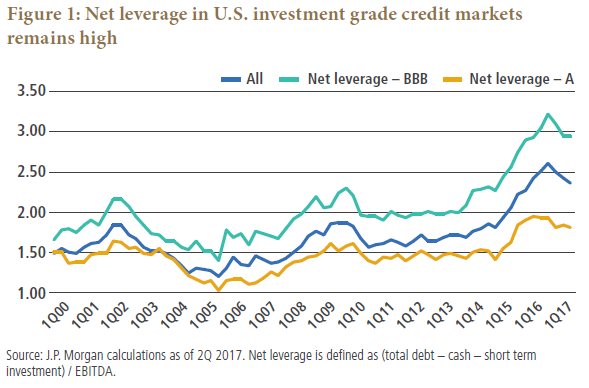
The number of companies that don’t generate enough earnings before interest and taxes (EBIT) to cover their debt service is growing. According to the most recent data available from the BIS, the number of “zombie companies” is now 12% of all companies across developed markets, up from approximately 8% in 2008.4 As debt service cost increases and issuer credit quality declines, the number of these firms is likely to grow.

The growth of “zombies” is not yet a problem, and an accelerating economy could enable these companies to avoid adverse credit events for years; some companies will recover. But the bond bull market is over, and rates and inflationary pressures could push yields higher, which is a fundamentally different environment than the last decade.

THE DAILY EDGE (27 September 2018):

Fed Raises Interest Rates, Signals One More Increase This Year Benchmark federal-funds rate increased to a range between 2% and 2.25%

(…) Projections released after Wednesday’s meeting show that most Fed officials expect they will raise rates by one percentage point through next year, and most officials penciled in at least one more quarter-point increase for 2020.

That would leave the benchmark rate slightly higher than 3.25%. (…)

Economic projections released after the meeting envision an unusually favorable set of conditions, in which the unemployment rate holds below 4% over the next three years but inflation never rises far beyond the Fed’s 2% target. (…)

The risk that inflation climbs higher and faster than anticipated could require the Fed to raise rates “a little bit quicker,” Mr. Powell said. He quickly added, “We don’t see that. We really don’t see that.” (…)

“If this, perhaps inadvertently, goes to a place where we have widespread tariffs that remain in place for a long time, a more protectionist world, that’s going to be bad for the United States’s economy,” said Mr. Powell. (…)

Given their large share of global output, “the performance of the emerging market economies really matters to us in carrying out our domestic mandate,” said Mr. Powell.


Source: Natixis (via The Daily Shot)

Here’s core PCE inflation since 1994:

image

BTW:

U.S. New Home Sales Increase As Prices Decline

New single-family home sales increased 3.5% (12.7% y/y) during August to 629,000 (SAAR) from 608,000 in July, revised from 627,000. June’s sales level also was revised lower to 618,000 from 638,000. Sales during August were 11.7% below the high of 712,000 reached in November 2017.

The median price of a new home declined 2.4% to $320,200 (+1.9% y/y) from a little-revised $328,100. The average price of a new home eased slightly to $388,400 (+5.2% y/y). (…)

large image

Global Trade Growth Is Slowly Losing Steam

(…) In a report on Thursday, DHL said its trade barometer weakened in September, dropping to the lowest since 2016 and indicating a slower pace of growth in the months ahead. It noted “rising political tensions.” (…)

Source: Capital Economics (via The Daily Shot)

5f162913-6d7c-406e-91c3-3a51a9094225
An Economic Cold War is Looming Some observers suspect that Washington’s ultimate goal is to permanently disentangle America’s economy from China’s

(…) The situation has no precedent in post-war history. The U.S. had few economic ties to the Soviet Union, so their strategic rivalry seldom spilled over to trade. America’s trade disputes with Japan carried no security fallout because the two are military allies. By contrast, Washington worries that China’s use of cybertheft, trade barriers and forced technology transfer not only confer economic advantage but make it a more formidable geostrategic adversary. (…)

Tariffs and other penalties, such as forthcoming restrictions on the export of key technologies, weaken China’s appeal as a destination for foreign investment and start to unravel the supply chains that tie the U.S. to China. The longer tariffs remain in place, the more multinationals that want to sell to the U.S. will seek alternatives to China to source production. Taiwan and Thailand are already marketing themselves as alternatives.

Yet, moving a supply chain out of China is harder than it sounds. Mr. Kroeber notes in an interview that China doesn’t offer just low labor costs, it also has well-developed infrastructure and logistics, skilled labor such as engineers, and access to China’s own huge internal market. “That can’t be matched somewhere else.” Multinationals may need two supply chains: one with access to the U.S., and one with access to China. They would then have to decide whether their U.S.-centric or China-centric supply chain serves the rest of the world. (…)

Yet over time, China could overcome those disadvantages. It “has all the necessary prerequisites to make an Asian-based trading bloc work without the U.S.: a large domestic market, political support for open markets and manufacturing expertise,” writes Larry Brainard of TS Lombard, an investment advisory. China already does more trade in manufactured and intermediate goods with the European Union than the U.S., and twice as much with the rest of Asia, he notes. (…)

How China Pries Technology From U.S. Companies Beijing is increasingly leaning on levers to extract intellectual property—sometimes coercively—say U.S. companies. China says it’s payment for market access.

(…) China’s tactics, these interviews and documents show, include pressuring U.S. partners in joint ventures to relinquish technology, using local courts to invalidate American firms’ patents and licensing arrangements, dispatching antitrust and other investigators, and filling regulatory panels with experts who may pass trade secrets to Chinese competitors. (…)

At a January U.S. Chamber of Commerce dinner in Washington, executives pressed U.S. Ambassador to China Terry Branstad not to hit Beijing too hard on technology issues,according to dinner attendees. China has many ways to get even, warned Christopher Padilla, a vice president of International Business Machines Corp. , which licenses technology to Chinese firms. (…)

About one in five members of the American Chamber of Commerce in Shanghai say they have been pressured to transfer technology, according to a survey conducted in the spring. Of those companies, 44% in aerospace and 41% in chemicals report “notable pressure.” China considers both industries strategically important. (…)

Advanced Micro Devices Inc., a Silicon Valley chip company, entered a joint venture in 2016 with Chinese private and state-owned entities, including the government’s Chinese Academy of Sciences. AMD licenses microprocessor technology to the venture and is developing new computer chips with it.

AMD has received about $140 million in licensing through 2017, enough to help boost it into the black last year for the first time since 2011. “We created a joint venture that was very much a win-win,” AMD Chief Executive Lisa Su said at a 2016 conference. An AMD spokesman says the joint venture is “part of our strategy to create a complementary product offering.” (…)

Regulatory panels, packed with industry experts, must approve many chemicals before they can be produced in China and require detailed information on formulas and production processes, say U.S. trade groups and chemical firms. “Enough information to duplicate the product,” is how the American Chemical Council trade group put it in a filing to the U.S. government. (…)

China business schools evolving rapidly The shift from sending students overseas to offering MBAs at home is speeding up
Trump Accuses China of Trying to Interfere in U.S. Elections
White House to Raise Pressure on Canada With Mexico-Only Nafta Draft
Trump Seeks International Support on Iran, but Finds Little

Japan dodges U.S. auto tariffs, for now, as Trump and Abe agree on trade talks

(…) Of the 3.2 million vehicles sold this year in Japan, only 0.3 percent were American brands, according to data from Japan’s auto industry associations. In contrast, Japanese brands have a market share of about 40 percent in the U.S. (…)

While the U.S. currently has a 2.5 percent import tariff on passenger cars and 25 percent on trucks, Japan removed its last levies on auto imports almost four decades ago. Japan has long argued the reason for low presence of U.S. cars has nothing to do with tariffs: Japanese consumers generally perceive U.S. cars as bulky and inefficient — minicars and other locally made fuel-saving models dominate the country’s vehicle sales. (…)

Ford CEO says Trump’s metal tariffs cost automaker $1-billion

Steel and aluminum tariffs imposed by the Trump administration have cost Ford Motor Co about $1-billion in profits, its chief executive officer said on Wednesday, while Honda Motor Co said higher steel prices have brought “hundreds of millions of dollars” in new costs.

“From Ford’s perspective the metals tariffs took about $1-billion in profit from us,” CEO James Hackett said at a Bloomberg conference in New York, “The irony of which is we source most of that in the U.S. today anyway. If it goes on any longer, it will do more damage.” (…)

Honda has not boosted U.S. vehicle prices as a result of the higher costs but the issue is “certainly part of our thinking as we go forward,” Schostek told reporters after the hearing. (…)

IHS Markit estimates that full implementation of the 232 tariffs would add between $1,800 and $5,700 to a new vehicle’s price tag and cut new auto sales by around 2.2 million units in 2020 as well as slice total sales to as little as 14.5 million units from expectations of 17 million vehicles this year.

The new tariffs would also cost around 300,000 in auto-related jobs in factories and dealerships across the country, and slash U.S. economic growth by 1.1 percentage points to 2.2 per cent, IHS said. (…)

Oil Gains After U.S. Holds Fire on Opening Reserves Oil prices climbed, maintaining four-year highs, after the U.S. indicated it wouldn’t open up its strategic petroleum reserves to flood the market and put a cap on prices.
Large Investors Dive Into Risky Loan Securities Canada’s government pension plan is investing $285 million in the riskiest securities of collateralized loan obligations, as large institutions start funneling more cash into a market that has received record sums in 2018.

(…) CLOs raise money by issuing bonds and equity to outside investors and use the cash to buy bundles of below-investment-grade, or “leveraged,” corporate loans. The money coming in from the bundled loans pays investors’ interest and principal on the CLO bonds, in a process similar to mortgage-backed securitizations. Equity holders typically must cover loan losses above a certain threshold—an arrangement that accounts both for CLO equity’s risk and for its higher expected returns.

CLO equity has historically been purchased by hedge funds or private-equity firms. Purchases by large institutions such as CPPIB, with $275 billion in assets, could give CLO managers significantly more firepower to launch new deals, further boosting demand for leveraged loans and potentially adding to risk in junk debt markets. Managers can borrow about $9 million of bonds for each $1 million of equity raised to buy up leveraged loan pools. (…)

Purchases by CLOs helped push the leveraged-loan market to $1.22 trillion in June, exceeding the size of the junk bond market for the first time in 10 years.

The global CLO market has grown 25% in the past two years to about $700 billion outstanding, according to data from JPMorgan Chase & Co. Annual returns from the equity have averaged about 18% since 2004, according to research from JPMorgan, but some analysts caution that if leveraged loan defaults rise, certain CLOs will only have enough cash to keep paying their bonds, leaving equity holders with losses.

Institutional investors routinely purchased CLO bonds in recent years because they pay floating-rate interest—an advantage when interest rates are rising—and have outperformed more conventional corporate debt. (…)

Pointing up Howard Marks’ latest letter is a must read.

EARNINGS WATCH

The earnings season officially begins Oct. 12 but 12 S&P 500 companies have already reported and Zacks says that while “it is premature to draw any conclusions from the results thus far, but they are nevertheless on the weaker side relative to what we had seen from the same group of 12 index members in other recent periods.”

America’s High-Stake Midterm Elections

The stakes in the upcoming congressional midterm elections (November 6) are particularly high. The Republicans currently control both the House and the Senate. Not only would the loss of one or both chambers of Congress bring Trump’s agenda to a skidding halt, it could even signal the beginning of impeachment proceedings against him.

The 2018 midterms can also be divided into two separate elections. The Democrats are favoured to regain control of the House on account of Republican vulnerability in numerous suburban areas, whereas the Republicans look set to retain control of the Senate as the outcome there hinges more on rural states where Trump still has strong support. In all, 435 seats in the House of Representatives and 35 of the 100 seats in the Senate will be up for grabs in November 2018.

Historically, the incumbent president’s party has not fared well in midterm elections. It has lost seats in the House in 9 of the last 10 elections held halfway through the president’s first term. In the Senate, it has managed somewhat better. The sitting president’s party has given up seats in only 6 of those 10 elections. Historically, supporters of the party not in power have tended to be more motivated to show up at the polls. (…)

Historically, the relatively low voter turnout in the midterms has favoured the Republicans. This is because younger people, who make up a large part of the Democratic base, tend to vote at lower levels than do older white voters, who tend to favour the Republicans. In 2014, voter participation in the midterms was 37% compared with 55% in the last presidential election.

The Democrats are hoping that disapproval of President Trump will motivate millennial voters and other Democratic supporters to show up at the polls in greater numbers. So far, based on the total number of votes cast in the primaries (where candidates are selected for the general election), the Democratic base appears far more enthusiastic about voting than their Republican counterparts do. (…)

However, the apparent greater voter enthusiasm of the Democratic base is at least partially counteracted by two factors working in the Republicans’ favour. 1) The tendency for Democrats to win with overwhelming margins in heavily Democratic urban areas, thus wasting votes; and 2) gerrymandering, which is the process whereby state governors redraw the boundaries of legislative districts to favour their party, essentially by moving likely non-supporters to districts lost in advance. In order to overcome these barriers and have a chance of regaining control of the House of Representatives, Democrats would have to win the congressional popular vote by at least 7 percentage points. As the following chart illustrates, they are currently just above this threshold in the polls. (…) (NBF)

image

Democrats’ enthusiasm to blunt Trump soars for congressional election: Reuters/Ipsos poll

(…) Across almost all demographic groups, more Democrats say they are certain to vote compared to poll results in 2014, the last non-presidential election year.

The Reuters/Ipsos poll has been tracking Americans’ interest in voting since 2010 and the polling on voter enthusiasm is built on data spanning 2014 to 2018, including data not readily available elsewhere. (…)

Even among groups often thought to favor U.S. President Donald Trump, a Republican, like whites without a college degree and avid church goers, those who identify as Democrats are more interested in voting this year, while Republicans are not. (…)

Enthusiasm is everything in the congressional elections, when turnout is typically lower than when the White House is also up for grabs. Only about four in 10 voting-age Americans bother to cast ballots compared to about six in 10 when it is.

When voters in one party are especially determined to be heard in a congressional election, it can swing control of the U.S. House of Representatives and the Senate. (…)

FiveThirtyEight forecasts that Democrats have 80.4% chance to take control of the House. The Senate odds are only 32% in favour of Democrats.