Trump says U.S. may not impose more tariffs on China U.S. President Donald Trump said on Friday that he may not impose more tariffs on Chinese goods after Beijing sent the United States a list of measures it was willing to take to resolve trade tensions, although he added it was unacceptable that some major items were omitted from the list.
(…) Trump added that there were “four or five big things left off†the list of 142 items sent by China.
“They sent a list of things that they’re willing to do, which is a large list, and it’s just not acceptable to me yet.†he said. He did not detail the omitted items.
Trump said, however, he was confident the missing items would be addressed in any deal struck with China.
“I think we’ll probably get them too,†he said.
-
U.S.-China Divisions Exposed After One Phrase ‘Torpedoed’ Pacific Accord For first time, APEC fails to issue a communiqué, as prospects dim for a deal between Beijing and Washington
For the first time in the Asia-Pacific Economic Cooperation summit’s nearly three-decade history, officials of the 21-member Pacific Rim group ended two days of meetings in Port Moresby without issuing a communiqué, with Papua New Guinea’s leader delivering only his summary of failed talks. (…)
The tensions and lack of resolution at APEC herald the difficulty the two sides will have in reaching any trade deal. President Trump and Chinese President Xi Jinping are scheduled to meet in Buenos Aires in less than two weeks during a meeting of the Group of 20 industrial and developing nations. The two sides are aiming for at least a cease-fire in the trade fight that would involve a new set of negotiations tied to a U.S. pledge to hold off on additional tariffs. (…)
“The meeting makes it harder for the two sides to conduct their pre-[G-20] summit talks,†said Eswar Prasad, a China expert at Cornell University. The U.S. “is in no mood to back off from its full set of aggressive demands, while China signaled it is open to negotiation, but not to surrender to all U.S. terms.†(…)
U.S. Industrial Production Rises U.S. industrial output ticked up in October, as increased factory production offset declines in mining and utilities output.
Industrial production, a measure of manufacturing, mining and utility output, rose a seasonally adjusted 0.1% in October from the prior month, the Federal Reserve said Friday. Economists surveyed by The Wall Street Journal had expected a 0.2% gain for October. From a year earlier, industrial production rose 4.1% in October.
Manufacturing production, which accounts for three-quarters of the overall index, continued to grow at a solid pace for the fifth straight month, advancing 0.3% in October from the prior month. Meanwhile, output in the utilities and mining industries fell for the second month in a row in October, declining 0.5% and 0.3%, respectively.
Manufacturing production has been steadily rising at a 4.3% annualized rate since July, up from a very inconsistent 2.6% rate during the first half of 2018.

That said, manufacturing production has not even reached its 2007 peak:

Apple Cuts iPhone Production, Creates Turmoil for Suppliers Lower-than-expected demand for Apple’s new iPhones and the company’s decision to offer more models have created turmoil along its supply chain.
(…) Forecasts have been especially problematic in the case of the iPhone XR. Around late October, Apple slashed its production plan by up to a third of the approximately 70 million units it had asked some suppliers to produce between September and February, people familiar with the matter said.
And in the past week, Apple told several suppliers that it cut its production plan again for the iPhone XR, some of the people said Monday, as Apple battles a maturing smartphone market and stiff competition from Chinese producers. (…)
Supplier frustrations have been compounded by the lack of growth in iPhone unit sales in recent years. Since peaking in fiscal 2015, the number of iPhones sold annually has fallen 6% to 217.7 million units. (…)
Overall revenues rose 49.1% YoY in the third quarter while international revenue grew 112.5%. Xiaomi said the revenue growth was largely driven by sales of more premium-priced smartphones, now nearly a third of Xiaomi’s revenues.
Xiaomi is now the fourth biggest smartphone maker in the world, with its global share of smartphones shipped rising to a company high of 9.7 per cent in the third quarter according to research firm IDC, growth in part buoyed by a continued international expansion in developing Asian economies such as India and Indonesia, as well as European markets like Spain. (FT)
U.S. Household Debt Continues to Climb in 3rd Quarter Household indebtedness continued to climb in the third quarter, with balances continuing to rise for almost all types of borrowing, the Federal Reserve Bank of New York reported.
In the third quarter of this year, total household debt increased for the 17th consecutive quarter to $13.51 trillion, more than 20% above the trough it hit in the second quarter of 2013. (…)
The share of debt considered to be seriously delinquent, meaning payment is at least 90 days late, edged higher for auto loans in the third quarter, to 4.27% from 4.17% in the second quarter. The serious delinquency rate of mortgages improved, dropping to 1.06% from 1.11%.

EARNINGS WATCH
We have 464 reports in, a 78% beat rate and a record +6.5% beat factor. Even revenues are beating handily with a +1.4% beat factor although revenue beats are much more concentrated (Energy and Financials).
- Q3 earnings are now seen exploding 28.1% (24.7% ex-Energy) on a 8.5% revenue growth rate (7.4% ex-E).
- Trailing EPS are now $157.73 or about $160.25 pro forma the tax reform for 12 months.
- Q4 EPS are expected to rise 17.8% (15.0% ex-E), unchanged from one week ago but down from 20.1% on Oct.1.
- Full year 2018 earnings are seen up 24.1% to $162.79, double the forecast at Jan. 1st!
- Earnings growth will obviously slow in 2019: Q1’19 is seen up 7.3% from 8.1% on Oct. 1. Full year 2019: +8.7%, down from 10.2% on Oct. 1.
- There is no noticeable deterioration in corporate pre-announcements so far in Q4:

Analysts revisions remain positive on both S&P 500 companies and smaller caps where upward revisions improved from 43.9% 4 weeks ago to 55.8% in the last 2 weeks:


Refinitiv’s tally of S&P 400 mid-caps as of Nov. 14 shows that 66% of the 360 companies having reported beat expectations with a 3.8% surprise factor. Their blended growth rate for Q3 is now 22.5% in spite of very weak results from consumer-centric companies:

Q4 earnings growth is seen slowing abruptly to 9.8%:

Looking at S&P 600 companies, with 521 reports in, the average beat rate of 61% hides the huge sectorial variations with significant misses in Materials, Health Care, Financials, Consumer Staples and Communication Services:

Small caps will also see their growth slow meaningfully in Q4 with many sectors expected to display pretty poor results:

Compared with S&P 500 companies, small and mid-caps look like roads full of potholes. Beware!

That largely explains why the Russell 2000 Index is 12.4% off its August 31 peak while the S&P 500 Index is down 6.9% from its September 20 peak. In fact, forward P/E ratios have converged recently but I am not sure if that makes small caps relatively more attractive given the above…

…and the below. Interest coverage for the median Russell 2000 company is almost as low as it was at the trough of the previous 3 recessions. Factset calculates that 51.5% of Russell 2000 companies’ debt was at floating rates in September 2018. Hmmm…
The BIS estimates that 12% of OECD companies are “Zombie companies†that don’t generate enough EBIT to cover their debt service, up from 8% in 2008. A majority of those 536 companies are U.S. based. In fact, Bianco Research estimated at the end of 2017 that 14.6% (220 companies) of the S&P 1500 companies were Zombies, nearly triple the number in 2008 nearly 4 times the number in 2000. Last August, David Hay, CIO at Evergreen/Gavekal found that 20% of the Russell 2000 companies can’t cover interest with EBIT. That’s 400 companies.

Last April, in TOPSY CURVY: SMALL IS NOT THAT BEAUTIFUL, I showed this truly scary alligator chart from David Hay, calculating that small cap Alli’s lower jaw below will sink by $5B for every 100 bps increase in interest rates. Assume that the average Russell 2000 company incurred a 4% average interest rate in 2017, a doubling in that number would eat $20B off the $150B in ebitda, a 13% drop before including any revenue impact from a weaker following such rate shock. Recall that tax reform makes interest costs more expensive than before.

TECHNICALS WATCH
I have documented the growing earnings problem among smaller companies since late spring. Their smaller and undiversified businesses make them more vulnerable to rising costs (wages, tariffs, energy) when the Amazons and Walmarts of this world keep selling prices in check. Lower taxes help only to certain extent, especially when profit margins are low. S&P 600 companies profit margins are 5.3% compared with 7.5% for S&P 400 companies and 12.3% for S&P 500 companies.
In recent months, Lowry’s Research has given us all the “signs of small cap weakness, reflected by a decreasing number of small caps at or within 2% of their 52-week highs coupled with a steady rise in small caps that have already fallen 20% or more from their highs and into individual bear markets.†Bull markets don’t die of old age but signs of aging generally begins with small caps.
Lowry’s says that the “improving trend in Demand over the past month†is consistent with a market correction and is “unlike the rapid rise in Supply and decline in Demand
that typically occurs during the start of a bear market.†For my part, I have yet to see consistency in these Demand/Supply trends that would clearly change the worrisome trends since early July.
Lowry’s advises “careful monitoring of small caps for signs of a further sustained expansion in weakness, especially on a resumption of the market’s primary and intermediate-term uptrends.†But the rather uninspiring earnings outlook for many small cap sectors, as seen above, could make the “monitoring†pretty painful for many investors.
Stan Druckenmiller, “perhaps the greatest investor of all time†says Steve Blumenthal, does not care much of earnings as he explains in a free Real Vision interview partly by Steve and further edited by me:
Everything for me has never been about earnings, has never been about politics, it’s always about liquidity. My assumption is one of these hikes, I don’t know which one, is going to trigger this thing. I am on triple red alert, because we are not only in the time frame, we are in the part (of the cycle), maybe markets don’t anticipate the way they used to. There’s no more Euro ECB money spilling over into the U.S. equity market. If we get a blow-off at the end of the fourth quarter, which typically tends to happen especially for the NASDAQ, particularly if theses bombs keep going off in the emerging markets, I could see myself taking a big shot somewhere around year end. But that’s still a long way off, right now I’m licking my wounds from the last shot I took.
Looks like yields are breaking higher on Japanese yields. For the world, this is part of the puzzle I’m talking about. In and of itself, I don’t know. But since it looks like this is happening, and at the same time the ECB will stop buying bonds, and it looks like at the same time we’ll be shrinking our balance sheet $50 billion a month. All of these pieces fit together for a reckoning. (..) It’s also instructive as to why they are doing it. It looks like, from my read, that they are not doing it for economic reasons. They finally understand that it is killing their banks, which is the blood and the oxygen you need to run the economic body. (…)
They’re all (Japanese Central Bank, ECB, Fed) going in the same direction which is why I made the (short to market) bet in June and July and I was wrong on a trading basis. But psychologically I’m still there. It is going to be the shrinkage of liquidity that triggers this thing. And frankly it has already triggered this in emerging markets. And that is kind of where it always starts. What I haven’t seen yet, and where I think we should see it before we see it in the equity markets, and God knows, talk about a crazy priced market it’s the credit market… and it’s amazing… probably since the 1880s-1890s, this is the most disruptive economic market in history, there are hardly any bankruptcies.
So that Warren Buffett line about swimming naked when the tide goes out? There are probably so many zombies (companies) swimming out there and there is going to be some level of liquidity that triggers it (…).
I do know there are zombies out there. Are they going to infect the banking system the way they did the last time? I don’t know. What I do know is we seem to learn something from every crisis and this one we didn’t learn anything. In my opinion, we tripled down on what caused the crisis and we tripled down on it globally.
(…) envy is one of the strongest human emotions. And when you look at the wealth disparity today, in my opinion, the biggest accelerant has been QE… it’s not even debatable. Then you have the internet broadcasting this disparity through millions of bits of information on an ongoing basis.(…) So I think that is the seed of it. It’s not some economic malaise, it’s the disparity. It’s never been worse (…). This is going to get worse and it can’t stop. I don’t see what stops this until you end up with some major, major dislocations politically and economically because of it.
I agree with you that it’s not about Trump. Trump is clearly a populist but it’s globally. It’s everywhere. Other than Macron, there have been surprise after surprise to the elites on these elections and I wonder why they are surprised anymore. (…)
Probably the most destructive thing Trump has done in the global trading system is figure out how powerful a weapon the U.S. banking system was and how powerful sanctions are… but he doesn’t understand that weapon is so powerful… (…) And yes, you should use this weapon once in a while, but when you start just shooting it all over the place and you are now shooting it at Canada, at Europe, at here, there and everywhere, it’s a lot different than shooting it at Iran. He’s like a little kid that found this water gun and is just running around all over the place with it.
The biggest danger I see is that we lose that trust. That America is good and in the end, they are going to do the right thing. I don’t think that trust can be lost in four years. But if Trump is reelected or maybe even worse if another populist on the very hard left is elected and they use the weapon the same way I think by 2024, by the way it is exactly when the entitlement thing will start to get crazy, this thing could be very bad. I’m open minded… let’s see who the Democrats put up. Let’s see if Trump’s in office. But I don’t think the world will give up on us in four years. I’m open minded to Trump having been a one-off and our great system can survive this but it’s not like that’s an 80% probability, it’s probably somewhere between 40% and 55% that it works out. It’s sad. (…)
What you have done is absolutely put in force the creation of the Chinese semiconductor industry that didn’t need to happen in the time frame it is going to happen. I think there has been enough frustration with the Chinese that the Europeans could look at this and be right back there with us as allies again. (…) If you want to take on China, and fair people can debate on whether that should be done… but if you want to take on China, you can do it with a united front. You don’t do it by alienating all of your partners as the process gets underway.
Druckenmiller talks about how “crazy priced†the credit market is. Last week, the WSJ wondered why the high yield market performed so well during the recent equity market sell off, in spite of disappearing lender protections. Maybe the absence of any serious recession warning coupled with the profit boost from the tax reform is keeping credit ratios acceptable, so far.
But the crazy wheel is in motion and it normally only gets stopped during the necessarily ensuing debt crisis. Druckenmiller’s point is that rising interest rates and increasingly restrictive central banks, aggravated by their own need to restore their balance sheets, will eventually trigger the collapse.
But something is actually happening in this crazy debt market:
- U.S. HY spreads have jumped almost 100 basis points since Oct. 3rd to reach 411 bps, the highest level since March 2017. Still a long way from the 850-900 bps range reached in 2011 and 2016 but the biggest reversal in 18 months, happening when most economic data sound great. Somebody must be getting scary of Zombies here. This can easily become a self fulfilling fear…
- The share of the U.S. investment grade (IG) nonfinancial bond market that is rated BBB, the lowest credit rating still considered IG, has increased to 54% in 2018. Actually, the universe of BBB rated bonds is now bigger than that of all BB rated bonds (the highest-rated speculative grade bonds) combined.

- Pimco reveals that
Back in 2000, net leverage of BBB rated nonfinancial corporates was 1.7x on average; in 2017, net leverage for these companies was 2.9x. This suggests a greater tolerance from the credit rating agencies for higher leverage, which in turn warrants extra caution when investing in lower-rated IG names, especially in sectors where earnings are more closely tied to the business cycle.
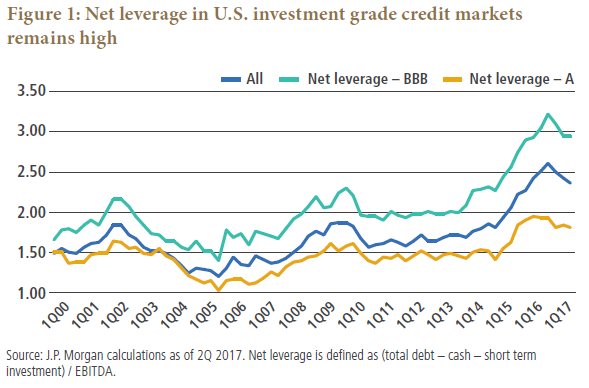
The higher leverage among U.S. investment grade issuers should also be seen in context: Back in 2010, only 6.6% of the IG nonfinancial market had net leverage greater than 4.0x, but as of 2017, that share increased to 19% (see Figure 2). In addition, only 26% of IG nonfinancial debt is leveraged less than 2.0x as of 2017, compared with 55% in 2010.
- There is a new Zombie in town, and a huge one. Rated triple-A since 1956, GE’s mammoth $110 billion debt is now rated triple-B+, only 3 steps before junk, as the 126-year-old conglomerate, once the most valuable U.S. corporation and a global symbol of American business power, faces the stark reality that Jack Welch and Jeff Immelt far from deserved their reputation. General Eclectic (its 10-K is 220 pages!) shares touched $60 in 2000 when it sold for 50 times EPS and 12 times book. Now: $8.00 and 9 times trailing earnings with zero visibility for future earnings, if any.
The next step in this crazy debt market will likely be the passing of a massive amount of BBB debt into the High Yield bucket and the impact that this huge overflow will cause. There will be blood! And were GE’s debt to lose 3 more notches, the $1.2T junk bucket would totally erupt. Refinancing in such an environment will only aggravate the look of the current Zombies and bring along a new wave of these beasts.
I wonder if the Fed is aware of this potential side effect…
-
Debt-Market Slowdown Troubles Investors When businesses have sold debt recently, they have often struggled to attract much interest, triggering worries that borrowing costs for U.S. companies might go up.
Pfizer to Raise Prices on 41 Drugs Pfizer plans to resume its practice of raising drug prices early next year after bowing to pressure from President Trump earlier this year.
(…) It said it would raise the list prices of 41 of its prescription drugs, or 10% of its portfolio, in January. (…) Under a 2017 California law, Pfizer had to give 60-day notice if it wanted to increase the prices of certain drugs by more than 16% over two years. (…)
Of the 41 price increases Pfizer announced, 23 met the California law’s threshold, according to the person familiar with the matter. Most of the increases Pfizer plans in January will be 5%, though the company will raise three drugs’ list prices by 3% and one drug’s by 9%.
Representatives for Bristol-Myers Squibb Co. BMY 1.50% and Allergan PLC said they also made notifications required under California’s new law but declined to name the drugs. Bristol-Myers said its list-price increases next year wouldn’t exceed 6%. (…)
Drug companies have raised list prices on 263 drugs so far this year by an average of 7.8%, compared with averages surpassing 12% over the same period during the peak years of 2014 and 2015, according to Elliot Wilbur, a Raymond James & Associates analyst. (…)


 Trump and Xi Likely to Get Only Framework Trade Deal, Ross Says

 Investors are clearly, justifiably, very worried about the Nov. 20 meeting between Xi and Trump, as are probably every corporate executive in the world. The Brexit mess is pretty minor against the possibility of a major trade war that would impact the whole world. Any agreement to hold fire and keep talking will be welcome. While this seems to me the most likely scenario, eventually leading to a mutual face saving accord, the risks of being wrong are such that it seems best to keep some dry powder for now.