US labour market recovery set to lose steam in the short term
(…) If the pace of employment gains experienced over the past three months can be sustained, the US would be back to its pre-COVID level of employment by September next year. However, there are reasons to think that this pace will not be sustained. For one, any further fiscal support is likely to be much less generous than in the spring. Meanwhile, daily new coronavirus cases are surpassing previous peaks. Against that backdrop, we expect softer employment growth in the months to come, with therapeutics or a vaccine possible tailwinds to jobs growth next year.

U.S. JOLTS: Job Opportunities Rate Holds Steady but Hiring Slips
(…) The job openings level rose 1.3% to 6.436 million, down 8.7% y/y. The job openings level in the construction sector fell 31.2% y/y but in manufacturing, it rose 3.4% y/y. It fell by 21.5% y/y in leisure & hospitality but rose 1.3% y/y in the professional & business service sector. In government, the number of job openings declined 3.6% y/y. (…)
In September, the level of hiring declined 1.4% to 5.871 million (-1.5% y/y) following a 0.8% August gain. (…)


The fact that there was not much change in the latest data from the federal Job Openings and Labor Turnover Survey (JOLTS) is a bad sign for this labor market recovery. The number of job openings didn’t really change from the month before. The quits rate, a sign of worker confidence, was also very similar to the prior month. For signs of a strong labor market recovery, both of these numbers need to rise. That is not what we are seeing.
Another concerning sign is that while layoffs went down in September, the outlook for jobless workers looking for a new job worsened. A measure of unemployment that more fully captures permanent unemployment— the ratio of unemployed workers to job openings — increased in September.
It’s hard to see any signs of backsliding, but there aren’t any signs of acceleration in the recovery either. Hiring isn’t speeding up, and, if job openings are any indication, it is unlikely to do so in the near term. In a labor market with 10 million fewer jobs than February, we need to see hiring moving at a faster clip to avoid lasting damage.

U.S. Covid-19 Cases Hit Fresh High Coronavirus cases continue to surge across much of the U.S. as hospitals in some states grapple with crowded intensive-care units.
The U.S. set another single-day record for coronavirus cases, as the total number of new infections topped 136,000, while hospitalizations due to Covid-19 were at their highest level since the pandemic began. (…)
Hospitalizations, up around 30% since the beginning of the month, reached 61,964 as of Tuesday, exceeding the previous high of 59,940 reached on April 15, according to the Covid Tracking Project. A summer surge also saw hospitalizations reach just shy of 60,000 in July.
Intensive-care units are also facing an upsurge in patients due to the pandemic, with 11,952 people in ICUs in the U.S. as of Tuesday, the highest number since May 7. (…)
")

U.S. metropolitan areas are averaging a record 27.8 daily coronavirus cases per 100,000 people, according to U.S. Centers for Disease Control and Prevention data. Although rural areas are still worse on a per-capita basis, it’s clear that cities have been swept up in the pandemic again.
The surge has expanded from highly rural states in the Midwest and Rocky Mountain West to areas with bigger populations and more urban living. That has meant rising cases in and around Denver, Detroit and Chicago. Further to the east, the virus is mounting a comeback around Newark, New Jersey, and Boston. (…)
")
 Source: WSJ
(…) The share of New York City residents who tested positive for the new coronavirus last week reached 2.31%, the highest percentage since June, according to city data. The daily positivity rate was 2.88% on Sunday, the data showed. (…) Hitting a 3% positivity rate on a seven-day average across the city could also trigger more restrictions, such as moving public schools to all-remote instruction and closing some businesses. (…)
New York state added nearly 4,000 Covid-19 cases on Monday, according to the governor’s office. The state’s daily positivity rate was 3.09%; the rate hasn’t hit 3% since May 26 and the state hasn’t seen this case load since May 1. On Monday, there were 32 deaths from the virus in New York. (…)
- Israel was first to impose national restrictions, entering a month of lockdown from 18 September. Ireland followed, beginning a six-week period of national lockdown on 21 October. The renewed lockdowns in these two countries have proved extremely effective in bringing down the number of identified cases of COVID-19. Fathom Consulting)


Banks in Europe Face Potential $1.7 Trillion Covid-19 Cliff European banks say they are doing just fine during the coronavirus pandemic. But regulators and bank executives are concerned about the elephant in the room: a wave of bad loans that could overwhelm lenders when government rescue packages end.
(…) The European Central Bank said bad loans in the eurozone could soar as high as €1.4 trillion, equivalent to $1.7 trillion, if the economies fall even more than expected, a scenario the central bank said is severe but plausible. That amount would be more than during the aftermath of the financial crisis.
The concern is that banks could run out of capital if they are suddenly overwhelmed by defaults, needing state support or even failing. What isn’t clear right now is how quickly those defaults could pile up, or if state programs might cushion banks’ losses for years to come. (…)
In Italy—where banks are still trying to deal with old bad-debt portfolios—over 25% of loans to businesses and 15% to households, totaling around €300 billion, were put under payment holidays, according to Marco Troiano, deputy head of the banks team at the ratings company Scope Ratings. (…)
In Portugal, where companies and the government are highly indebted, loan moratoriums to businesses covered almost a third of the total, according to the country’s central bank. Over half of the credit to companies in the hospitality and restaurant sectors are under the program. (…)
Part of the reason for the rosy picture from banks comes down to accounting rules. Banks can typically count a loan as performing until there is actual deterioration, such as missed interest payments or a company going bankrupt.
Andrea Enria, the head of the ECB’s supervision arm, said some banks are being optimists and waiting until there is concrete evidence a customer is going bankrupt. (…)
Borrowers still taking payment holidays on $90bn of loans at top US banks Total halved over third quarter but remains elevated, obscuring outlook for defaults
Ackman places new bet against corporate credit Billionaire says markets are once again complacent about the impact of pandemic
(…) “I hope we lose money on this next hedge,” Mr Ackman said. “We’re in a treacherous time generally and what’s fascinating is the same bet we put on eight months ago is available on the same terms as if there had never been a fire and on the probability that the world is going to be fine.” (…)
Cyclical Stocks Power Dow Industrials Higher
(…) The Dow has outperformed the technology-heavy Nasdaq by 6.74 percentage points this week, the largest two-day performance spread since March 2001. It rose 262.95 points, or 0.9%, to 29420.92 on Tuesday, its third-highest close in history. Boeing, Chevron and 3M were among the biggest gainers.
The Nasdaq Composite, meanwhile, fell 159.53 points, or 1.4%, to 11553.86, with the big technology stocks that have powered much of this year’s stock rally pulling back for a second consecutive session. The S&P 500 edged down 4.97 points, or 0.1%, to 3545.53. (…)
")
")
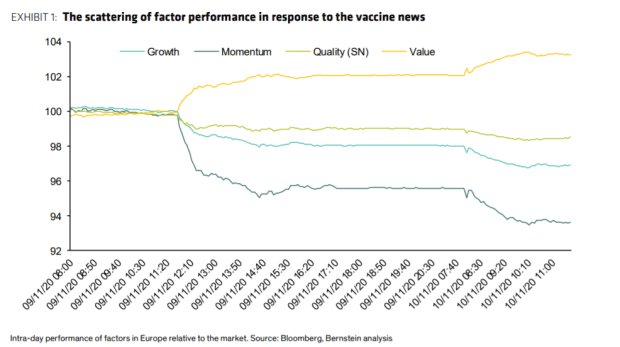
Buy-losers-and-sell-winners hits historic proportions
(…) The two periods with dispersions as great as they are now both led to extended periods of smaller stocks doing better than larger ones.
The same pattern holds true for value versus growth stocks. By the time dispersion among the factors reached the current level, value stocks were about to embark on multiple years with massive outperformance relative to growth.
Investors have been looking for a turn in these relationships for years, and yet in most respects, they just keep getting more extreme. It seems like Monday’s shock, building on the massive differences in positioning for most of this year, is enough to equate to some of the most notable changes in 75 years, and that has been a very good relative sign for small and value stocks.

Out of all the major indexes, none are benefitting from the positive vaccine developments more than the Russell 2000 index of small-capitalization stocks.
Even without Monday’s massive rally, it has performed well enough that its medium-term trend has jumped well above its long-term one, thanks to a kick-off surge in early October. Respected technician Helene Meisler noted that the 50-day average of the index has moved the most above its 200-day average since 2017.
While there have been wider spreads between the two trend measures, by the time it reached 8%, it has been a good sign for the index.
Returns were okay over the short- to medium-term but really shined over the next year. There were no losses out of the 11 signals, and the risk/reward was impressively skewed to the upside.

Goldman’s bull case:
S&P 500 index: We lift our year-end 2020 target to 3700 (+4%) consistent with our previously published fair value estimate of the market under a divided Congress scenario. Our prior target was 3600. We forecast S&P 500 will climb by 16% to 4300 at year-end 2021 and gain 7% to reach 4600 by the end of 2022. The market is actually less dependent on the performance of a few mega-cap stocks than many investors perceive.
Stronger-than-expected 3Q results lead us to raise our S&P EPS forecasts to $175 in 2021 (from $170) and to $195 in 2022 (from $188) reflecting growth of 29% and 12%, respectively. For comparison purposes, our top-down 2021 EPS forecast is 4% above the bottom-up consensus expectation of $168 and 13% above the median consensus top-down forecast of $155.
Valuation: Falling equity risk premium supports a higher valuation for stocks. Our S&P 500 year-end 2020 target implies a forward P/E multiple of 21x. We project the multiple will expand to 22x by end 2021 and remain stable in 2022.

Note: The red lines above and below are mine. 
But GS rises to the valuation challenge:
Reconciling the signals of absolute vs. relative valuation is challenging. Stocks are highly valued on an absolute basis relative to history. The aggregate index trades above the 90th percentile on a variety of metrics including P/E, EV/sales, EV/EBITDA, Price/Book, and market cap/GDP. This suggests caution is warranted. However, the index and the median S&P 500 constituent are actually modestly undervalued on a relative basis compared with US Treasury yields and corporate bond yields, currently averaging at the 42nd percentile since 1976.
But why are interest rates so low again?
Rosenberg: Pfizer’s promising COVID-19 vaccine is a potential game changer for the economy and how to invest
(…) I had been in the camp of Dr. Anthony Fauci, where a vaccine was more of a late 2021 story with perhaps 60-per-cent efficacy. Now that timetable may well be moved up to no later than late in the first quarter and, at 90 per cent, there is no longer the fear that a take-up is going to be low.
The bottom line is that downside economic risks, which always have been tied to health risks, have subsided sharply. (…)
All that said, there are tailwinds for the equity market here, and the value stocks are still so cheap in relative and absolute terms that this trade could persist a while longer. But at this point, the Pfizer news has to go from success in a trial to something real and tangible. (…)
If the initial market reaction is correct, then we should be seeing the inoculations begin by the end of the first quarter of 2021. This is what is being priced in. That means no first-quarter U.S. GDP contraction and it means a likely second-quarter economic boom.
We shouldn’t be too dismissive of the timing. First, winter is coming and that means, absent a vaccine, the case counts, hospitalizations and fatalities are likely to get worse. Human nature is such that people will now be willing to be patient with the vaccine coming soon. As in, why screw this up? So this, along with thin U.S. stimulus spending, does complicate the economic backdrop for this quarter and perhaps into the first quarter of the new year. (…)
If people begin to see that life is going back to normal, we are talking about a US$700-billion hole in the consumer-services area of the economy (like airlines, rail, hotels, restaurants, retail, etc.) that will get filled, and likely rather quickly. This is a 3-per-cent boost to U.S. GDP right there, not including all the other multiplier effects from a speedier pace of job creation and generally increased economic confidence. (…)