SKINNING THE INFLATION CAT
In so many ways. The cat being out of the bag, everybody is scrutinizing the data.
- The CPI Food-at-Home index is up 4.5% YoY but beware: last 3 months +9.5% annualized!
- Core Goods prices are up 7.3% YoY and +4.0% in the last 3 months annualized.
- Core Services are still behaving well: +2.9% YoY and +2.0% in the last 3 months annualized.
- But that is because Transportation Services (vehicle maintenance and repair, insurance and air fares), up 4.4% YoY are down 16.1% annualized in the last4 months.
- Shelter costs are up 3.2% YoY and +4.0% in the last 3 months annualized. The rising threat.
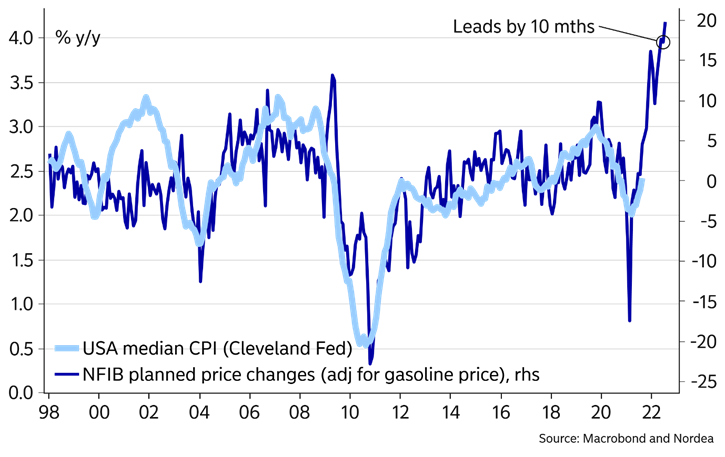
The Cleveland Fed’s MoM data all look bad, except for core CPI lately. The trimmed-mean CPI, which weeds out the outliers, is particularly worrying:

While core CPI is behaving, median CPI is accelerating. Just the beginning?
Median CPI increases? Wait for it…
- The last 6-months viewed by NBF:

- And it’s no longer the pandemic as Bloomberg explains:
Last month, substantially all of the increase in inflation came from sectors that were not particularly affected by the pandemic. On a month-by-month basis the pandemic effect is over, and yet inflation remains elevated.

TRANSITORY FADING
Yesterday’s CPI seems to have seriously shaken certain convictions:
-
The WSJ editorial: The Inflation Tax Rises One event to watch is who takes the political rap for 5% inflation.
-
Atlanta Fed President Raphael Bostic: “It is becoming increasingly clear that the feature of this episode that has animated price pressure—mainly the intense and widespread supply-chain disruptions—will not be brief. By this definition, then, the forces are not transitory.”
-
Fed Official Sees Risks of More Persistent Inflation Governor Michelle Bowman warns that structural changes could impair a full labor-market recovery and push up prices.
-
John Authers: The inflation numbers are undeniable now There’s no getting around it: The September data have dashed any hopes that inflation is transitory.
-
RBC CEO warns ‘persistent inflation’ is building, disputes central bank forecasts
We also got the September Fed Minutes:
The Fed’s staff now accepts “higher for longer”:
- “The staff interpreted recent inflation data as indicating that supply constraints were putting a larger amount of upward pressure on prices than previously anticipated,” the minutes said. Compared with the previous projection made in late July, “these supply constraints were also expected to take longer to resolve.”
But ended up elongating the transitory period:
- The Fed’s staff forecast prepared last month revised its inflation projection higher, but bank economists still expected this year’s rise in inflation to prove transitory, the minutes said. That forecast called for inflation to slow to slightly below the Fed’s 2% target next year amid a sharp drop in import prices before returning to 2% by 2024.
Yet, “most [FOMC] participants saw inflation risks as weighted to the upside because of concerns that supply disruptions and labor shortages might last longer and might have larger or more persistent effects on prices and wages than they currently assumed.”
To me, the “and wages” part is the surprise and indicates that “most participants” are starting to worry about wage inflation.
- The minutes also indicated that staff economists pointed to a risk that households’ and businesses’ expectations of inflation in the future “would move appreciably higher,” which would be an alarming development for central bank officials because they believe such inflation expectations play important roles in influencing actual inflation.
- Fed Vice Chairman Richard Clarida said Tuesday that the Fed would need to raise interest rates if it sees evidence households and businesses were beginning to expect recent inflationary pressures to persist. “Monetary policy would react to that,” he said. “But that is not the case at present.”
Right on cue, as if to support Clarida’s assertion:
Atlanta Fed’s Business Inflation Expectations Unchanged at 3.1 Percent
- The BIE was created to measure the year-ahead inflationary sentiments of businesses in the Sixth District.
- Firms’ year-ahead inflation expectations remain unchanged at 3.1 percent, on average.
")
- So, the business inflation anchor looks reasonably solid. But when asked for their 5-year inflation expectations, the mean forecast was +4.3%…with a 3.3% standard deviation…What kind of an anchor is that?
- Sales levels “compared to normal” increased slightly. However, profit margins remain unchanged at levels below the 2015-2019 experience.

- Good thing that sales remain good because year-over-year unit cost growth increased significantly to 3.5 percent, on average.
")
- 29% of the firms said their unit costs were “up significantly” vs 12% 6 months ago and 30% said “very significantly” (vs 14%); 31% were “up somewhat” (vs 55%).
So, businesses’ “inflationary sentiment” is stable at 3.1% for the next year. Yet, their presumably “measured actual” unit costs are spiking up. They surely think the Fed’s staff will prove right, even though they seem to seriously doubt it with a 4.3% 5Y inflation sentiment.
Meanwhile:
- Oil Demand to Rise as Gas Crunch Forces Plants to Switch Soaring natural-gas and coal prices are forcing power-generation companies and manufacturers to switch to using oil, a move that could add half a million barrels a day to global demand, the IEA said.
- Inflation drives up drillers’ costs in US shale oil patch Rising wages and equipment delays help lift Texas crude above $80 a barrel
- A Winter of Giant Gas Bills Is Coming According to the Energy Information Administration, nearly half of U.S. households that warm their homes with mainly natural gas can expect to spend an average of 30% more on their bills compared with last year.
- From TSMC’s conference call: “TSMC’s production will likely remain stretched through 2022, as demand for semiconductors that power everything from cars to the latest smartphones drove lead times to record highs and helped fill order books. In order to secure supplies, more customers are now paying upfront, compared with just “one or two” before. (…) We expect TSMC’s capacity to remain very tight in 2021 and throughout 2022,” Chief Executive Officer C.C. Wei said on a conference call.”
- U.K. Companies Increase Salaries and Still Can’t Find Workers
Eight in 10 U.K. companies struggled to find workers last month despite many of them increasing wages, according to a survey that shows labor shortages are intensifying.
The proportion was up sharply from three months earlier, with the squeeze most pronounced in the catering and hospitality sectors where 92% of firms that attempted to recruit reported difficulties, the British Chambers of Commerce said Wednesday. (…)
China’s Factory-Gate Prices Rise at Record Pace Surging prices of coal and other commodities pushed up the country’s inflation to the highest level since 1996, dimming hope it would ease globally in the near term.
China’s producer-price index, a gauge of factory-gate prices, rose by 10.7% in September from a year ago, accelerating from a 9.5% increase in August, and grew at the fastest pace in 25 years, according to the National Bureau of Statistics. (…)
The record increase was due mainly to rising prices of coal and some energy-intensive products such as nonferrous metals, steel and chemicals, said Dong Lijuan, a spokeswoman for the statistics bureau, on Thursday. (…)
Beijing’s aggressive energy-efficiency campaign has led to the closure of many high-polluting coal mines, while a drop in imported coal from countries including Australia, Mongolia and Indonesia exacerbated the shortage. This week, flooding hit northern Shanxi province, where about one-third of coal in China is produced, worsening the supply shortfall. (…)
The most actively traded thermal coal futures on the Zhengzhou Commodity Exchange jumped by 60% in September and kept climbing through October to date. It touched a record of the equivalent of $255 a ton on Wednesday.
(…) Chinese manufacturers, already hammered by higher costs of other materials and power rationing, are likely to either cut back on output or pass on more costs to western consumers, whose appetite for goods such as toys and electronic gadgets has stayed strong ahead of the Christmas shopping season. (…)
China allowed electricity prices for industrial users to rise by as much as 20%, compared with the previous 10% cap, likely boosting the headline producer-price index to 12% in October or November and adding 0.5 percentage point to consumer inflation, according to estimates by Zhaopeng Xing, a strategist from ANZ. (…)
Scary chart from ZeroHedge:

Superimposing these 2 charts allows us to expect higher consumer inflation in China in coming years:


- BTW: At least 13 companies listed on China’s A-share market have announced price hikes this year, while tire producers said they plan to adopt new price policies in October, according to state media reports.
If you worry about inflation, particularly on essentials such as energy, rent, food, apparel, you must then start worrying about the consumer, 70% of GDP, although this is more a 2022 story.
The Chase card spending tracker remains solid through Oct. 4 even with weak travel and entertainment spending:

Chase’s control sales tracker was up 0.8% MoM in September.

In the conference call, Chase said that spending on Chase consumer credit cards rose 30%, while outstanding card loans rose just 2% — a sign consumers are still slashing balances rather than carrying them over even as the economy emerges from the pandemic.
It seems that many Americans are rethinking their life, and their jobs. The Quit Rate is higher than ever:
With February 2020 = 100, August 2021 = 107.4 for private hires but 132.0 for private quits. The absolute scales are very different but the amazing and unprecedented trends must be saying something about the labor slack and worker motivations. Either people are retiring, or they are moving to better jobs, for monetary or other reasons.

Since June, per the JOLT reports, 300k Americans quit their job while hires declined by 390k. In the last year: 1 million quits against 161k hires.
Cass Transportation Index Report
The shipments component of the Cass Freight Index® slowed to just 0.6% y/y growth in September.
- On a seasonally adjusted (SA) basis, the Cass Shipments Index fell by 4.9% m/m in September, after a 4.8% m/m increase in August.
- The two-year stack reversed to a 1.3% decline from 3.7% growth in August.
The softening in September fits the pattern of many data sets, like rail volumes and employment, and we’d ascribe some of the softness to Hurricane/Tropical Storm Ida. This suggests some rebound in Q4, but the chip shortage also worsened in September, and that recovery will take longer.
Freight volumes also remain capacity-constrained, as shown by the armada of containerships at anchor off North American ports. Signs are emerging that rail network congestion is improving, which could help things unlimber a bit, but we think intermodal volumes will be limited by chassis tariffs for some time.
- On a two-year stacked basis, the Cass expenditures index was up 34% in September, more than explained by higher rates, as shipment volumes were down slightly on this basis.
- The freight rates embedded in the two components of the Cass Freight Index were 31.4% higher y/y in September, accelerated from the 26.6% y/y increase in August on a similar prior year comparison.
- The inferred rates rose 2.6% m/m on a seasonally adjusted basis in September, building on a 6.1% m/m increase in August.
Though difficult to quantify, there are a lot of excess miles in the system due to all of the supply chain disruptions in the shortage economy of 2021. Examples include containers being offloaded at small remote ports to attempt to avoid the backlogs in LA and Long Beach, and chassis shortages pushing freight from the congested rail network onto truckload, considerably raising the length of haul in the largest freight market.
These excess miles are part of the 31.4% y/y increase in inferred freight rates, because, as noted in the calculation above, these rates are on a per shipment basis, rather than a per mile basis. But the difference between the increase in overall inferred freight rates (2.6% m/m) and the Cass Truckload Linehaul Index® (1.1% m/m) also includes higher fuel surcharges, sharper increases in air cargo rates, and mix shifts between modes, with a smaller proportion of low-cost intermodal and rail, and a larger proportion of relatively higher-cost air and refrigerated truckload.
Moreover, these data show broad and material increases in freight rates across modes. For full-year 2021, if normal seasonality were to play out, this index would be up about 20% from 2020.
The data set is diversified among all modes, with truckload representing more than half of the dollars, followed by LTL, rail, parcel, and so on.
Cass Inferred Freight Rates, January 2010
Freight demand is clearly still strong, and supply challenges continue to mount, keeping upward pressure on rates.
A skeptic might look at flattish volume and record rate increases and shout “stagflation!”, but we would disagree. Freight demand is anything but stagnant, and has been caged by supply constraints, which are likely peaking with the season.
The extent to which constraints on equipment and driver supply ease in the coming months will largely dictate volume and rate trends. Intermodal volumes have been inching up sequentially in recent weeks as chassis turns improve, and China’s power outages will likely impact exports, so the containership backlog should ease in the coming months. Still, a low inventory/sales ratio and an early Chinese New Year in 2022 starting on February 1st support strong import demand in early 2022.
- Equipment. Semiconductor shortages continue to separate Class 8 tractor production from demand, and trailer supply chain challenges have also limited capacity. Chassis production is still below replacement, but has improved in recent months and improving chassis turns are also helping to reduce rail network congestion.
- Drivers. Though driver capacity is still generally tight, the BLS trucking employment data have improved for four straight months and the ACT Research For-Hire Driver Availability Index continues to recover.
Eventually, improving driver and equipment capacity will help rebalance the market, but several recent factors, including Hurricane Ida, the Delta variant, and the chip and chassis shortages have been inflationary for freight rates, extending the cycle at the margin.
Vaccine mandates and a closed loophole in the FMCSA Drug & Alcohol Clearinghouse are new inflationary risks this month and will challenge the driver recovery.
Freight demand fundamentals remain strong, based on a strong U.S. consumer balance sheet, inventory restocking, and an industrial sector struggling to grow into record orders with infrastructure stimulus likely on the way.
But the dynamics of tight supply and exceptionally strong demand which have characterized the past year or so will not last indefinitely. The chip shortage continues to be a key fulcrum on which much in the world economy depends. As discussed in depth in ACT’s monthly report, there’s good reason to hope easing will start in Q4.
