Job Cuts Fall 43% in December, Up 129% from Same Month Last Year, Q4 Cuts Highest Since Q4 2020
U.S.-based employers announced 43,651 cuts in December, falling 43% from the 76,835 announced in November. It is up 129% from the 19,052 cuts announced in the same month in 2021, according to a report released Thursday from global outplacement and business and executive coaching firm Challenger, Gray & Christmas, Inc.
December’s total is the second-highest number of monthly job cuts announced in 2022 and marks the eighth time last year when cuts were higher than the corresponding month a year earlier.
In the fourth quarter, employers announced 154,329 job cuts, the highest quarterly total since the final quarter of 2020, when 222,493 job cut announcements occurred. It is 172% higher than the 56,749 cuts announced in the last quarter of 2021 and 102% higher than the 76,284 cuts announced in the previous quarter.
“The overall economy is still creating jobs, though employers appear to be actively planning for a downturn. Hiring has slowed as companies take a cautious approach entering 2023,” said Andrew Challenger, Senior Vice President of Challenger, Gray & Christmas, Inc. (…)
“Clearly, interest rate hikes and inflation impacting the housing market are causing companies in Financial, Real Estate, and Construction to lay off workers,” Challenger said. (…)
Job cut announcements jumped in Q4. That should impact employment growth in Q1.

December saw a disproportionate share of cuts for economic reasons:

However, technology got a large share of the cuts while consumer-sensitive sectors are not flashing red so far.
That said, unemployment claims still do not point to a weak labor market. The horizontal line (230k) is where claims were in Q4’20. Continuing claims (black line) are als rolling over, suggesting that unemployeds are finding new jobs.

- Goldman Sachs tracks layoffs collecting data from advance layoff notices filed under the Worker Adjustment and Retraining Notification (WARN) Act.
The WARN Act requires companies to notify state governments of plans to lay off 500 or more employees 60 days in advance in most cases. Many state governments upload these notices to their websites shortly after they are received, allowing us to construct a more timely measure of planned layoffs that tracks the JOLTS layoff rate well.
Our analysis shows that WARN notices were well below their pre-pandemic levels between April and August of 2022 but have risen somewhat in the last few months. Our tracking estimate based on December and January WARN notices is consistent with a layoff rate of around 1.1%, higher than the 0.9% in the November JOLTS report but a touch below the average rate in 2019.
At the same time, job gains remain strong and the re-employment rate of unemployed workers stood at 31% in December (vs. 28% on average in 2019), suggesting that the uptick in gross layoffs is unlikely to translate to an unusually large increase in net unemployment.
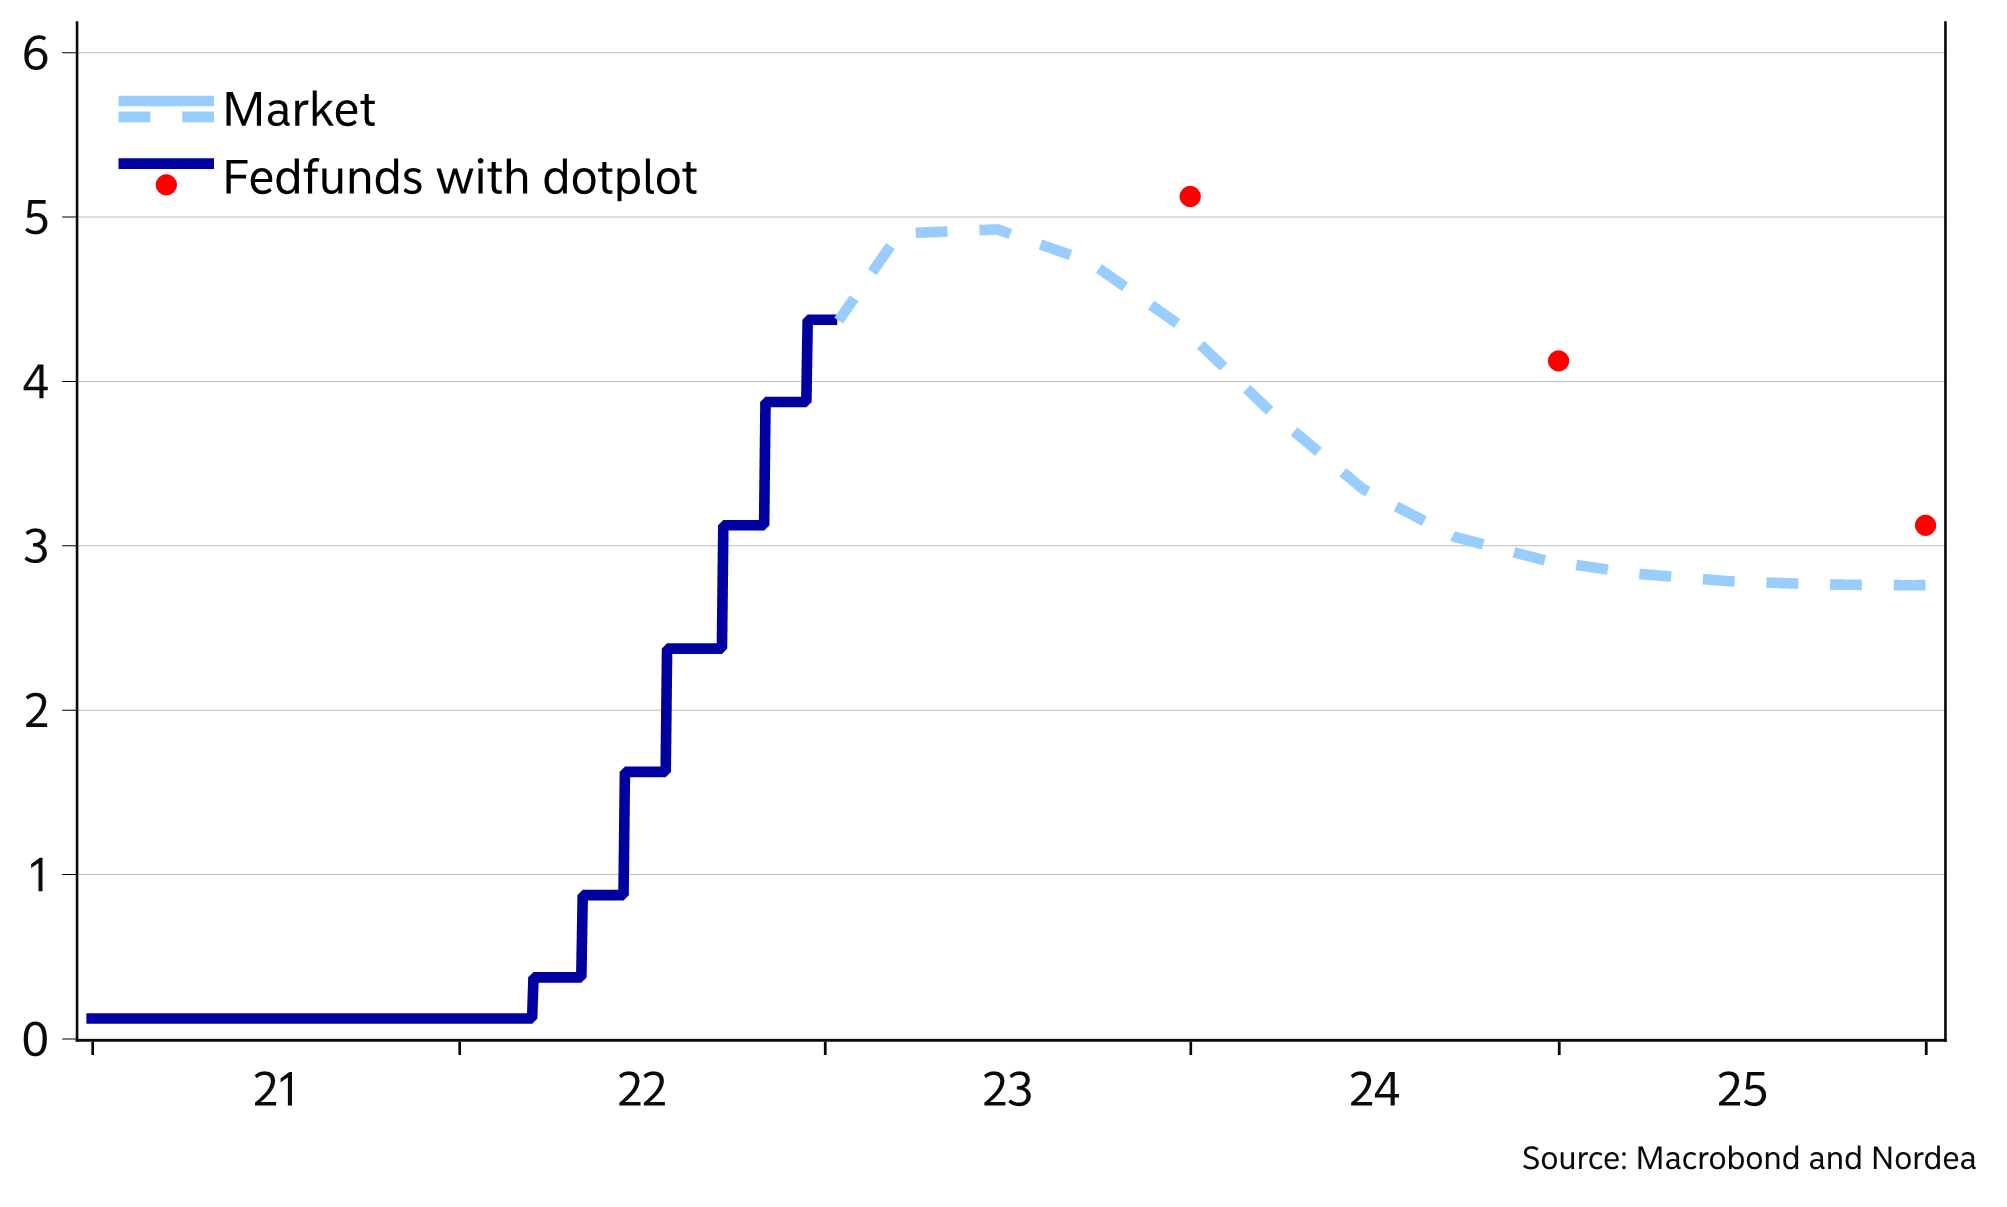
- The tug of war will continue (Nordea)
Even though the Fed continues to tell us that fed funds rate needs to go higher and stay there for a prolonged period, the market has been sending market forward rates down with the first rate cut expected already this fall. Risk markets do not seem too concerned about a major downturn, so the discrepancy is most likely over inflation. It appears that the market sees high inflation as less of a problem than the Fed as long as the direction is down. Or, they anticipate that the central bank will cave in to public and political pressure as soon as the labour market starts going sour.
The Fed and the Market do not agree of the level of rates going forward
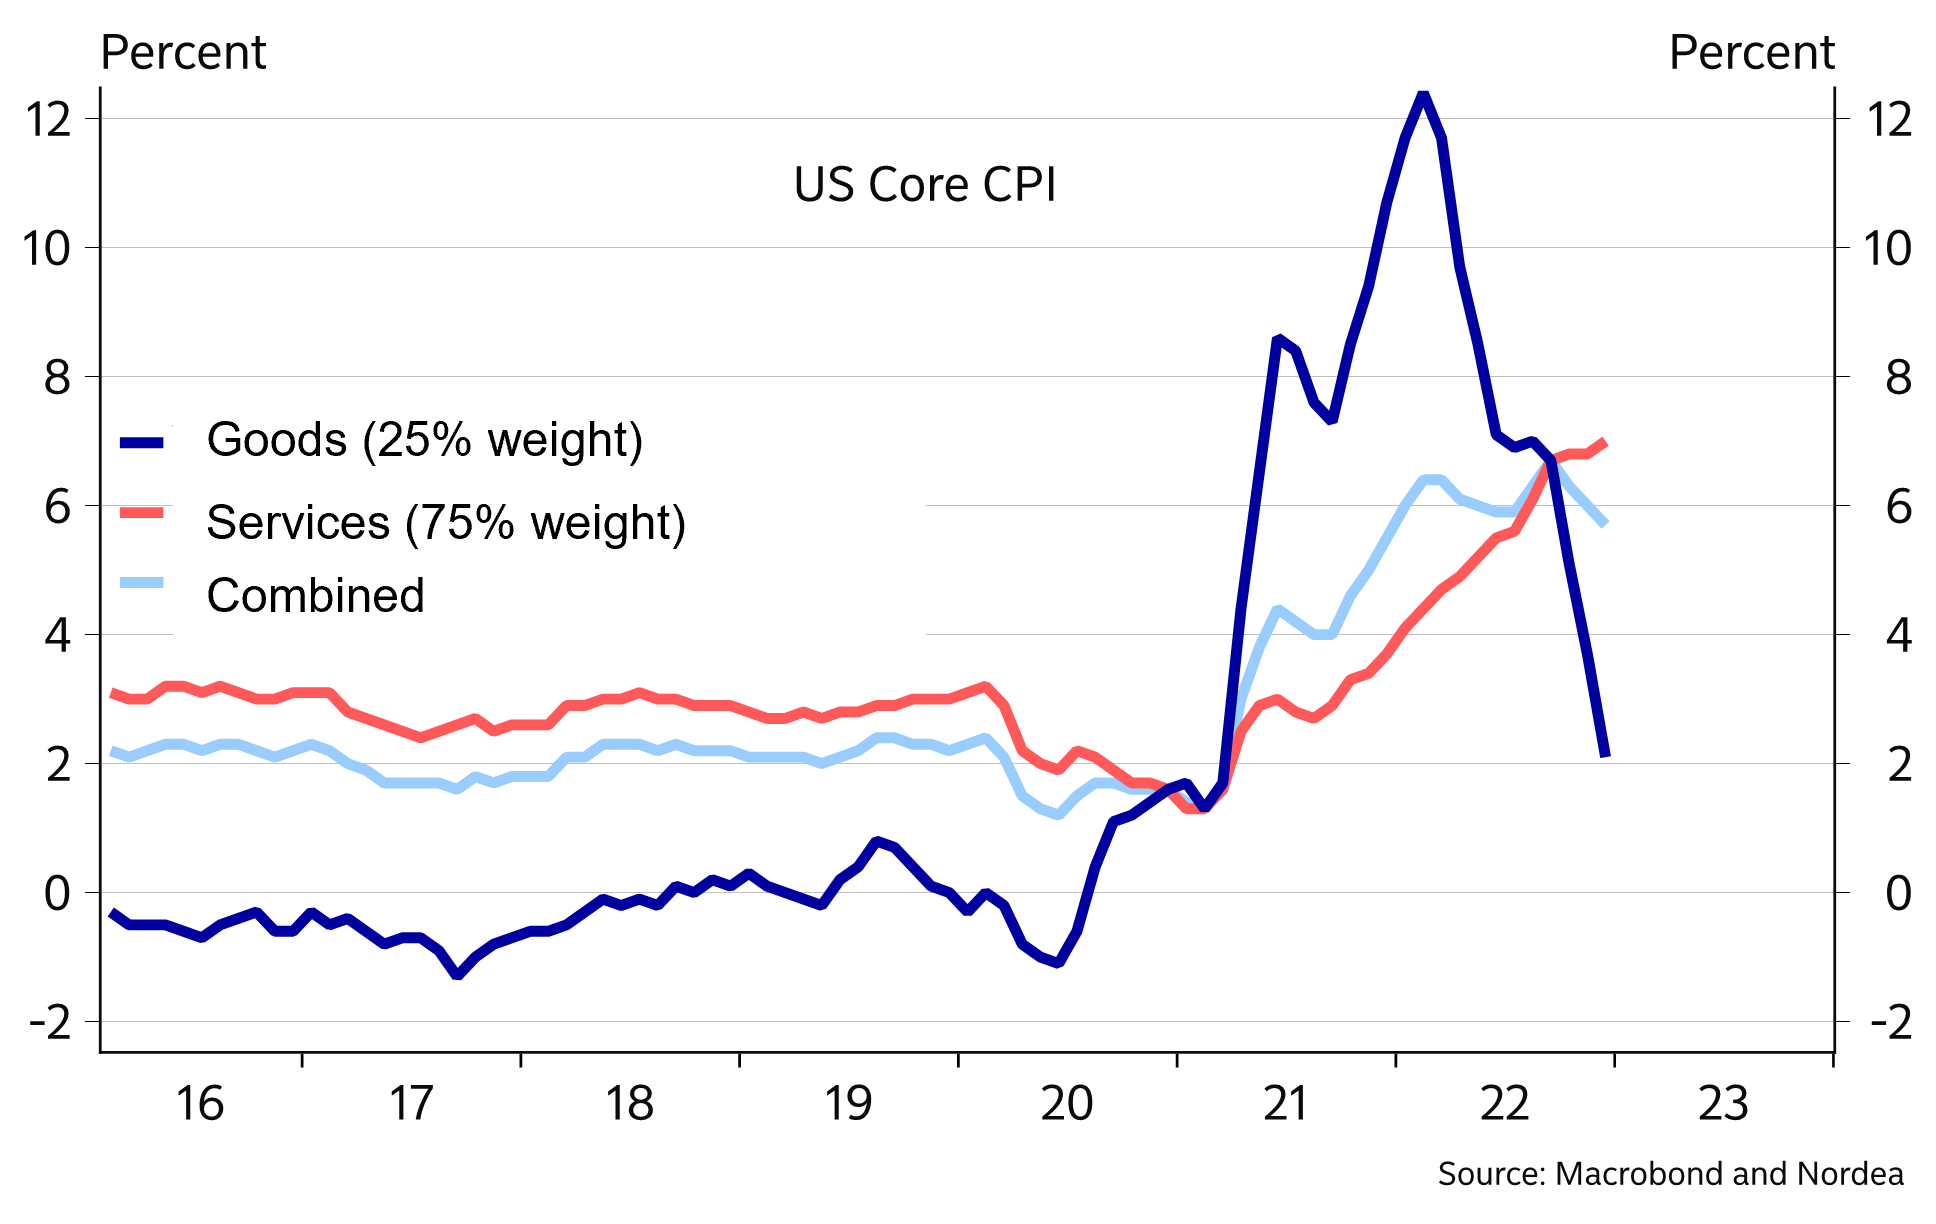
We believe that we could see inflation falling quite rapidly until the summer, but that the more sticky categories will still produce price pressures much too high for the Fed’s liking. We could also continue to see economic activity slowing down somewhat, but not to the extent needed to really cool off the labour market. Hence, the difference in views between the Fed and the market could very well stay with us for some time. This week’s inflation print did little to solve the conflict with falling goods prices (trailing falling commodity and freight rates) driving the overall number lower, whereas service inflation headed higher driven by still rampant labour market pressures and past increases on apartment rents. (…)
Even though investors are less scared of inflation, the Fed is still dead set on making sure it’s beaten all the way down to 2%. This difference in opinion will most likely lead to a volatile and range-bound development in rates markets.
If market rates stray too low, they are in peril of rising on Fed talk or better than expected labour market data. In addition, hefty negative carry will tempt some investors to abandon the flattening trade and we will continue to see net bond selling from foreign investors.
Should rates get too high, the temptation to lock in a decent yield in an uncertain world where inflation is less of a problem than in 2022, will lead investors to buy bonds out the curve.
We struggle to see how this disagreement will be resolved in the near term. In a year’s time we could look back on an economy that performed decent with a still tight labour market and inflation that is too high for the Fed’s comfort. But, at the same expect things to run afoul in 2024 and force the Fed into cutting rates.
(…) “It’s a little bit premature at this point to be thinking about pausing, but we’re getting much closer to that day,” he said. But “I don’t think we have to make a definite decision beyond February” at this point, he said. (…)
“The more optimistic possibilities” of averting an economic downturn look “more plausible today than they did several months ago,” Summers said. At the same time, consumer-price gains in excess of 6% are “still inconceivably high” compared with the pre-pandemic period, he said.
A key gauge to monitor will be the employment cost index for the final quarter of the 2022, Summers said. The ECI — a broader measure of labor costs than the monthly hourly earnings indicator — is the “gold standard” of such indicators, he said.
That report is due Jan. 31, a day before the Fed announces its next rate decision. In the first quarter of last year, the ECI rose by the most on record in data going back to 1997. (…)
A key gauge to monitor will be the employment cost index for the final quarter of the 2022, Summers said. The ECI — a broader measure of labor costs than the monthly hourly earnings indicator — is the “gold standard” of such indicators, he said.
That report is due Jan. 31, a day before the Fed announces its next rate decision. In the first quarter of last year, the ECI rose by the most on record in data going back to 1997.
ECI YoY
ECI MoM
Growth in U.S. Population Shows Early Indication of Recovery Amid COVID-19 Pandemic
After a historically low rate of change between 2020 and 2021, the U.S. resident population increased by 0.4%, or 1,256,003, to 333,287,557 in 2022, according to the U.S. Census Bureau’s Vintage 2022 national and state population estimates and components of change released today.
Net international migration — the number of people moving in and out of the country — added 1,010,923 people between 2021 and 2022 and was the primary driver of growth. This represents 168.8% growth over 2021 totals of 376,029 – an indication that migration patterns are returning to pre-pandemic levels. Positive natural change (births minus deaths) increased the population by 245,080.
“There was a sizeable uptick in population growth last year compared to the prior year’s historically low increase,” said Kristie Wilder, a demographer in the Population Division at the Census Bureau. “A rebound in net international migration, coupled with the largest year-over-year increase in total births since 2007, is behind this increase.” (…)

I am intrigued by this quote from a UBS economist via Axios:
“Although not yet in the official labor market statistics, this is another sign that after a 2020 and 2021 playing catch-up, the labor market may be coming into better balance,” Jonathan Pingle, an economist at UBS, wrote in a note. (…)
These new population figures are incorporated by the Labor Department into their estimation of the household survey, one of the two surveys used to compile the monthly jobs report.
“The next thing to watch will be whether the surge in immigration revises up the labor force participation rate when we get the January data in early February,” Pingle notes.
A slowdown in home sales due to high mortgage rates, coupled with the latest figures from RealPage Market Analytics that show a sharp decline in apartment demand — the first since 2009 — point toward fewer households being created. (…)
“Demand for new leases all but evaporated due to low consumer confidence and high inflation,” said Jay Parsons, economist at RealPage Market Analytics, a rental market intelligence platform. “We’ve never before seen a period like this – weak demand for all types of housing despite robust job growth and sizable wage gains.”
Census Bureau data show that more than 1.2 million new households were created on average in the July-September period, the fewest in a year. Fourth-quarter figures are scheduled for release on Jan. 31.
Sluggish household formation risks weighing on discretionary consumer spending, particularly for furniture and other household items. At the same time, a slowdown in demand could help to further cool the pace of inflation. (…)

Not really “sluggish”, up 1.1% YoY in Q3.

Rental Housing Is Suddenly Headed Toward a Hard Landing
(…) Declining rents in 2023 should be the base case at this point, with the only question now being: How far they will drop? And while tenants will cheer this possibility, the worry is that it will destroy the pipeline of new supply for years to come. (…)
The first hints of the downturn showed up just three months ago, after weak apartment demand in the third quarter led to seasonality returning to rental prices.
It’s gotten steadily worse since then. According to Apartment List, rents fell nationally every month in the fourth quarter. Rents falling in the fourth quarter is in-line with the pre-pandemic seasonal norm, but the magnitude of the declines are bigger than what we saw between 2017 and 2019. Rents fell nationally by an average of 0.9% a month in the fourth quarter, versus a 2017-19 average that was half that. In a typical year rents grow by about 3%, so that suggests rents fell by 3% in the last three months of 2022 on a seasonally adjusted annualized basis.
Why has the rental market turned so weak? As rental housing economist Jay Parsons points out, new lease demand cratered in the second half of the year, and was negative for the full year for the first time since 2009.
During the pandemic, there was an explosion in the number of single-person households formed, and they largely moved into apartments, in many cases replacing the people who contributed so much to home-buying demand during the same time. Just as we saw in e-commerce and streaming services, the rental market pulled forward demand from the future. And it took until the second half of 2022 for that demand to be exhausted, leading to fewer lease signings, rising vacancies and falling rents. (…)
The national apartment vacancy rate rose to 5.9% in December, its highest level since April 2021, and has been rising by 0.2% a month recently, according to Apartment List. At that pace the vacancy rate would be at its pre-pandemic level by April.
All this is happening while there are more apartment units under construction than there have been in more than 50 years, which will dump even more supply onto the market. (…)
Just so you know, because the Bloomberg columnist did not care to provide her readers with this rather important data info, the vacancy rate at its pre-pandemic level was 6.4%, still the lowest level of the previous 30 years. With 1.2M new households crated in Q3. Fanny Mae estimated that the U.S. was short 3.8M housing units one year ago. Hard landing? Hardly, at least not so fast.

China’s Export Decline Deepens, Threatening Growth The export boom that carried China’s economy through much of the Covid-19 pandemic has lost momentum, adding urgency for Beijing to seek growth drivers elsewhere as the global economy struggles.
The decline for Chinese exports got steeper in the final month of 2022, falling 9.9% from a year earlier, compared with a 8.7% drop in November, according to data from China’s customs bureau. (…)
Imports fell by a narrower margin in December, down 7.5% from a year earlier and faring better than expectations for a 9% drop.
For all of 2022, shipments from China rose 7% from a year earlier to $3.6 trillion, while imports edged up 1.1% to $2.7 trillion. (…)
China’s Housing Market Will Revive but Might Not Thrive The nation’s housing market, a driver of global growth, will rebound this year. But its foundation is weaker than before the crisis.
(…) Unlike in advanced economies, Beijing didn’t make big cash payments to households during the pandemic. But like that of many other countries, China’s savings rate picked up over the past couple of years. Those excess savings could boost consumption and some will drain into the property market.
China’s messy reopening and skyrocketing Omicron infections—together with the Lunar New Year holiday, which will be in late January this year—mean a full rebound likely won’t come for at least a few months.
But property sales could start to head significantly higher by the latter half of the year, especially against a low base from last year. The value of residential property sold in China fell 28% year over year in the first 11 months of 2022. (…)
For one, while stronger developers will likely muddle through the coming months, many weaker ones that overextended themselves during the boom years—including some massive whales like China Evergrande—won’t. Their unfinished projects—China developers usually sell homes before they are built—will continue to make many potential buyers edgy. State-owned developers like China Overseas Land & Investment will probably perform better than private ones as buyers look for more-certain delivery for their apartments. And speculative and investment demand will likely take longer to come back—although that will also depend on monetary conditions and how well competing asset classes, like equities, perform as the initial reopening jolt fades.
Moreover, a serious longer term structural problem is still looming over the market: a rapidly aging population. Living space per capita has already reached a relatively high level. And in certain areas, especially some smaller cities, the legacy of the boom years means that there are still too many unused apartments. (…)
- The National Bureau of Statistics’ 70-city housing price data suggest the weighted average property price in the primary market continued to decline sequentially in December after seasonal adjustments, driven mainly by house price declines in Tier-3 and Tier-4 cities. The proportion of 70 cities that experienced sequentially higher property prices declined slightly in the primary market while ticking up in the secondary market. (Goldman Sachs)
- Nearly All of Beijing to Get Covid by End of January, Study Finds About 92% of the people in China’s capital will have contracted Covid by the end of January, while 76% had already been infected by Dec. 22
- China is importing “rebranded” Russian oil. (The Daily Shot)
 Source: @JavierBlas
Consensus growth forecasts for 2023
Having been reasonably upbeat at the start of last year, economic forecasters became steadily more pessimistic about the economic outlook for most major economies as 2022 unfolded. However, the past two to three months have seen a little more optimism creep in to the outlook for the US and the Eurozone.
Inflation expectations and the impact of these on monetary policy settings may be at the root of this optimism. Ebbing inflation expectations, for example, have earmarked the outlook for both regions in recent months.
In the meantime it is no coincidence that the UK – where inflation expectations are highest (relative to the US, Eurozone and Japan) – is expected to see a relatively deep recession this year. Japan in contrast – where inflation expectations are the weakest – is expected to see a comparatively high pace of growth.
The evolution of Blue Chip consensus forecasts for GDP growth in 2023

McCarthy Renews Calls for Spending Cuts to Raise Debt Ceiling The House speaker’s call came days after the Treasury Department said the government may not be able to pay its bills by early summer.
EARNINGS WATCH
We have 29 companies in, a 72% beat rate and a +6.6% surprise factor. f the 8 Financials having reported, 5 beat with a +8.0% surprise factor.
However, those 29 companies’ aggregate earnings growth was -6.2% on a +6.9% revenue gain.
Not apples to apples, but the first 35 reports in Q3’22 showed a 69% beat rate and a +6.2% surprise factor. Their aggregate earnings were up 0.7% on a +9.2% revenue gain.
Q4’22 estimates are now -2.2% (-6.6% ex-Energy) vs -1.6% (-6.7%) on January 1.
Q1’23 growth has been revised from +1.4% to +0.5% while full year 2023 is now +3.9% vs +4.4%.
SENTIMENT WATCH
Retail Round Trip: Seems like retail have dumped everything they bought during the heady pandemic stimulus bull/bubble(s). (Callum Thomas)
Source: @MikeZaccardi via @MichaelAArouet

- Make or Break Time: Yes that’s right it’s everyone’s favorite downward sloping trendline chart updated again to the latest price developments. At this point it is literally right on the cusp of a potential breakout (…or fakeout! — not a done deal, and not meaningful until a clean+clear break is established).
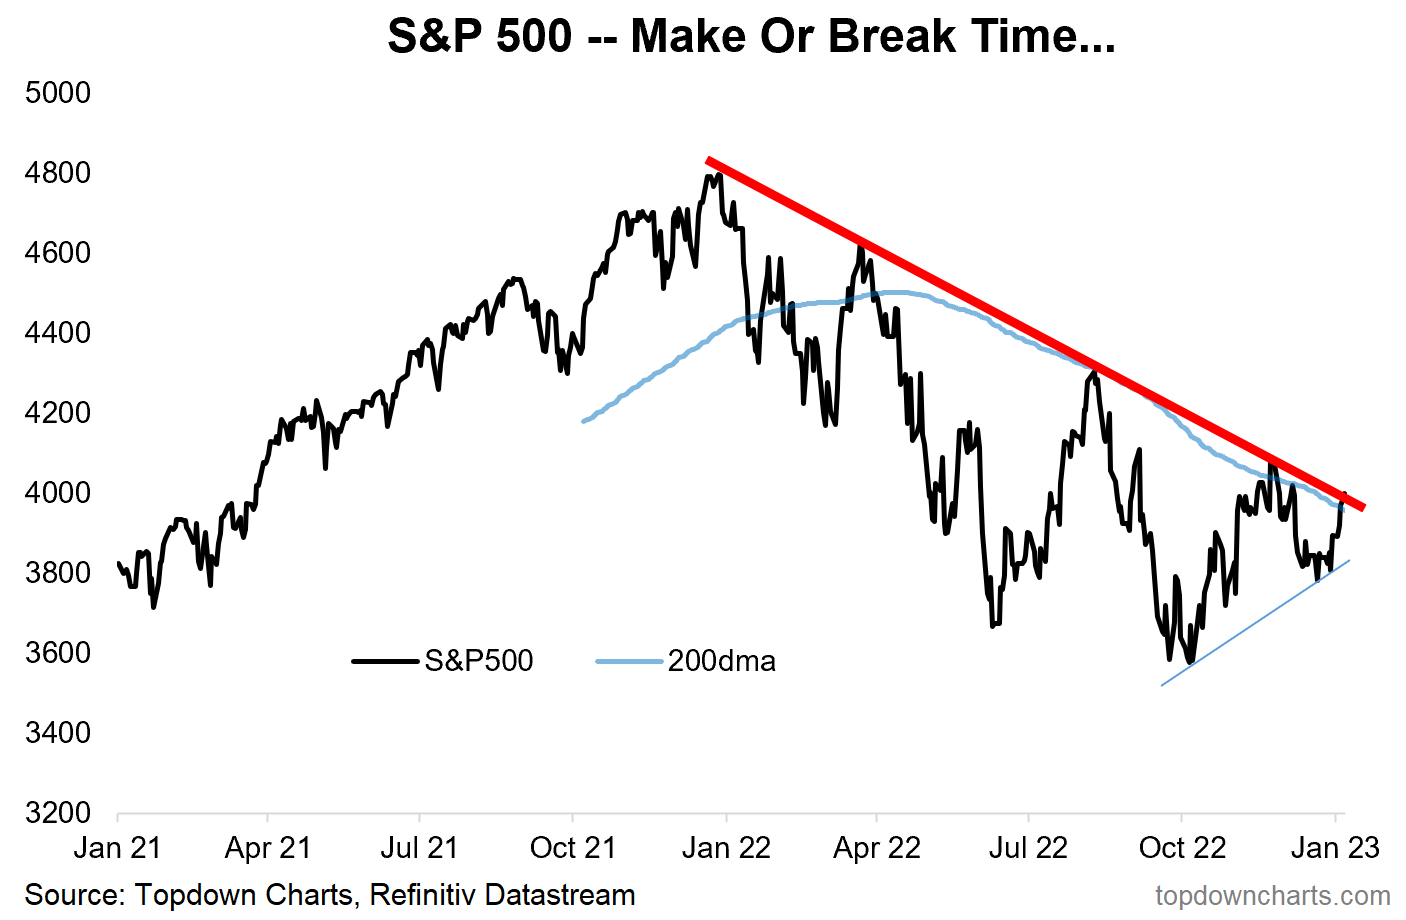
Source: Topdown Charts @TopdownCharts
EVs Made Up 10% of All New Cars Sold Last Year The increase, driven by China and Europe, provided relief to a broader car market that suffered from economic worries, inflation and production disruptions.
While EVs still make up a fraction of car sales in the U.S., their share of the total market is becoming substantial in Europe and China, and they are increasingly influencing the fortunes of the car market there as the technology goes mainstream. (…)
Global sales of fully electric vehicles totaled around 7.8 million units, an increase of as much as 68% from the previous year, according to preliminary research from LMC Automotive and EV-Volumes.com, research groups that track automotive sales. (…)
For the full year, fully electric vehicles accounted for 11% of total car sales in Europe and 19% in China, according to LMC Automotive. Combined with plug-in hybrid vehicles, which can be plugged in to recharge the battery but also have a small combustion engine, the share of electric vehicles sold in Europe rose to 20.3% of the total last year, according to EV-Volumes.com. (…)
In China, which accounted for around two-thirds of global sales of fully electric cars last year, domestic manufacturers are gaining ground on traditional Western auto makers and are also beginning to expand into Europe and the U.S.
Worldwide, Tesla maintained the top spot in a global ranking of manufacturers by sales of all-electric vehicles, followed by Chinese manufacturers BYD Co. and SAIC Motor Corp., and brands belonging to the VW group, according to a study published by Stefan Bratzel, director of the Center of Automotive Management, an automotive-research group in Germany.
The U.S. lags behind China and Europe in the rollout of EVs, but last year auto makers sold 807,180 fully electric vehicles in the U.S., a rise in the share of all-electric vehicles to 5.8% of all vehicles sold from 3.2% the year before. (…)
![]() Here’s a true game changing company: Alitheon. Authenticate every object in your world WITH JUST A PICTURE?
Here’s a true game changing company: Alitheon. Authenticate every object in your world WITH JUST A PICTURE?
FYI:

 Exxon Made Shockingly Accurate Climate Forecasts Decades Ago
The oil company for decades denied the impact that fossil fuels were having on the climate — even as its scientists produced stunningly accurate forecasts of just how much and how quickly carbon emissions were warming the planet. A new study released Thursday examining the company’s climate findings over a 25-year stretch makes that clearer than ever. (…)
Exxon wasn’t alone. Other oil companies, coal companies, utilities and automakers have been studying human-caused climate change for decades and coming to similar conclusions, the new study points out. Few contradicted Exxon publicly. (…)
Leaded gasoline, tobacco redux.