Household Spending Rose in June, Before Delta Upswing U.S. households boosted spending last month, though the current increase in Covid-19 cases related to the Delta variant and higher inflation are injecting uncertainty into the economic outlook.
Personal-consumption expenditures—a measure of household spending on goods and services—increased by 1% last month, the Commerce Department reported Friday, beating economists’ expectations for a 0.7% rise. That followed a downwardly revised 0.1% drop in May, when consumers pulled back on purchases of goods but boosted spending on services.
Friday’s report also showed Americans’ personal income rose 0.1% in June. Still, rising inflation and the latest surge in virus cases could affect future spending trends.
Friday’s report showed that the core personal-consumption expenditures price index—a measure of inflation that excludes often-volatile prices for food and energy—was up 3.5% in June from a year ago, compared with a 3.4% yearly increase in May. (…)
The BEA release is here.

Note that the personal saving rate was 9.4%, down from 10.3% in May and 12.7% in April. Americans continue to dissave. Also, Wages and Salaries rose 0.8% MoM and are up at a 9.5% a.r. in Q2 following +1.6% a.r in Q1. On a YoY basis, Wages and Salaries are up 7.9% in Q2 after +4.0% in Q1 and +1.3% in 2020.
U.S. GDP Growth Disappoints in Q2’21; Economy Exceeds Pre-Pandemic Level
Real GDP of 6.5% (SAAR) during Q2’21 was the quickest since Q3’03, with the exception of the 33.8% Q3’20 rebound from the coronavirus recession. An 8.5% increase had been expected in the Action Economics Forecast Survey. Growth during Q1’21 was revised to 6.3% from 6.4%. Earlier numbers also were revised.
The disappointment in growth last quarter centered on a 1.1 percentage point subtraction due to inventory decumulation. Foreign trade also reduced growth by 0.4 percentage points as a 6.0% gain (18.1% y/y) in exports was outpaced by 7.8% growth (30.8% y/y) in imports. (…)

The inventory effect will reverse in the second half as stocks get rebuilt.

Date: Bureau of Economic Analysis; Chart: Axios Visuals
U.S. Initial Unemployment Insurance Claims Ease; Maintain Recent Range
Initial claims for unemployment insurance fell to 400,000 in the week ended July 24, down from 424,000 the prior week. That earlier number was revised from 419,000 reported last week. The Action Economics Forecast Survey consensus was 385,000 initial claims. The four-week moving average was 394,500, up from 386,500 the prior week. Initial claims are typically volatile in the summer owing to plant shutdowns and school closings.
Initial claims for the federal Pandemic Unemployment Assistance (PUA) program decreased to 95,166 in the July 24 week from 109,868 the prior week; that was revised somewhat from 110,257 reported before. The PUA program provides benefits to individuals who are not eligible for regular state unemployment insurance benefits, such as the self-employed. Given the brief history of this program, these and other COVID-related series are not seasonally adjusted.
Continuing claims for regular state unemployment insurance in the week ended July 17 rose 7,000 to 3.269 million from 3.262 million. That earlier number was revised from 3.236 million. The last three weeks have thus been very steady at 3.265 million, 3.262 million and 3.269 million. The associated rate of insured unemployment held at 2.4% for a fourth straight week, the lowest since 2.1% the week of March 21, 2020, that is, just as the magnitude of the pandemic was becoming evident.
Continued claims for PUA rose to 5.246 million in the week ended July 10; that was the first increase in seven weeks, although the immediately prior July 3 week had a sizable decline of 553,250. Continued PEUC claims also rose, these by 99,167 to 4.234 million, their first increase since June 5. The Pandemic Emergency Unemployment Compensation (PEUC) program covers people who have exhausted their state unemployment insurance benefits.
In the week ended July 10, the total number of all state, federal, PUA and PEUC continuing claims rose 582,403 to 13.156 million, the first increase since the April 24 week. This does maintain the recent lower level, which is down from a high of 33.228 million in the third week of June 2020. These figures are not seasonally adjusted.
Bespoke has the best coverage and chart on claims:

(Bespoke)
U.S. Pending Home Sales Declined in June
Pending home sales fell 1.9% m/m (-1.9% y/y) in June after an upwardly revised 8.3% m/m gain in May (originally 8.0% m/m). Sales continue to be restrained by soaring prices and a near-record low supply of homes for sale.
The June decline was concentrated in the South and West regions. Sales in the South fell 3.0% m/m (-4.7% y/y) and sales in the West slumped 3.8% m/m (-2.6% y/y). By contrast, sales in the Northeast edged up 0.5% m/m (+8.7% y/y) and sales in the Midwest rose 0.6% m/m (-2.4% y/y), their third consecutive monthly increase.
The pending home sales index measures sales at the time the contract for the purchase of an existing home is signed, analogous to the Census Bureau’s new home sales data. In contrast, the National Association of Realtors’ existing home sales data are recorded when the sale is closed, which is likely a couple of months after the sales contract has been signed. In developing the pending home sales index, the NAR found that the level of monthly sales contract activity leads the level of closed existing home sales by about two months.

Commercial-Property Sales Volume Returns to Pre-Pandemic Levels Recovery has been fueled by low interest rates and optimism on fight against Covid-19
(…) Investors purchased $144.7 billion of U.S. commercial property in the second quarter, Real Capital said. Not surprisingly, that was close to triple what it was in the second quarter of 2020, when the pandemic was in its early months and there was widespread investor uncertainty over its economic impact.
Second-quarter sales volume this year also was above the $127.2 billion average between 2015 and 2019, according to Real Capital. This came as a surprise to many observers who had been expecting the pandemic to spark a commercial real-estate sales slump comparable to the one that followed the global financial crisis.
This time, though, commercial property didn’t run into huge liquidity issues thanks partly to the Federal Reserve’s easy-money policies and less leverage in the market, Real Capital said. “Calamity was simply not in the cards for this economic downturn,” the report said. (…)
The multifamily sector has had the largest sales volume this year at $92 billion, particularly garden apartments outside major metropolitan areas. Investors see rents and occupancy levels remaining strong thanks partly to demand from people closed out of the home sales market due to rising prices. “Buyers are saying, ‘I like the strength of tenants, I like the yield here so I am going for it,’” said Jim Costello, Real Capital senior vice president. (…)
But the rebound hasn’t been felt evenly: The pandemic shrunk tenant demand for malls and office buildings. Manhattan, which had the second-highest volume in the first half of 2019, fell to 11th place in the first half of this year. San Francisco fell to 15th place from 10th place, Real Capital said.
Investors have lost their appetite for office buildings because the future of demand has been clouded by the popularity of working from home during the pandemic. Many office tenants have been adopting new workplace strategies that will allow more remote working even after the pandemic. (…)
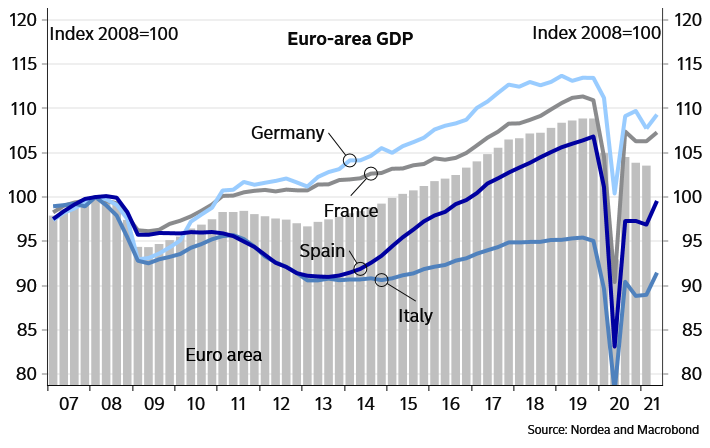
Euro zone growth rebounds, inflation tops ECB target
The European Union’s statistics office Eurostat said on Friday that its initial estimate showed gross domestic product (GDP) in the 19 countries that use the euro had expanded 2.0% in April-June from the previous quarter.
Compared to the same period a year earlier, when lockdowns to slow the spread of the coronavirus brought economic activity close to a standstill, GDP jumped 13.7%.
But unlike the U.S. and Chinese economies, which have pulled above their pre-pandemic peaks, the euro zone economy remains some 3% smaller than it was at the end of 2019.
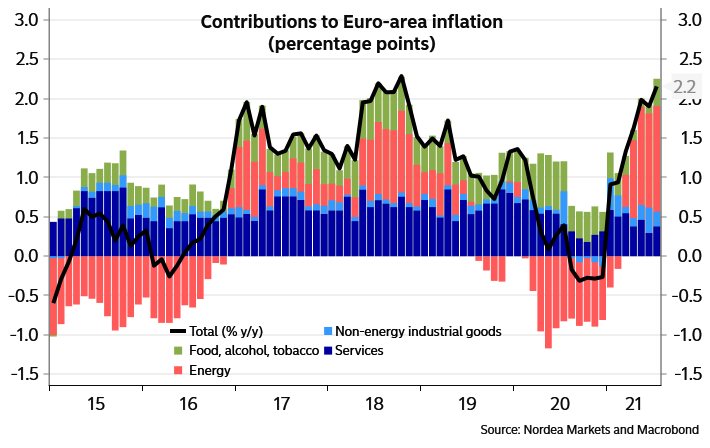
Eurostat also said euro zone inflation accelerated to 2.2% in July from 1.9% in June – the highest rate since October 2018 and above the 2.0% mean expectation of economists.
Economic growth also surpassed a Reuters poll forecast of 1.5% for the April-June quarter and a 13.2% annual increase.
Among the outperformers were the euro zone’s third and fourth largest economies, Italy and Spain, with quarterly growth respectively of 2.7% and 2.8%. Portugal’s tourism-heavy economy expanded by 4.9%. (…)
Figures on Thursday showed the U.S. economy grew at a slower than expected 6.5% annualised rate in the second quarter, pulling GDP above its pre-pandemic peak, as massive government aid and vaccinations fuelled spending on goods and services.
The equivalent euro zone rate was 8.3%. (…)
Without the volatile energy and unprocessed food components, or what the European Central Bank calls core inflation, prices rose 0.9% year-on-year, the same as in June. Economists had expected a dip to 0.7%. (…)
From Nordea:
- Country-level differences continue to be significant
- The Euro-area inflation was driven by the oil price
EARNINGS WATCH
We now have 255 reports in, a 9!% beat rate and a +17.8% surprise factor.
Q3 estimates: +29.6% vs +24.7% on July 1.
Q4 estimates: +21.0% vs +17.3% on July 1.
Trailing EPS are now $180.25. Full year 2021e: $197.47. 2022e: $216.58
Procter & Gamble Co (PG.N) beat quarterly sales estimates on Friday, helped by higher demand for its skin and health care products, but warned that rising commodity and freight costs would take a nearly $2 billion bite out of its earnings this year. (…)
The company forecast fiscal 2022 core earnings per share to rise between 3% and 6%, or about $5.82 to $6.00. Analysts were expecting a full-year profit of $5.90 per share, according to IBES data from Refinitiv.
- Brace for Higher Prices for Ice Cream, Beer and Bottled Water Nestlé, Diageo, AB InBev and Danone all said that sales were rising as key markets rebound from the pandemic, but that the recovery was also leading to rapidly increasing costs for ingredients, packaging and transport.
(…) “We do expect price increases to accelerate from what you saw in the first half,” said Nestlé Chief Executive Mark Schneider. “After several years of low inflation, all of a sudden it accelerated very strongly starting in March and is continuing to accelerate.” (…)
Nestlé said it had raised prices by an average of 1.3% globally in the first six months of the year, driven by North America and Latin America. Prices of its milk-based products and ice cream were up by an average of 3.5%, while its water brands rose 1.6%.
In the U.S., Mr. Schneider said costs for transportation, commodities and packaging were all rising. He also said that labor costs were up significantly, with a tight labor market leading to staff turnover and salary increases. Overall, the company expects input costs to be 4% higher this year. (…)
Competitors Unilever PLC and Reckitt Benckiser Group PLC also flagged pressure on margins in recent days. That is partly because of the lag between having to cover higher input costs and being able to raise prices of their products. (…)
[AB InBev] Chief Executive Michel Doukeris said hedging had protected the company from some of these higher costs so far and that it was now assessing ways to mitigate them as they come through, including by raising prices.
Concerns about the impact of higher costs on the company’s profitability sent shares down as much as 8%.
(…) [Diageo] said its operating margin in North America had declined by 1.24 percentage point, partly reflecting rising costs of agave—a key ingredient in making tequila. (…)
Danone, meanwhile, beat analysts’ forecasts with a 6.6% rise in comparable second-quarter sales but flagged rising prices for milk, plastic, packaging and transportation.
To protect profitability, the yogurt maker said it had increased prices in places such as Latin America, Russia and Turkey where it sells many of its products to independent stores. In North America and Europe, however, raising prices takes more time because more of its products are sold through long-term contracts with major retailers. That means price rises negotiated now will come through in the coming months. (…)
Rising costs are being passed on, fully, partially or with a delay. So far, margins are holding, even rising, thanks to very strong demand/sales. Domestic final sales rose 12.9% YoY in Q2. Such growth rates are truly unsustainable, transitory. We shall see if costs also are…
- Amazon’s New Day Has a Rough Start Amazon’s online stores segment saw revenue grow by only 16% to $53.2 billion in the second quarter, falling well short of analysts’ targets. (…) The midpoint of the company’s revenue projection for the third quarter represents growth of 13% year over year. That would be Amazon’s slowest growth rate in 20 years, even with the pandemic picking back up and possibly driving more sales online.
