Job Gains Eased in Summer Months; Unemployment Increased in August Hiring cooled this summer as employers added 187,000 jobs last month, the Labor Department said. The unemployment rate rose to 3.8%.
U.S. employers added 187,000 jobs last month, while payrolls in June and July were revised down a combined 110,000, the Labor Department said. Over those three months, a modest 150,000 jobs were added monthly on average, down from an average gain of 238,000 in March through May. (…)
Workers’ average hourly earnings rose 4.3% in August from a year earlier, down from 4.4% in July, but well above the prepandemic pace. An increase in hours caused weekly earnings to rise the most since February.
Employers in transportation and warehousing cut staff last month, after trucking company Yellow shut down. Employment in the entertainment industry fell as well, reflecting strike activity. Employment in motion picture and sound recording industries decreased by 17,000, and transportation and warehousing lost 34,000 jobs.
But excluding trucking and motion-picture job losses, payrolls roughly rose by a healthy 240,000, said Stephen Stanley, chief U.S. economist at Santander US Capital Markets. (…)
Between 2015 and 2019, the U.S. economy added 200k jobs monthly on average (range 166-240k).
The participation rate is back to 62.8%, exactly its 2015-2019 average.
The unemployment rate averaged 3.7% in 2019, ending the year at 3.6%, when the Fed funds rate was 1.5%.
Inflation, headline and core, was 2.3% at the end of 2019. On an annualized basis, they were both around 2.0% in the last 2 months.
Hourly earnings rose 3.2% in Q4’19. They gained 4.4% in the last 3 months, both YoY and annualized. But August wages rose at a low 2.9% annualized rate.
Real consumption expenditures grew and average of 2.6% between 2015 and 2019. They rose 2.7% in 2022 and 2.4% in the first 7 months of 2023
Are we back in Kansas?
-
Resilient U.S. Economy Defies Expectations Strong hiring and spending are keeping recession at bay—for now.
Steady hiring and robust consumer spending offer the latest evidence that the pandemic’s effects and the government’s unprecedented policy responses made the economy surprisingly resilient to the Fed’s most aggressive interest-rate increases in 40 years. (…)
The economy has benefited this year from an easing of pandemic-driven labor shortages as more immigrants and native-born Americans join the workforce.
Companies are holding tight to workers and bumping up their pay. Real after-tax incomes rose 3.8% in July from a year earlier and have risen year-over-year each month since January. (…)
Some sectors that are normally very interest-rate sensitive haven’t provided the expected drag on growth this year. Auto production couldn’t keep up with demand in 2020 and 2021 but now is catching up, so it has been less sensitive to higher rates.
Rising mortgage rates delivered a huge blow to housing affordability, which has kept many homeowners frozen in place. That has benefited home builders, who face less competition from resales and who have used stronger balance sheets to offer discounted prices in the form of mortgage-rate “buy-downs.” (…)
Federal funding continues to flow from President Biden’s roughly $1 trillion infrastructure package approved in 2021 and two pieces of legislation signed last year that provide hundreds of billions of dollars to boost renewable-energy production and semiconductor manufacturing. (…)
Economists are divided over the outlook. Some think inflation is now mostly under control as pandemic idiosyncrasies resolve themselves, helped by Fed interest-rate increases. They expect the Fed will cut rates next year, enabling a soft landing.
Others worry that the Fed has either raised rates too much or will have to lift them higher to crush demand and reduce inflation. Restrictive monetary policy could trigger a recession by leading to a sharp pullback in lending and declines in asset values. (…)
One of the biggest differences between now and the pre-Covid years is that the personal savings rate stands at 3.5%, well below its 2015-19 average of 7.6% and its December 2019 rate of 8.3%.
Another important difference is that inflation on essentials (food, energy and rent, 53% of total CPI), which averaged 2.2% between 2015 and 2019 (2.6% in Q4’19), was 5.2% in Q2’23.
Up to mid-2022, wages kept pace with the cost of essentials, but no more. Thankfully (luckily?), CPI-Energy was down 16.4% since mid-2022 while oil prices declined 43%.

Oil prices have since risen 15% with no relief from food nor rent, the latter still up 8.0% YoY and 5.0% a.r. in July.
The last meaningful difference is that interest rates, short and long term, as well as mortgage rates, are up big time. Even credit card rates are now above 20%.
We must hope that the economic resiliency persists against these strengthening headwinds. Maybe just a mild tropical storm. A hurricane would be quite bad given the ill-prepared consumer (low savings).
A breakdown of labor income growth also illustrates the risk to the economy: slower employment and wage growth could meaningfully impact spending power if work hours continue to be reduced.

Employment growth has moderated from 4.3% in 2022 to 2.7% in H1’23 and 2.0% in August. Should real wages, which have stagnated since 2019, turn negative in coming months/quarters, consumer spending would likely slow to a crawl given the low savings rate.

Now that the participation rate (labor availability) has normalized, any slackening in labor demand could upset the Goldilocks scenario, particularly if inflation on essentials, on which the Fed has little impact, remains elevated.
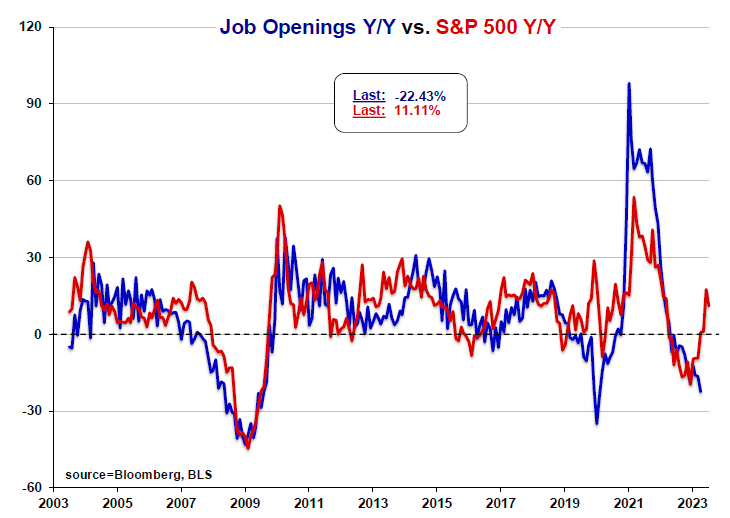
Job openings are still 27% higher than in February 2020 but actual private hires have fallen below their pre-pandemic levels.

In fact, hires have been gradually declining along with openings until last April. In the last few months, hires are down 5.2% but the number of unemployed Americans (black) has reversed a 36-month declining sequence and rose 12.3% (+8.8% in July only).

Meridian Macro Research posted this rather intriguing à-propos chart. FYI, ~0% YoY on the S&P 500 would be ~3600 in September and ~3900 between October and March 2023:
Meanwhile, many Americans now need to take care of their student loans as Goldman explains:
Student loan payments have surged above pre-pandemic levels, with several weeks to go before payments are officially scheduled to resume. (…)
While some borrowers might have resumed monthly payments ahead of schedule, we think the most likely explanation for the surge is that a few borrowers are paying off principal ahead of the payment restart, as interest begins accruing Sep. 1. (…)
A recent poll suggests around half of borrowers are not confident they could make payments once they resume, and a 2022 survey from the Philadelphia Fed showed that only 70% of borrowers making full payments prior to the pandemic expected to make full payments once the pause ended (half of the remainder expecting partial payments). (…)
We previously estimated that the full $70bn increase would subtract 0.8pp from PCE growth in Q4, and while a slightly smaller increase might reduce the hit to consumption, the student loan payment restart should still slow growth in Q4 (we expect growth to slow from 2.8% in Q3 to 1.3% in Q4, before rebounding to 1.9% in 2024).
Hmmm…maybe not good old, tranquil Kansas…
Although:
Goldilocks Is Back as Wall Street’s Jobs-Day Gift BlackRock’s Rosenberg sees ‘a very nice number for everyone’
Slower hourly wage growth. A high unemployment rate, due in part to more participation. Enough job demand to keep recession worries at bay. Check, check and check. (…)
“This was a Goldilocks number,” Sarah Hunt of Alpine Woods Capital Investors said on Surveillance. “You have all the components working in the direction the Fed wants it to go.” (…)
- US Stock Traders Get Back to Believing Everything Is Just Perfect It will take time before rising rates become problematic: BI
(…) “There’s a lot of talk about rising net interest expenses and debt levels,” said BI’s Gillian Wolff. “But given that interest-rate coverage ratios started from such a strong point at the end of 2022, it will take some time before these rising expenses become problematic.” (…)
About a third of the debt in an index tracking investment-grade corporate bonds have maturities of 10 years or more, according to calculations by Bloomberg’s Cameron Crise. (…)
More than 40% of all US mortgages were originated in 2020 or 2021, when borrowing costs were at historic lows. Meanwhile data from the New York Fed show that about 89% of consumer debt is shielded from fluctuating interest rates. (…)
- Larry Summers concurred: “These numbers are consistent with very optimistic scenarios,” the former Treasury secretary said.
But no Canadian Goldilocks. Scenarios can change rapidly:
Canadian growth shocker confirms central bank to pause
Economic activity fell at an annualized rate of 0.2 per cent in the quarter, led by a drop in new construction, a slowdown in consumer spending, and a hit to resource industries affected by wildfires, Statistics Canada said Friday. A preliminary estimate for July shows gross domestic product was essentially unchanged that month, indicating the economy is flatlining as it moves into the second half of the year.
The GDP numbers came in well below both Bank of Canada and Bay Street estimates, of 1.5 per cent and 1.2 per cent annualized growth, respectively, suggesting that higher interest rates may be weighing on economic activity more than previously appreciated. (…)
(…) there were plenty of signs of a more generalized slowdown in Q2, after a strong first quarter. The contraction was led by a 2.1-per-cent drop in housing investment, which included an 8.2-per-cent fall in new construction and a 4.3-per-cent pullback in renovations. Statscan said these declines coincided with the Bank of Canada’s resumption of monetary policy tightening in June, after a five-month pause.
Household spending also slowed in the quarter, growing 0.1 per cent compared with 1.2 per cent in the previous quarter. (…)
“While aggregate household expenditures edged up in the second quarter, spending per capita fell 0.7 per cent. In fact, per capita household spending declined in three of the last four quarters,” Statscan said.
Household demand has been a sticking point for the Bank of Canada, which is actively trying to curb consumer spending on goods and services to slow the pace of price increases. When the bank restarted interest-rate hikes in June, officials called out stronger-than-expected consumer demand as a significant reason for the move.
Other drags on economic activity in the second quarter included a slowdown in business inventory accumulation, which grew at the slowest pace since the fourth quarter of 2021. Trade also weighed on GDP, with imports exceeding exports. (…)
Other data have generally pointed toward a cooling economy. That includes the July jobs report, which showed Canada lost around 6,400 jobs that month, while the unemployment rate ticked up to 5.5 per cent.
Inflation, by contrast, is proving stubborn. Annual Consumer Price Index growth rose to 3.3 per cent in July, up from 2.8 per cent in June. Although there was a slight fall in core measures of inflation that filter out volatile price moves. (…)
NBF Economics adds:
According to the latest CFIB survey, concerns about weak domestic demand rose sharply in August, which is not a sign of a stronger economy in Q3. Moreover, the preliminary estimate for July points to a stagnant economy, which is worrisome given that this is the month when many households received their food rebate from the federal government. Given that real monetary policy is the most restrictive of the G7, we continue to expect economic lethargy over the next 12 months.
Goldman Sachs:
Today’s report suggests that growth in Canada slowed meaningfully after an exceptionally strong Q1. Slower export growth contributed significantly to the growth stepdown but also household spending growth weakened. We think that today’s negative surprise and the ongoing labor market rebalancing will keep the BoC on hold at next week’s meeting, but continue to expect that continued firmness in inflation (and shelter inflation in particular) will induce the BoC to deliver a final hike in October for a terminal rate of 5¼%.
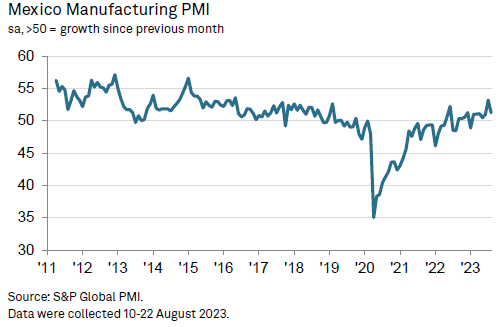
PMIs SUGGEST MORE WEAKNESS IN MANUFACTURING
USA: Sharper contraction of US manufacturing sector in August
The PMI fell to 47.9 in August, from 49.0 in July, indicating a stronger downturn in operating conditions at US goods producers. (…)
The overall deterioration in business conditions was driven by a further decline in new orders. Lower new orders were blamed on a weakening economy and customers being cautious in placing new contracts. The rate of decline accelerated since July to register the second-steepest reduction seen over the past six months. Demand for US produced goods has fallen 13 times in the past 15 months.
Moreover, new export orders contracted for the fifteenth month running. (…)
Also weighing on output in the latest period was a fifth successive reduction in finished goods inventories as companies sought to further manage stock levels lower. (…)
Nevertheless, manufacturers continued to raise employment to support expected growth of workloads. Jobs have risen every month since August 2020, although the latest increase was the slowest since January.
Average input prices rose for the second month running, and at a slightly faster rate, but one that remained well below the long-run survey average. Anecdotal evidence highlighted oil, chemicals, plastics and fuel as being up in price. Higher costs continued to be passed on to customers, as output prices rose at the fastest pace in four months albeit a pace that remained modest overall.

Canada: PMI drops to lowest level for over three years
(…)dropping to 48.0, from 49.6 in July, the index registered its lowest reading since June 2020 and was consistent with a modest deterioration in operating conditions. (…)
The decline in output was the steepest of the year so far, for orders the sharpest since March. Firms widely commented that elevated inflation and clients retaining a cautious attitude to spending was negatively impacting demand. However, sales weakness was primarily focused on the domestic market; new export orders rose modestly and for the second month in a row during August. (…)
Meanwhile, staffing levels were lowered for a fourth month in a row, also at a rate not seen since mid-2020. (…)
On the price front, average input costs rose for a third successive month in August. The rate of inflation also picked up, accelerating to a four-month high amid reports of vendors raising list prices to cover their own cost increases. Manufacturers adopted a similar attitude, pushing up their own average tariffs to the greatest degree since March.

Eurozone: Prices for eurozone goods fall further in August as factory orders continue to plummet at one of the fastest rates on record
The HCOB Eurozone Manufacturing PMI, compiled by S&P Global, registered beneath the 50.0 no-change level for the fourteenth month in a row in August, signalling yet another month-on-month deterioration in operating conditions. At 43.5, the headline index was up from July’s 38-month low of 42.7, but still indicative of another sharp worsening in the health of the euro area manufacturing economy. (…)

According to August data, the volume of new orders received by manufacturers across the eurozone continued to plummet at a rate which has rarely been exceeded across the survey’s 26-year history. This too was the case for new export business, with firms struggling to attract new work from clients beyond their own borders. Total and foreign order book volumes have been weakening on a monthly basis for well over a year, with respective seasonally adjusted indices registering markedly beneath the key 50.0 mark which separates growth from contraction, highlighting the significant weakness in demand conditions facing eurozone factories.
Eurozone manufacturers also recorded a considerable decline in their backlogs of work during August, extending the current sequence of depletion to 15 months and signalling a sustained rise in spare capacity.
(…) input costs fell sharply during the latest survey period. Some companies chose to pass through lower expenses to their selling charges in a bid to boost competitiveness, leading output prices to fall for a fourth successive month.

China: Operating conditions improve for manufacturers in August
The headline seasonally adjusted Purchasing Managers’ Index™ (PMI™) rose from 49.2 in July to above the neutral 50.0 threshold at 51.0 in August. This signalled a fresh improvement in the health of the sector, which has strengthened in three of the past four months. Though only mild, the rate of growth was the best seen since February.

Supporting the improvement in overall business conditions was a renewed increase in new order intakes. Companies indicated that firmer underlying market conditions had helped to boost client spending. The modest upturn in overall sales occurred despite a further drop in new business from abroad in August, suggesting that stronger domestic demand was the main source of growth. The downturn in new export orders did ease compared to July, however, and was only mild.
Companies responded to greater amounts of new work by expanding production during August. Though modest, the rate of output growth was among the best
seen over the past year. (…)The higher cost of some raw materials, including metals, led to a renewed rise in operating expenses during August. Though marginal, the latest data marked the
first upturn in input costs since February. However, competition for new business and client requests for discounts meant that average selling prices fell slightly.


Japan: Slight deterioration in Japanese manufacturing conditions
The headline au Jibun Bank Japan Manufacturing Purchasing Managers’ Index™ (PMI) was unchanged at 49.6 in August to indicate a third consecutive deterioration in the health of the Japanese manufacturing sector, albeit one that was only fractional overall.
There was a slower reduction in new order inflows during August. While firms registered a third consecutive reduction, the rate of contraction was only marginal overall. (…) Similarly, the rate of reduction in foreign demand for Japanese manufactured goods eased to the slowest for 13 months.
Manufacturers commented that inflationary pressures accelerated from July remained historically sharp. Average cost burdens increased at a quicker pace for the first time since September 2022 to reach a three-month high amid ongoing reports of high raw material and labour costs, and exchange rate weakness. Firms sought to protect profit margins however, and increasingly passed rising costs to clients through higher selling prices. That said, output charges were raised at the slowest rate in two years. (…)

Sluggish world manufacturing data amid continued strong U.S. consumer demand for goods indicates that the inventory correction is not complete just yet.
 Source: Chart and data provided by Macrobond
Wards Auto: “Lean inventory, elevated prices and lukewarm incentives, combined with rising interest rates, could be keeping more buyers out of the market.”

- Auto strike looks likely: All signs point to a strike when the UAW’s contract ends Sept. 14. The big question is whether the UAW targets one of the Detroit automakers — or all three at once. (Axios Closer)
SENTIMENT WATCH
Goldman Cuts US Recession Chances to 15% on Improved Inflation It revised its odds down from 20%. Bloomberg consensus is at 60%.
Sputtering Europe and Jittery China Add Bull Case for US Stocks Stagflation risks mount in Europe, China in deflation
Europe’s stagflation crisis and a property downturn in China are flashing a familiar message: for equity investors, there is no real alternative to the US stock market.
(…) higher interest rates threaten to tip Europe into 1970s-style stagflation, with the economy sinking into a downturn and inflation running above 5%. In China, it remains unclear whether drip-feed stimulus can revive an economy in deflation. That’s accelerated an investor exodus from both regions. (…)
China’s Economic Problems Have Flipped the Narrative
(…) “The conventional wisdom seems to be flipping from a concern with the unstoppable rise of Chinese power to a worry about the irrevocable decline of China’s economy and population,” says Richard Fontaine, chief executive of the Center for a New American Security in Washington. That’s also a view that’s been quietly growing within the Biden administration. (…)
-
China’s Country Garden Narrowly Avoids Default The property giant paid $22.5 million in coupons to international bondholders just before the end of a 30-day grace period.
(…) Country Garden has two more dollar-bond coupon payments totaling $55 million in September. It has a $1 billion note due in January next year. It also has a 400 million Thai baht, the equivalent of about $11 million, note maturing late next month. (…) The company also plans to extend the maturities of seven more domestic bonds, according to the person familiar with the matter. (…)
More debt deadlines loom for the builder that has about $187 billion
of total liabilities. (…)
Any stumble by Country Garden, now China’s sixth-largest builder by contracted sales, risks worse fallout than from Evergrande given it has quadruple the property projects.
- Debt Crisis Threatens to Engulf China’s Surviving Developers About two-thirds of 50 major private builders are defaulter. The 16 survivors face $1.5 billion bond payments this month
EARNINGS WATCH
With 497 S&P 500 companies having reported Q2
- 79% beat;
- +7.9% surprise, led by +19.6% from Consumer Discretionary companies;
- Q2 PS YoY: -2.9% vs -5.7% expected; ex-Energy: +3.5%;

- Pre-announcements are very positive. 38 more companies than at the same time during Q2 pre-announced so far: 24 (63%) positive.

- 12 companies pre-announced last week, 9 positive (75%);
- Trailing EPS are now $216.79. 2023e: $221.01. Forward EPS: $232.80. Full year 2024e: $247.09.

Interest Expenses, Coverage Ratio,and Firm Distress
From the Boston Fed last week:
(…) Overall, more than a year into the hiking cycle, firms have weathered the steep increases fairly well; corporate interest expenses did not start to increase until the third quarter of 2022. However, firms face continued risks based on the lagged effects of the interest rate hikes that have already occurred, regardless of future hikes. (…)
Regarding the small floating-rate share of debt, during the COVID-19 pandemic and recovery, firms issued a large volume of bonds, which increased the share of debt that was fixed-rate and extended its average maturity, and thus it has contributed to the delayed and incomplete pass-through during this hiking cycle.
Even though the corporate interest expense ratio is at historically low levels, it did start to increase in the second half of 2023, a potential sign that the steep increase in the federal funds rate since 2021 is beginning to feed through into firms’ cost of borrowing. (…)
Using the full sample of nonfinancial firms in the Compustat database from 1995 through 2019, we estimate the average response of the corporate sector’s interest expense ratio to changes in the FFR. (…) a 1 percentage point increase in the FFR raises the average corporate interest expense ratio by about 0.5 percentage point.
Furthermore, and perhaps most strikingly, the pass-through is gradual and peaks five quarters after the initial 1 percentage point FFR increase. With respect to the current cycle, this finding suggests that most of the interest rate increases still have not fully fed into firms’ interest expenses. The initial rate increase of 0.25 percentage point in March 2022 may have fully passed through into the corporate interest expense ratio, but firms have yet to see the full impact of the subsequent 5 percentage points of rate increases. (…)
We conduct an exercise in which we take the recent monetary policy tightening, coupled with various future corporate income scenarios, and compute the share of debt outstanding in firms that could have an ICR [interest coverage ratio] of less than 4 at the end of this year, that is, firms that could be in violation of their financial covenants and thus at risk of default. (…)
We find that firms’
interest expenses are expected to grow approximately 23 percent by the end of 2023.Finally, we compute the share of debt at risk of default for various income scenarios relative to 2022: no change in income or an increase or decrease by 5, 10, or 20 percent. As a reference point, note that firms’ EBITDA fell roughly 24 percent in our sample during the Great Financial Crisis. The results, shown in Figure 4, point to a significant increase in the shares of debt at risk during this cycle of monetary tightening. The shares are roughly equivalent to those at the onset of the COVID-19 pandemic.
Sources: Compustat, Haver Analytics, authors’ calculations.
Note: This figure shows the projected debt at risk of default (as a share of total debt) under different income
scenarios and assuming there are no additional federal funds rate increases. Projections are computed through
the end of 2023. The baseline projection (blue dashed line) assumes no income change. The different shades
of orange correspond to alternative income scenarios of a plus/minus 5, 10, or 20 percent change in income.
Sources: Compustat, authors’ calculations.
The risk score computes the share of sentences in earning calls that mention terms related
to financing costs (for example, “interest costs,” “debt costs,” “financial expenses”) and risk (for example,
“risky,” “uncertain,” “variable”) and then takes the average of this measure across all firms, except those in
the financial or real estate sectors. To facilitate the interpretation, the risk score is normalized so that it has
a mean of zero and a standard deviation of one in the sample. Sources: NL Analytics: Hassan, Hollander,
Van Lent, and Tahoun, 2019, Compustat, authors’ calculations.


High yield spreads as of Aug 30:

- How Slowing Inflation Can Hit Corporate Profits High inflation helped boost earnings at many companies, but now comes the hangover
The Commerce Department last week reported that after-tax U.S. corporate profits were down 9.4% in the second quarter from a year earlier—a more severe drop than the 2.9% decline in earnings per share registered by companies in the S&P 500, as estimated by Refinitiv.
Some of this difference is a matter of composition: The S&P 500 contains only large, public companies, many of which have operations outside the U.S., while the Commerce Department figures include Federal Reserve banks, which have been losing money as a result of high rates and the Fed’s portfolio reductions.
S&P 500 companies have also reduced their share counts, through buybacks and the like, boosting earnings per share. Indeed, S&P 500 net income was down notably more in the second quarter than earnings per share, falling 5.5%. (…)
Slower economic growth and, in the case of S&P 500 companies especially, a shift in consumer spending back away from goods and toward services, have played a role. But cooling inflation has also cut into earnings, and if it continues, profits could remain under pressure.
Some of this is simply because after a period of prices going up faster than labor costs, lately labor costs have been rising faster—in the second quarter, U.S. employment costs were up 4.5% from a year earlier, according to the Labor Department, while consumer prices were up 4.1%.
Another factor is that inflation made prices for what some companies were holding in inventory go up, so that when they sold them, they booked a fatter profit than they would have if prices weren’t moving. Now, with inflation falling, they are experiencing the hangover.
Whether this happens is a matter of accounting. Companies that use last-in, first-out accounting, or LIFO, can take earnings hits in inflationary environments. This is because under LIFO, they record the cost of inventory at the latest price they paid for those materials in the open market. That raises the cost of goods sold, and lowers profit. But more companies use first-in, first-out accounting, or FIFO, whereby the cost of their oldest inventory is valued first. In an inflationary environment where, in addition to paying higher prices for materials coming in the door, they are also charging customers more for what they sell, profits can get a temporary boost. “That is going to look good for a while and then it won’t,” explains David Zion, head of the accounting and tax-research firm Zion Research Group.
Inflation can also effectively understate the financial impact of wear and tear on companies’ assets because in business accounting depreciation is generally measured at historical cost; after inflation, the actual cost of replacing assets is higher.
The Commerce Department calculates what profits would look like absent changes in inventory valuations, and with depreciation measured at current costs (and in a consistent way). With these adjustments, after-tax profits in the second quarter were just 11.5% higher than they were in the final quarter of 2019. Without these adjustments, profits were up 33%. (…)
Huawei Teardown Shows Chip Breakthrough in Blow to US Sanctions
(…) Huawei’s Mate 60 Pro is powered by a new Kirin 9000s chip that was fabricated in China by Semiconductor Manufacturing International Corp., according to a teardown of the handset that TechInsights conducted for Bloomberg News. The processor is the first to utilize SMIC’s most advanced 7nm technology and suggests the Chinese government is making some headway in attempts to build a domestic chip ecosystem, according to the research firm. (…)
With its export controls last year, the US administration tried to draw a line at preventing China from getting access to 14nm chips, or about eight years behind the most advanced technology. The US had also blacklisted both Huawei and SMIC. Now China has demonstrated it can produce at least limited quantities of chips five years behind the cutting-edge, inching closer to its objective of self-sufficiency in the critical area of semiconductors. (…)
The Mate 60 advance could reset the dynamics of the tech clash, as it suggests Huawei is able to come close to, though not quite match, the fastest mobile devices using a chip that’s designed and produced in China. Testing by Bloomberg News showed the Mate 60 Pro capable of cellular speeds on a par with 5G devices like Apple Inc.’s latest iPhones. (…)
Chinese chipmaking still has a performance gap, as the main processor in the Mate 60 Pro is two generations behind the latest global technology, according to the teardown by TechInsights (…).
Apple’s current iPhones are built at 4nm and next week it will introduce a new flagship iPhone powered by a 3nm chip. (…)
To move beyond 7nm, iPhone supplier Taiwan Semiconductor Manufacturing Co. utilizes extreme ultraviolet lithography, or EUV, machines from ASML Holding NV. China is completely prohibited from importing those machines. (…)
In a report entitled “Huawei Mate 60 Pro: More Myths Than Fact,” the Jefferies team said it thinks China can produce only a “very small” volume of 7nm chips.
Analysts at Sanford C. Bernstein including Mark Li said teardowns suggest that Huawei’s chip speeds were accomplished with advanced packaging and power consumption. China may not be able to make semiconductors as economically as global players, but it’s taking steps toward building supply for its most critical sectors. “We find Huawei’s and hence China’s progress better than expected,” they wrote.
- China to launch $40 billion state fund to boost chip industry One main area of investment will be equipment for chip manufacturing
To Pay for Weight Loss Drugs, Some Take Second Jobs, Ring Up Credit-Card Debts Some people are paying more than $10,000 a year for Ozempic and Mounjaro.
(…) The willingness of consumers to pay thousands of dollars of their own money underscores the public’s appetite for more effective weight-loss medications, especially for people who have long struggled with obesity. The injectable medications can result in patients losing roughly more than 15% of their body weight.
Consumers are paying significant sums out of pocket in large part because insurers are denying coverage for weight loss. In addition, the drugmakers are charging the full list price of a drug instead of offering any of the discounts they give to health plans. (…)
Only 43% of health-plan sponsors cover FDA-approved weight-loss drugs, according to a June report by Pharmaceutical Strategies Group, a pharmacy intelligence and technology company.
Federal statute excludes coverage of anti-obesity medications in traditional Medicare, putting them largely out of reach for many of the roughly 65 million people on the program. Almost 42% of people ages 60 and older are obese, according to the Centers for Disease Control and Prevention. (…)
New research shows the medications have other health benefits. Wegovy cut the risk of cardiovascular events such as heart attack and stroke by 20%, in a study of people who are obese or overweight.
Lower-income people who have higher risks for obesity might be left behind because they can’t as easily afford to pay out of pocket. Medicaid, a program for low-income and disabled Americans, covers some of the newer weight-loss drugs in only about a dozen states, including Pennsylvania and California. (…)