U.S. SERVICES PMIs
S&P Global: Stronger expansion in output, but demand remains fragile.Inflationary pressures at three-year low
US service providers signalled a marginal rise in business activity in October, with growth regaining some momentum following broadly unchanged output in September, according to the latest PMI data from S&P Global. New orders fell again, albeit at a softer pace amid a renewed upturn in new business from abroad. Firms were hopeful of a pick up in demand conditions, however, as business confidence rose to the strongest in four months, encouraging service providers to expand their workforce numbers at a modest pace.
Meanwhile, a relatively subdued sales environment led to reports of discounting in an effort to drive new orders. Firms were better able to offer concessions amid a much slower rise in costs. Input prices and output charges increased at the weakest rates in three years.
The seasonally adjusted final S&P Global US Services PMI Business Activity Index posted 50.6 in October, up from 50.1 in September, but down slightly from the earlier ‘flash’ estimate of 50.9. The latest data signalled a marginal expansion in output at service sector firms, contrasting with a near-stagnation seen at the end of the third quarter. Greater activity was linked to some early signs of recovery in demand conditions, alongside increased capacity, according to panellists.
Nonetheless, a further contraction in new business hampered output growth in October. New orders fell for the third month running, albeit at only a slight pace. High interest rates and inflation reportedly dampened customer demand and reduced purchasing power.
At the same time, new export orders returned to growth, although only fractionally. The expansion of international customer bases reportedly spurred the slight rise in new business from abroad.
Inflationary pressures subsided in October, as service providers recorded slower increases in input costs and output charges. Higher business expenses were often linked to greater salary, utility and supplier costs, but the overall pace of input price inflation eased to the weakest in three years.
Mirroring the trend for input costs, the rate of output charge inflation was broadly in line with its long-run series average, having cooled to the softest since October 2020. Firms continued to pass through higher costs where possible, but increasing requests for concessions and discounts from clients spurred the moderation.
Despite muted demand conditions, firms raised their staffing numbers further at the start of the fourth quarter. The rate of job creation was modest overall, with hiring linked to anticipation of greater output. Some also noted an improvement in their ability to find suitable candidates.
Increased capacity allowed service providers to work through their outstanding business again in October. Backlogs of work were depleted for the fourth month running, albeit at a softer pace.
Finally, business confidence among service sector firms strengthened in October. Positive sentiment in the outlook for output reached the highest since June, as optimism reportedly stemmed from hopes of future interest rate cuts, stronger demand conditions and plans to release new service lines.
A summer-surge in service sector activity, fueled by rising consumer spending, has stalled. Manufacturing is meanwhile also struggling to regain momentum amid weak global demand. As such,the survey data are broadly consistent with GDP rising at an annual rate of around 1.5%.


The ISM:
Economic activity in the services sector expanded in October for the 10th consecutive month as the Services PMI® registered 51.8 percent, say the nation’s purchasing and supply executives in the latest Services ISM Report On Business. (…)
In October, the Services PMI registered 51.8 percent, 1.8 percentage points lower than September reading of 53.6 percent. (…)
The New Orders Index expanded in October for the 10th consecutive month after contracting in December for the first time since May 2020; the figure of 55.5 percent is 3.7 percentage points higher than the September reading of 51.8 percent. (…)
The Prices Index registered 58.6 percent in October, a 0.3-percentage point decrease from the September reading of 58.9 percent. (…)
The services sector continues to slow, with decreases in the Business Activity and Employment indexes. Sentiment among Business Survey Committee respondents’ comments is mixed, with some optimistic about the current steady and stable business conditions and others concerned about such economic factors as inflation, interest rates and geopolitical events. Employment-related challenges are also prevalent, with comments about increasing labor costs, as well as shortages.
WHAT RESPONDENTS ARE SAYING
- “In general, commodity prices are coming down, but some categories, especially labor, are still elevated and will remain so for the immediate future. Suppliers are citing increased labor costs — wages, salaries and benefits — as the biggest reason for their price increases.” [Accommodation & Food Services]
- “Strength in certain construction sectors is leading to continued optimism. (…) Construction]
- “Labor pressures continue, particularly in areas that are hard to recruit. Filling front-line and lower-skill labor positions has gotten very expensive because of competition from large companies and logistics providers. Also, middle management roles are harder to recruit for than they have been in some years.” [Health Care & Social Assistance]
- “We are taking a cautious approach due to the increase in crude oil prices. Capital projects have been slowed or postponed until oil prices stabilize. We expect this approach to continue through fiscal year 2024.” [Management of Companies & Support Services]
- “The general outlook for our organization is less positive than anticipated from the beginning of the year. Performance expectations were revised upward after a strong start to the year, and the results are not expected to be as high as the revised projections. (…)” [Transportation & Warehousing]
- “The UAW strike and potential government shutdown have created risk and caution for our customers who have pulled back on purchases beginning this month.” [Wholesale Trade]
These weak October Services PMIs, out the same day the BLS released its employment report, received little media attention. But they are significant, particularly considering the much weaker employment and wage data for the August to October period after the BLS revised August and September jobs down 101k (-18%).
With a third consecutive month of wage data in the 3.2% annualized range, my consumer income math of October 30th needs downward revision:
The consumer income math: Oct 30 Nov 6
- job components: (jobs + hours) 1.5- 2.0% 0.8 – 1.5% (1.4% last 3 ms, 1.1% last 2, -1.2% in Oct)
- wages: 3.5- 4.5% 3.0 – 4.0% (3.2% last 3 and 2 ms, 2.5% in Oct)
- PCE inflation: 3.0- 4.0% 3.0 – 4.0% (3.8% last 3 ms, 4.4% last 2, 4.3% in Sept.)
- = real labor income 2.0- 2.5% 0.8 – 1.5%
Even the higher end 1.5% growth rate (black dash) is historically very weak, 0.5% is terrible.

“Frankly, the Fed has won the battle of the American consumer—they are slowing down. The question is what happens next.” -Bank of America CEO, Brian Moynihan.
Could savings save the day? Unlikely this time.
The savings rate fell to 3.4% in September, meaningfully lower than the 6.5% pre-pandemic average. It has very, very, very rarely, been lower…

…but even more rarely if we also account for consumer interest payments.
This next chart plots personal expenditures plus interest payments as a % of disposable income. It was 95.4% in September, very uncomfortably high looking at the last 30 years and significantly higher than pre-pandemic levels.

Total spending has already unusually diverged from disposable income (left chart) which is now 4% lower than expenditures. Whatever excess savings (deposits) remain, they are illusory since their purchasing power has been totally eroded by inflation.


Let’s hope the Fed gets near its 2% inflation target quickly and “naturally”, otherwise a recession would do the job.
On April 24, 2023, the PMIs were clearly suggesting a reacceleration of the U.S. economy (Economic Perspectives: Re-Acceleration!).
Now, weak consumer economics indicate difficult demand conditions ahead. The October PMIs confirm the sudden change, across the board, but particularly in services, supposed to take the slack from goods:
Services PMI:
- subdued sales environment
- muted demand conditions
- New orders fell for the third month running
- reports of discounting
- increasing requests for concessions and discounts
Manufacturing PMI:
- demand conditions were historically muted overall, with firms downwardly adjusting their output expectations for the year ahead and cutting employment for the first time since July 2020
- Workforce numbers fell for the first time in 39 months, and at the fastest pace since June 2020, as firms chose not to replace voluntary leavers.
- Efforts to remain competitive and drive sales reportedly constrained pricing power.
- Goods producers ran down their stocks of finished items and purchases again in October. A slower fall in postproduction inventories was in part linked to weaker than anticipated order growth and continued processing of backlogs. Firms also reduced their input buying further.
As good as it gets:

On November 1st, Bloomberg had this other warning:
- Warnings on Weak Demand Are Piling Up This Earnings Season Earnings management calls are plagued with demand concerns
At just over the half-way mark of the reporting period, “weak demand” is among the top trending phrases on earnings calls, according to a Bloomberg analysis of transcripts for the S&P 500 and the Stoxx Europe 600 benchmarks. If the pace of mentions holds for the next few weeks, it would be the most on record, according to data compiled by Bloomberg going back to 2000.
From consumer-facing companies to technology and industrial firms, quarterly reports are reflecting deeper worries ranging from slowing demand to the impact of inflation and higher interest rates on increasingly cost-conscious consumers. (…)
The situation is more pronounced in Europe, where PMI data has been weak and shows no sign of recovery. Separately, while companies have passed on higher costs to consumers for most of the year, things are looking more difficult now, putting pressure on margins.
The [Barclays] strategists said companies seem to have become more cautious on the overall outlook for their respective business demand. They see weakening sentiment from firms reflected in the sharply rising trend in profit warnings this quarter. “With almost half the reporting yet to be done, it could notably end up higher compared to recent quarters,” they added.
(…) “Until real signs of a pickup in demand emerge, companies have no incentive to give aggressive guidance,” they wrote, noting that real sales growth for companies remains negative at -2.5% year-on-year. (…)

Friday, we got the first official tally of S&P 500 pre-announcements. Not bad, so far.

Analysts’ revisions were quite positive in the past 2 weeks…

…even on smaller companies:
Yet, Q4 earnings growth was ratcheted down from +11.0% on October 1 to 7.0% last week, in spite of a Q3 82% beat rate, by +7.0%!.

Trailing EPS are now $218.46. Full year 2023: $220.38e. Forward EPS: $237.20e. Full year 2024: $245.75e.
Maybe productivity will protect margins.

Unit Labor Costs
But those Q3 numbers came with GDP growing 4.9% (2.9% YoY). Nominal GDP rose 8.7% QoQ in Q3, 6.3% YoY. Better not to extrapolate…
This chart plots the YoY changes in job openings and S&P 500 trailing earnings. Analysts’ current expectations for earnings growth turning positive is not supported by trends in job openings, still down 14% YoY. Indeed job postings are also down 14.6% through October 20.

One could sensibly argue that profits actually lead job openings, but that would mean that demand for workers will soon be rising, which is not what the FOMC is aiming at currently.
Retail anecdotes via The Transcript:
- “…we have experienced an unexpected accelerated decline in our comparable store sales from the lagged effect of these policies in the early part of the fourth quarter of 2023..To take this into account, we have updated our 2023 sales and earnings guidance, which now reflects the potential that the accelerated decline in our comparable store sales could be sustained for the remainder of the fourth quarter” – Floor & Decor Holdings ($FND ) CFO Brian Langley
- “…we had expected to see improvement in the second half of the year. But based on what we are seeing today that is not likely to be the case. Instead, we expect wholesale demand across our brands to remain pressured. As such, we are revising our fiscal year 2024 outlook and now expect sales to be down from a high-teens to low-20s percentage versus fiscal year 2023.” – Malibu Boats ($MBUU ) CEO Jack Springer
- “…we started to see more intense macro pressure on our business related to spend late in the quarter, and that has continued through October. As a result of higher interest rates and tighter credit markets, capital and cash have become less affordable and available for SMBs. Some of our larger businesses have scaled back their spend while both customers and their suppliers became more selective with their payment choices. Business behaviors changed rapidly in this respect…what we saw late in the quarter and continued to see into October, is that the discretionary spend of the large businesses is getting more scrutiny today” – Bill Holdings ($BILL ) CEO Renè Lacerte
Canada: Signs of weakening labour market continued in October
While the population continues to grow at a breakneck pace, hiring simply isn’t keeping up. As a result, the unemployment rate has been rising sharply since last April, and now stands at 5.7%. Since its cyclical low of 4.9%, the unemployment rate has thus risen by 8 tenths. Since the 1980s, an increase of this scale has not been seen outside of a recession and the bursting of the tech bubble in 2001 (left chart).
Extremely restrictive monetary policy has dampened demand to such an extent that companies no longer perceive a labour shortage, if various surveys are to be believed. This is reflected in private sector hiring, which has stagnated in recent months.
The details of the report are no more reassuring, with the public sector being the only segment to generate jobs in October. Moreover, full-time employment is treading water, while hours worked are stagnating.
Given the downward trend in profits in Canada over the last four quarters, and the gloomy sales outlook (right chart), it’s a safe bet that the profitability issue is likely to push the unemployment rate even higher over the next 12 months.
In our view, this morning’s report confirms that the Bank of Canada was right to keep rates unchanged at its last decision, and that even this summer’s rate hikes were perhaps unnecessary. The rate hikes implemented since the beginning of the monetary tightening have yet to have their full effect on the economy, suggesting a bumpy road ahead.
- Canadi an employment increased 18K in October, below consensus expectations for a 25K increase. Meanwhile, the participation rate remained unchanged at 65.6%. As a result, the unemployment rate increased two ticks to 5.7%, one tick above consensus expectations.
- The increase in employment stemmed exclusively from part-time jobs (+21K), while full-time positions were down (-3K).
- Employment in the private sector was steady in the month (+0.2K), while it increased in the public (+19K) sector.
- Hours worked were unchanged in October following a -0.2% decrease in September.
- Wage inflation was 5.0% on a year-over-year basis in October (down from 5.3% in September).


- Retailers brace for drop in holiday spending as stretched Canadian consumers pull back Subscriber content Deloitte Canada expects Canadians will spend 11 per cent less this holiday season than last year, amid concerns about a recession and their personal finances
(…) That total decrease is offset by higher expected spending on travel during the holidays; spending on gifts will actually decline more sharply, by 18 per cent, according to Deloitte. In a survey of more than 1,000 Canadians, 77 per cent reported that they will be shopping around, visiting more stores and e-commerce sites than they did last year, to search for better deals.
“We had a bit of a soft back-to-school season as well. So that’s another indicator of what’s to come for the holidays,” said Marty Weintraub, national retail consulting leader at Deloitte Canada.
Softening consumer demand is one piece of the puzzle. Another is supply. Some retailers, and the manufacturers that make the products they sell, are still working through a glut of inventory.
“There’s a ton of it, because everybody ordered for the old supply-chain challenges – knowing you had to order 130 per cent to get 80 per cent,” said Peter Hlynsky, who was recently promoted to the role of CEO at outdoor recreation retailer MEC. As factories caught up, “all of a sudden, you’re flooded with inventory.” (…)
Canadians are now spending almost 10 per cent more on essentials compared with a year ago, according to recent data from Royal Bank of Canada. As a consequence, people are cutting back where they can. RBC noted declines in both nominal retail sales and inflation-adjusted retail spending excluding auto, in September.
“As the sun sets on the summer 2023 spending spree, Canadians have started to pare back,” the RBC report noted.
One early sales event may provide a barometer for a tricky holiday retail season. Amazon’s Prime Big Deal Days event in October offered up discounts – but Canadians still held back. According to data from software and analytics firm Salesforce, online sales declined by 12 per cent in Canada over the two-day event, compared with a 1-per-cent decline in the U.S. (…)
![]() Niall Ferguson:
Niall Ferguson:
The War on Hamas Spells Trouble for the War on Inflation
(…) The economic consequences of wars are a topic I’ve devoted a significant part of my career to thinking about. There aren’t many papers about how to invest in the event of a world war. Mine is one of the few. Takeaway No. 1 is that big wars are inflationary. You don’t want to own bonds, especially not those issued by the losing side.
Of course, it is possible that the new war in the Middle East will not be big. (…) On a one-month time horizon, markets seem to think this is just another Gaza episode. (…)
This complacency is surely delusional. For reasons I have discussed elsewhere with my colleague Jay Mens, the base case must be that this war escalates. The Hamas-Palestinian Islamic Jihad atrocities were primarily intended as a provocation intended to suck the Israel Defense Forces into Gaza’s godforsaken streets and tunnels, increasing Israel’s vulnerability to attacks on other fronts.
Those attacks are already underway. There are missiles being fired by Hezbollah from Lebanon. There are militias gathering in Syria with their eyes on the Golan Heights. The Houthis of Yemen are attacking Israel, too. Meanwhile two US aircraft carrier strike groups have converged on the Eastern Mediterranean. And US military bases in the region are under regular attack, with dozens of American soldiers suffering serious injuries.
I struggle to see why Israel’s enemies would suddenly call the whole thing off. It is going much too well — especially the global propaganda campaign to represent the Palestinians as the innocent victims of “settler colonialism.”
Moreover, as Martin Wolf reminded us last week, the Middle East remains “far and away the world’s most important energy producer,” with 48% of global proved reserves and 33% of production last year. Oil still accounts for more than 30% of global primary energy consumption and a fifth of the world’s supply passes through the Strait of Hormuz. True, the world is less reliant on oil shipped from the Persian Gulf than it was in the 1970s, because total global output is less oil-intensive, and US domestic production has recovered. But military escalation that (for example) leads the US to carry out retaliatory strikes against Iran — or merely to toughen up its sanctions regime — would be bound to disrupt at least some of the 1.5 million barrels of oil that Iran now exports every day.
The World Bank estimates that any conflict that reduces Gulf exports by 2 million barrels a day (which is 2% of global supply) would raise oil prices to between $93 and $102 a barrel. A major war that reduced exports by 6 to 8 million barrels a day would drive oil up to somewhere between $141 and $157. Natural gas prices are already up by more than a third since the war began. (…)
Now, (…) let me reassure you: 2023 is not 1973. One obvious difference is that the context today is dollar strength, not weakness as in 1973. A second crucial difference is the likely scale of any oil embargo. According to media reports soon after the Gaza attacks, Iran (3% of global supply) proposed imposing an embargo on Israel (0.2% of global demand.)
In 1973, by contrast, the Arab world accounted for 30% of global supply and the US and the future European Union countries 55% of global demand. In 1973, there was not the slightest prospect of normalization between Israel and the Arab states. Today, it is almost inconceivable that Saudi Arabia would contemplate an all-out oil embargo against the US.
No, 2023 is not 1973. Oil prices are not going to quadruple. On the other hand, as Henry Kissinger said in a seminar I attended two weeks ago, in some ways the present strategic situation is worse, in that the positions of both Israel and the US are militarily and politically weaker today than then.
In 1973, the Egyptians had a limited territorial goal, namely recovery of the Sinai. Their leader, Anwar Sadat, saw the war as a way to break the diplomatic deadlock and convince the Israelis (and the Americans) that peace negotiations with him were worth pursuing. The situation today is in some ways more like that of the conflict over Israel’s founding in 1948. Israel’s enemies are aiming at its delegitimization and ultimately its destruction.
In 1973, Israel had to contend with conventional Arab armies with Soviet tactics and arms. Today, the enemies are terrorists, militias and popular movements that use the entire spectrum of warfare, though they too have the backing of at least one state, Iran, and perhaps less visible support from Russia. In 1973, the surrounding countries were relatively stable. Today, there are four failed or failing states in the vicinity: Iraq, Lebanon, Syria, and Yemen.
In 1973, the principal rival of the US, the Soviet Union, was closely linked to the Arab states and was clearly complicit in their attack on Israel. Today, the principal rival of the US is China. It is only indirectly supportive of the Palestinian cause, a) in the public statements of its foreign minister, Wang Yi, b) as a major buyer of Iranian oil and c) as a close confederate of Russia.
In 1973, the crisis in the Middle East came after major US diplomatic breakthroughs the year before (the opening to China, the first Strategic Arms Limitation Treaty, and “peace is at hand” in Vietnam). But détente went south after 1973 as South Vietnam (and Cambodia) succumbed and the Soviet Union and Cuba began to exploit opportunities for mischief in southern Africa.
Much therefore depends on whether China decides to seize the opportunity presented by the conflicts in Ukraine and Israel to make its move against Taiwan.
A trip to Singapore last week gave me a chance to sound out some well-informed Chinese scholars and investors on this question. The consensus was that an imminent showdown over Taiwan is not likely. As one eminent Chinese economist told me, “Xi Jinping is not at all like Putin. He is very cautious, very risk-averse.” (…)
Where I found more consensus in my recent travels was on the Federal Reserve’s decision last week to extend its “pause,” leaving the federal funds rate unchanged at 5.25%-5.5%. There is widespread skepticism among former central bankers about the wisdom of this decision, particularly in the context of a wildly unrestrained US fiscal policy.
We are in the second act of the post-pandemic inflation. The first round of goods and energy inflation was created by outsized fiscal and monetary support to a supply-constrained economy concurrently experiencing an energy shock. These price increases passed through to inflation expectations, asset prices and wages, driving the second round of inflation in services.
The first wave of inflation has come and gone. However, despite the Fed’s decision to hold rates, the second round is not yet over. Measures of growth, consumption and wages are all printing at levels that clearly indicate above-target inflation.
By holding rates while the economy continues to run hot, the Fed may be making another mistake — not perhaps as big as the mistake it made by standing pat in 2021 and early 2022, but potentially as destructive of confidence in price stability.
Now add the Middle Eastern crisis to this mix. If this war escalates even modestly, there is a good chance that oil rises above $100. Such a 20% rise in oil prices could add around 0.5% to headline CPI. In that scenario, this week’s dovish language from the Fed will look as imprudent as Krugman’s tweet.
History has two very clear lessons for economists and central bankers alike — and they are conveniently packaged in new research papers by, respectively, the International Monetary Fund and Deutsche Bank. The main lesson from the excellent IMF paper is that inflation is harder to beat than the Fed model is telling you. Reviewing more than 100 inflation episodes in advanced and emerging economies since 1970, the authors note that “most unresolved inflation episodes involved ‘premature celebrations.’” Money quotes:
Only in under 60% of episodes in the full sample was inflation resolved within 5 years after a shock. Even then, disinflation took on average over 3 years. … The historical outcomes were worse following the terms-of-trade shocks associated with the 1973–79 oil crises … In about 90% of unresolved episodes … inflation declined materially within the first three years after the initial shock, but then either plateaued at an elevated level or re-accelerated.
The lesson from the equally enlightening Deutsche Bank paper on “The History and Future of Recessions” is an equally uncomfortable one for those who still fantasize about immaculate disinflations, soft landings and bright, shiny unicorns.
Looking at recessions in developed economies as far back as the data will allow, the authors argue that we are coming to the end of a period notable for its lack of recessions. The US, Germany and France have suffered only four since 1982. But that is because monetary and fiscal policy have been repeatedly used by governments to avert or mitigate economic downturns. Unfortunately, those days are gone because inflation is back and debt is reaching unsustainable levels.
The Deutsche team provide four key precursors of recession:
Inflation increasing 3 percentage points over a rolling 24-month period;
The yield curve inverting;
Short-term rates increasing 1.5 percentage points over a rolling 12-month period;
Oil increasing 25% over a rolling 12-month period.
When all four are present, the chance of a recession in the US is three in four. The bad news is that all are present today. Oh, and the Deutsche report adds laconically, “recessions are the major source of drawdowns in equity markets and rallies in bonds through history.”
The war in the Middle East is not over. Nor, pace Krugman, is the war on inflation. And winning it will ultimately cost quite a lot.
FYI:
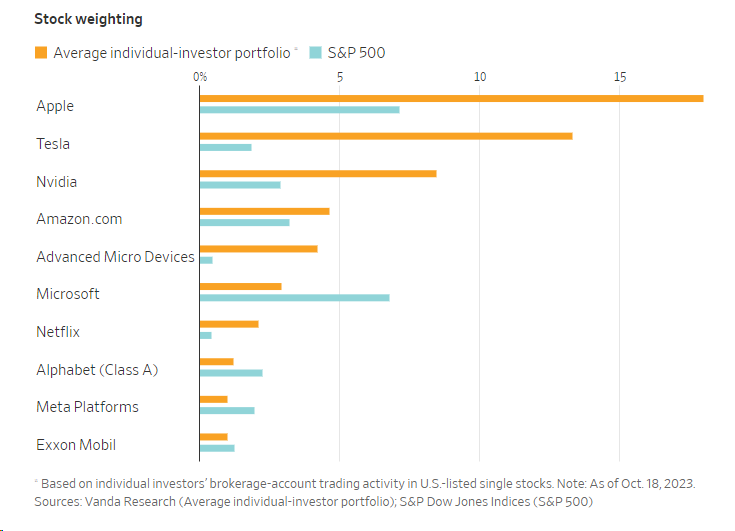
- Nearly 40% of the average individual investor’s portfolio is now in just 3 #stocks!!! What a colossal change in risk taking from the #bullmarket’s beginning in 2009. (@RBAdvisors)
- Lopsided Markets: The top 10 stocks of the S&P500 were responsible for *more than* all of the returns of the S&P500 year-to-date. Massive outlier, and simply unprecedented.

Source: @Todd_Sohn via @NateGeraci