The enemy of knowledge is not ignorance, it’s the illusion of knowledge (Stephen Hawking)

It ain’t what you don’t know that gets you into trouble. It’s what you know for sure that just ain’t so (Mark Twain)

Invest with smart knowledge and objective odds

THE DAILY EDGE: 5 June 2024

US Job Openings Fall to Lowest Since 2021 in Broad Cooldown

US job openings fell in April to the lowest level in over three years, consistent with a gradual slowdown in the labor market.

Available positions decreased to 8.06 million from a downwardly revised 8.36 million reading in the prior month, the Bureau of Labor Statistics Job Openings and Labor Turnover Survey, known as JOLTS, showed Tuesday. The figure was below all estimates in a Bloomberg survey of economists.

The decline helped lower a ratio closely watched by the Federal Reserve — the number of vacancies per unemployed worker — to the lowest level in nearly three years.

The pullback was fairly broad. Vacancies in health care fell to the lowest in three years, while those for manufacturing dropped to the lowest since the end of 2020. Demand for government jobs also weakened. (…)

The rate of hiring and layoffs were both unchanged. While layoffs remain historically low, hiring has slowed down, suggesting companies are comfortable that their staffing levels are appropriate to meet demand.

The so-called quits rate, which measures people who voluntarily leave their job, held at the lowest level since 2020. The recent decline could indicate that people are holding onto their current jobs because they feel less confident in their ability to find a new position.

The ratio of openings to unemployed people eased to 1.2, the lowest since June 2021. The figure — which Fed officials pay close attention to — has eased substantially over the past year. At its peak in 2022, the ratio was 2 to 1. (…)

Indeed Job Postings lead the JOLTS to the 8M range. This leading indicator is down another 5% in the past month (through May 30).

Two more things:

  1. The leaders of job growth this year (private education/health services, government and leisure/hospitality) led the decline in openings.
  2. March’s figure was downwardly revised by 133k to 8.355 million, confirming waning labor market momentum.

BTW, the ratio of openings to unemployeds, at 1.24, is back to its October 2019 level.

SERVICES PMIs

The U.S. PMIs are out later this morning.

Eurozone economy grows at fastest rate in a year as inflation cools

The seasonally adjusted HCOB Eurozone Composite PMI Output Index increased in May, as has also been the case throughout 2024 so far, to a one-year high of 52.2, from 51.7 in April. Overall, this indicated the strongest increase in euro area economic activity since May 2023, and one that was only narrowly softer than seen on average since data were first available in 1998.

clip_image002

Of the top-four eurozone economies, France was the outlier in May as a marginal and renewed contraction in private sector activity contrasted with growth in Germany, Spain and Italy. Spain’s position as the top performer was solidified as economic growth here was sharp, quickening to a 14-month high. The bloc’s largest economy, Germany, also registered a marked upturn, with output volumes rising at the fastest pace for a year. On the other hand, Italy’s expansion lost momentum, cooling to its weakest since February.

Stronger demand conditions were a key reason behind May’s upturn in business output across the euro area. Total new order intakes rose for a second month in succession and at the quickest rate since April 2023. Sector data highlighted a further pick-up in demand for services, while the downturn in factory orders cooled markedly from the previous month. The latest survey data suggested that improved sales performances were restricted to domestic markets, as new business received from abroad declined, in line with the trend since March 2022.

Confidence in the year-ahead outlook for business activity strengthened further in May after April’s fractional setback. Overall, growth expectations have improved in seven of the last eight months. The level of positive sentiment was at its highest since February 2022 and well above its long-term average.

Amid stronger optimism and a sustained uplift in new business, eurozone companies raised employment for a fifth consecutive month. The rate of job creation matched that seen in April and was therefore the joint-fastest since June 2023. The service sector was again the driving force behind recruitment in May as factory workforce numbers shrank.

There remained no evidence of operating capacities becoming stretched by the recent uptick in sales, according to the HCOB PMI survey, as backlogs of work decreased for a fourteenth month running. The rate of backlog depletion was only mild, however, as the level of work-in-hand at services companies stabilised.

Meanwhile, prices gauges signalled cooling inflationary pressures across the eurozone midway through the second quarter.

However, the increase in input costs remained sharp and well above its pre-pandemic average. It was a similar picture for output prices – the rate of inflation in selling charges eased to a six-month low, but remained considerably steeper than that seen on average prior to 2020. Manufacturers continued to register reductions in both of the survey’s pricing measures, whereas services companies registered historically sharp rises.

The HCOB Eurozone Services PMI Business Activity Index signalled another solid increase in activity across the largest sector of the euro area’s economy midway through the second quarter. Posting 53.2 in May, the index was broadly unchanged from April’s 11-month high of 53.3.

Another solid expansion in services activity was aided by a stronger increase in new business inflows. Demand for eurozone services rose at a solid pace that was the fastest in a year. Employment levels were subsequently lifted – the fortieth straight month that this has been the case – with the rate of job creation at its fastest since June 2023.

Service sector companies in the eurozone were able to manage their workloads efficiently, as indicated by broadly unchanged backlogs of work during May.

Pricing pressures across the eurozone services economy remained elevated, despite cooling. Rates of input cost and output charge inflation eased to their slowest for three years and seven months, respectively.

Looking ahead, expectations for services activity in the year ahead turned more positive during May. Overall, the level of business optimism was at its highest since February 2022.

Commenting on the PMI data, Dr. Cyrus de la Rubia, Chief Economist at Hamburg Commercial Bank, said:

“The spectre of recession is off the table. This is thanks to the service sector, where the upswing has recently broadened. In Germany, we can now talk of an upward trend, Italy’s business activity remains solid, and Spain has improved from an already strong position. Only France has experienced a setback, slipping into slightly negative territory. Overall, the service sector is likely to ensure that the Eurozone will show positive growth again in the second quarter. This is evident from the Composite PMI and our GDP Nowcast, which takes the PMI into account.

“New business in the service sector is gaining momentum. The corresponding index has been rising since last November, and order intakes have been increasing for three months. This is complemented by steady employment growth and future expectations, which have brightened considerably.

“France appears to be an outlier among the four leading Eurozone economies with its weak economic performance. However, new business is growing slightly faster than in the previous month, bringing France more in line with the other economies. We are confident that the Eurozone’s second-largest economy will not curb the region’s overall growth during the coming months.

“The European Central Bank (ECB) is getting a tailwind from the PMI. The PMI price components for the service sector indicate a slight easing of inflationary pressures, making an ECB rate cut on June 6 more likely. Reduced inflation pressures are evident in both costs and selling prices. This development is expected to be explicitly mentioned in the press conference by ECB President Christine Lagarde, countering the unexpectedly sharp wage increases reported for the first quarter. However, the PMI price indices do not yet give the all-clear, as they are unusually high in the context of the rather weak economic situation.”

ECB’s Inflation Challenge Looks More and More Like the Fed’s Rate cut this week not in question, but path beyond unclear

(…) May’s inflation reading for the 20-nation euro area provided the latest warning sign for the ECB, accelerating by more than anticipated to 2.6% from a year earlier. Even more worrisome for officials were the surge in services prices and the unexpected strengthening of underlying pressures. (…)

Image

China: Services activity growth fastest in ten months

The seasonally adjusted headline Caixin China General Services Business Activity Index climbed to 54.0 in May, up from 52.5 in April.This signalled an expansion in activity for a seventeenth consecutive month and at the fastest pace since July 2023.

image

Underpinning the latest acceleration in services activity growth was faster new business inflows. Incoming new work increased at the quickest pace since May 2023 and solid overall. Likewise for export business, the rate of expansion was the most pronounced in a year. Anecdotal evidence pointed to improvements in domestic and external market conditions, alongside the launch of new products as factors helping to drive the rise in new work.

image

As a result of growth in new business and activity, staffing levels expanded for the first time in four months. The rate of employment growth was marginal, but the fastest since September 2023. Additional staff were hired in May to cope with ongoing workloads according to panellists. This was effective as the level of backlogged work continued to decline in May, albeit only marginally.

Turning to prices, average input costs increased in May, extending the sequence of inflation to just under four years. The rate of inflation accelerated to a level comparable with the long-run average in April to the fastest in 11 months. Rising input material, labour and transport costs were mainly mentioned by survey respondents as factors for the rise in input prices.

Consequent of rising input cost inflation, Chinese service providers opted to share their increased cost burdens with clients. This resulted in the fastest increase in average prices charged since January 2022. The rate of inflation was moderate, but nonetheless above its pre-pandemic average.

Finally, sentiment remained positive in the Chinese service sector in May. That said, confidence levels fell to a seven-month low amid rising concerns over the global economic outlook and inflation.

Commenting on the China General Composite PMI® data, Dr. Wang Zhe, Senior Economist at Caixin Insight Group said:

“In May, the Caixin China General Composite PMI measured 54.1, up 1.3 points from the previous month and continuing to hit the highest level since last May. Growth in supply and demand int he manufacturing and services sectors picked up pace, with a particularly strong increase in services demand. Exports in both sectors improved amid market optimism. Employment in the services industry shifted from a decline to an increase, driving the index at the composite level into expansion for the first time in nine months.

“Currently, China’s economy is generally stable and remains on the road to recovery. This is especially evident from the expectation-beating growth in industrial production in April. The economy’s performance is consistent with the Caixin manufacturing PMI, which has remained in expansionary territory for seven consecutive months. (…)

image

Bloomberg:

The private survey result provided investors with a respite from worries stoked by official data published last week showing only moderate growth in the services sector in May and an unexpected shrinkage in the manufacturing industry. A Caixin poll of Chinese manufacturers, published Monday, also indicated solid expansion in factory activity last month.

The state of AI in early 2024: Gen AI adoption spikes and starts to generate value A McKinsey survey.

In the latest McKinsey Global Survey on AI, 65 percent of respondents report that their organizations are regularly using gen AI, nearly double the percentage from our previous survey just ten months ago. Respondents’ expectations for gen AI’s impact remain as high as they were last year, with three-quarters predicting that gen AI will lead to significant or disruptive change in their industries in the years ahead.

Organizations are already seeing material benefits from gen AI use, reporting both cost decreases and revenue jumps in the business units deploying the technology. The survey also provides insights into the kinds of risks presented by gen AI—most notably, inaccuracy—as well as the emerging practices of top performers to mitigate those challenges and capture value.

Interest in generative AI has also brightened the spotlight on a broader set of AI capabilities. For the past six years, AI adoption by respondents’ organizations has hovered at about 50 percent. This year, the survey finds that adoption has jumped to 72 percent. And the interest is truly global in scope. Our 2023 survey found that AI adoption did not reach 66 percent in any region; however, this year more than two-thirds of respondents in nearly every region say their organizations are using AI. Looking by industry, the biggest increase in adoption can be found in professional services.

Also, responses suggest that companies are now using AI in more parts of the business. Half of respondents say their organizations have adopted AI in two or more business functions, up from less than a third of respondents in 2023. (…)

The average organization using gen AI is doing so in two functions, most often in marketing and sales and in product and service development—two functions in which previous research determined that gen AI adoption could generate the most value—as well as in IT. The biggest increase from 2023 is found in marketing and sales, where reported adoption has more than doubled. Yet across functions, only two use cases, both within marketing and sales, are reported by 15 percent or more of respondents.

Compared with 2023, respondents are much more likely to be using gen AI at work and even more likely to be using gen AI both at work and in their personal lives. The survey finds upticks in gen AI use across all regions, with the largest increases in Asia–Pacific and Greater China. Respondents at the highest seniority levels, meanwhile, show larger jumps in the use of gen Al tools for work and outside of work compared with their midlevel-management peers. Looking at specific industries, respondents working in energy and materials and in professional services report the largest increase in gen AI use. (…)

For the first time, our latest survey explored the value created by gen AI use by business function. The function in which the largest share of respondents report seeing cost decreases is human resources. Respondents most commonly report meaningful revenue increases (of more than 5 percent) in supply chain and inventory management. For analytical AI, respondents most often report seeing cost benefits in service operations—in line with what we found last year—as well as meaningful revenue increases from AI use in marketing and sales. (…)

The latest survey also sought to understand how, and how quickly, organizations are deploying these new gen AI tools. We have found three archetypes for implementing gen AI solutions: takers use off-the-shelf, publicly available solutions; shapers customize those tools with proprietary data and systems; and makers develop their own foundation models from scratch. Across most industries, the survey results suggest that organizations are finding off-the-shelf offerings applicable to their business needs—though many are pursuing opportunities to customize models or even develop their own.

About half of reported gen AI uses within respondents’ business functions are utilizing off-the-shelf, publicly available models or tools, with little or no customization. Respondents in energy and materials, technology, and media and telecommunications are more likely to report significant customization or tuning of publicly available models or developing their own proprietary models to address specific business needs. (…)

Gen AI is a new technology, and organizations are still early in the journey of pursuing its opportunities and scaling it across functions. So it’s little surprise that only a small subset of respondents (46 out of 876) report that a meaningful share of their organizations’ EBIT can be attributed to their deployment of gen AI.

Still, these gen AI leaders are worth examining closely. These, after all, are the early movers, who already attribute more than 10 percent of their organizations’ EBIT to their use of gen AI. Forty-two percent of these high performers say more than 20 percent of their EBIT is attributable to their use of nongenerative, analytical AI, and they span industries and regions—though most are at organizations with less than $1 billion in annual revenue. (…)

To start, gen AI high performers are using gen AI in more business functions—an average of three functions, while others average two. They, like other organizations, are most likely to use gen AI in marketing and sales and product or service development, but they’re much more likely than others to use gen AI solutions in risk, legal, and compliance; in strategy and corporate finance; and in supply chain and inventory management. They’re more than three times as likely as others to be using gen AI in activities ranging from processing of accounting documents and risk assessment to R&D testing and pricing and promotions. (…)

What else are these high performers doing differently? For one thing, they are paying more attention to gen-AI-related risks. Perhaps because they are further along on their journeys, they are more likely than others to say their organizations have experienced every negative consequence from gen AI we asked about, from cybersecurity and personal privacy to explainability and IP infringement. (…)

Who’s chips is it anyway?

Elon Musk ordered Nvidia to ship thousands of AI chips reserved for Tesla to X and xAI

(…) On Tesla’s first-quarter earnings call in April, Musk said the electric vehicle company will increase the number of active H100s — Nvidia’s flagship artificial intelligence chip — from 35,000 to 85,000 by the end of this year. He also wrote in a post on X a few days later that Tesla would spend $10 billion this year “in combined training and inference AI.”

But emails written by Nvidia senior staff and widely shared inside the company suggest that Musk presented an exaggerated picture of Tesla’s procurement to shareholders. Correspondence from Nvidia staffers also indicates that Musk diverted a sizable shipment of AI processors that had been reserved for Tesla to his social media company X, formerly known as Twitter.

By ordering Nvidia to let privately held X jump the line ahead of Tesla, Musk pushed back the automaker’s receipt of more than $500 million in graphics processing units, or GPUs, by months, likely adding to delays in setting up the supercomputers Tesla says it needs to develop autonomous vehicles and humanoid robots. (…)

A more recent Nvidia email, from late April, said Musk’s comment on the first-quarter Tesla call “conflicts with bookings” and that his April post on X about $10 billion in AI spending also “conflicts with bookings and FY 2025 forecasts.” (…)

The new information from the emails, read by CNBC, highlights an escalating conflict between Musk and some agitated Tesla shareholders who question whether the billionaire CEO is fulfilling his obligations to Tesla while also running a collection of other companies that require his attention, resources and hefty amounts of capital. (…)

IN GOD WE TRUST?

Well, even that is down to the very low 30s.

This is pathetic, really. Congress is down to 7%.
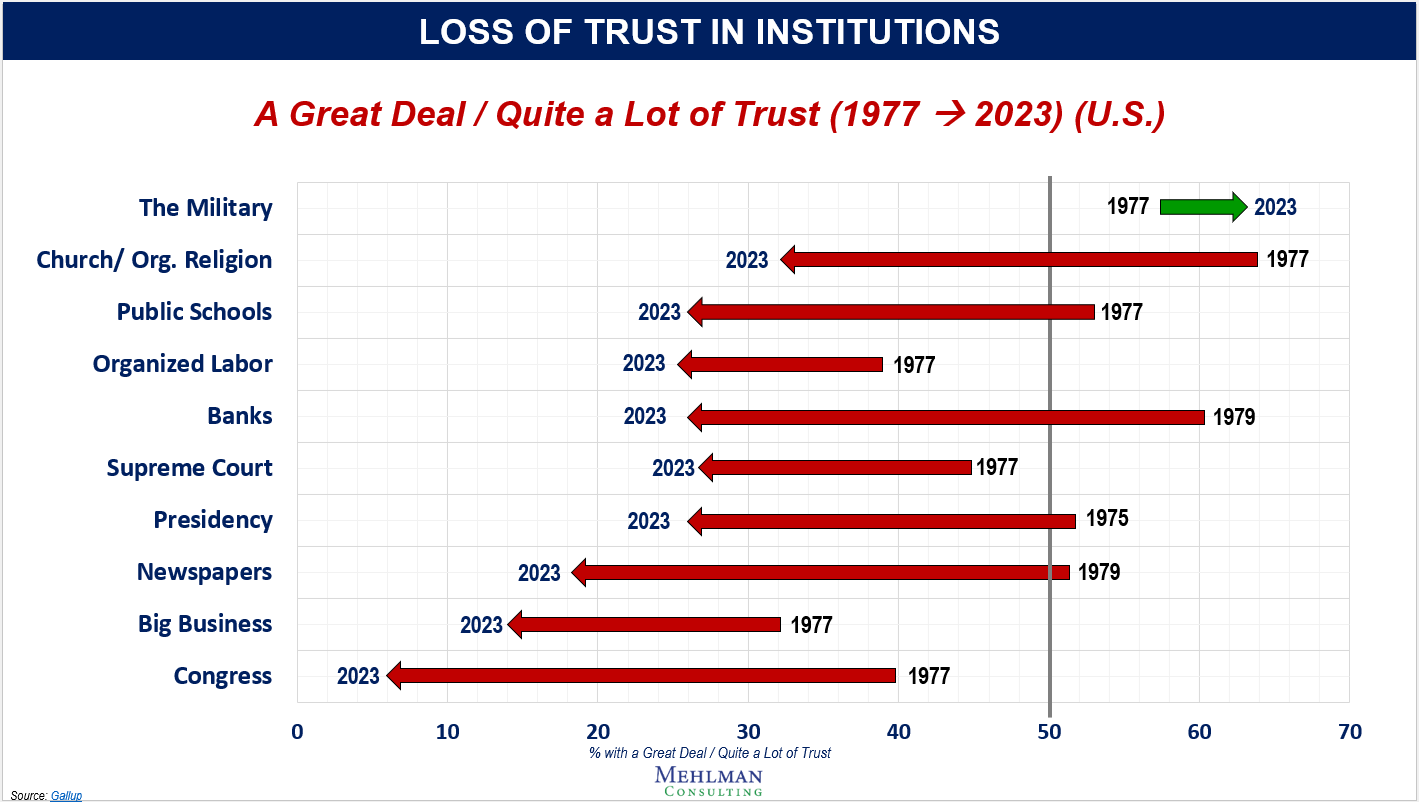
The military? Really?

The Supreme Court, guardian of the cherished Constitution, is down to 27% from 40% in 2017.

Thankfully, we still have small businesses, not listed because almost off the chart at 65%, pretty stable over time. But who shops there?

Modi Loses Majority in Stunning India Election Setback The prime minister is poised to keep power for a third term even after voters denied him an outright majority following an election dominated by high unemployment and inflation.

THE DAILY EDGE: 4 June 2024

U.S. MANUFACTURING PMIs

Another episode of conflicting PMI surveys. As usual, everybody is focusing on the ISM survey:

US Factory Activity Contracts as Orders Slide, Output Weakens ISM May factory index fell to three-month low of 48.7, new orders decreased by most in two years

US factory activity shrank in May at a faster pace as output came close to stagnating and a measure of orders fell by the most in nearly two years.

The Institute for Supply Management’s manufacturing gauge fell 0.5 point to 48.7, the weakest in three months, data out Monday showed.

The purchasing managers group’s measure of new orders slid 3.7 points, the biggest drop since June 2022, to 45.4 in May. The bookings index now stands at the lowest level in a year, suggesting demand across the economy is weakening. As a result, ISM’s production index slipped to 50.2.

Seven industries reported contracting activity in May, led by wood products, plastics and rubber, and machinery. Seven sectors reported growth.

“Demand remains elusive as companies demonstrate an unwillingness to invest due to current monetary policy and other conditions,” Timothy Fiore, chair of the ISM Manufacturing Business Survey Committee, said in a statement. “These investments include supplier order commitments, inventory building and capital expenditures.”

The figures indicate US manufacturing is struggling to gain momentum due to high borrowing costs, restrained business investment in equipment and softer consumer spending. At the same time, producers are battling elevated input costs.

“I think we plateaued,” Fiore said on a call with reporters. “Without some kind of movement on the monetary side here, we’re probably sitting where we’re going to sit for quite some time.”

One hopeful sign for domestic producers was a gauge of export demand grew for the third time in the last four months.

Another was a pickup in factory employment. The group’s measure climbed to 51.1 in May, the highest since August 2022 and suggesting producers are having more success securing labor.

John Authers piled in:

The ISM survey of supply managers in manufacturing, published on the first day of each month, therefore came as a nasty shock. The overall level was consistent with a recession. And in a nasty surprise, new orders dropped sharply, below the score for inventories. This is generally a signal that any restocking cycle is over, and that companies will find themselves producing less:

image

I have combed the media as usual, but failed to find any mention of S&P Global’s own PMI survey, also out Monday morning (actually 15 minutes before the ISM).

S&P Global’s headline:

Renewed increase in new orders in May

The seasonally adjusted S&P Global US Manufacturing Purchasing Managers’ Index™ (PMI®) rose to 51.3 in May, after having posted in line with the 50.0 no-change mark in April. The reading signaled a modest improvement in the health of the manufacturing sector, the fourth in the past five months. image

May saw a renewed expansion in new orders, following a modest reduction in April. While customer demand improved during the month, overall economic conditions remained muted, according to respondents. As such, the rate of expansion in new orders was only marginal.

In fact, the rise in total new business was softer than that seen for new export orders, which increased at the fastest pace in two years. Firms reported signs of improving demand in Europe, alongside growth in new orders from Asia, Canada and Mexico.

The increase in new orders, alongside better material availability, led manufacturers to expand production at a solid pace in May, with the rate of growth quickening from that seen in April.

Firms were also confident that production will rise over the coming year, thanks to optimism that the renewed expansion in new orders will be sustained in the months ahead. Plans to increase capacity also contributed to positive sentiment.

Optimism regarding future new orders and production requirements encouraged manufacturers to take on additional staff, raise purchasing activity and accumulate stocks of finished goods.

Employment increased for the fifth consecutive month, and at the fastest pace since July 2023. Alongside positive expectations, higher staffing levels also reflected the filling of previously vacant positions.

Meanwhile, the rise in purchasing activity in May was the first in three months, but only marginal. The expansion in input buying was not sufficient to prevent a further reduction in stocks of purchases, but it at least restricted the pace of depletion to the weakest in the current three-month sequence of falling inventories.

Stocks of finished goods on the other hand increased for the second month running, and to a larger extent than in April. Expansions to capacity and recent muted demand conditions meant that manufacturers continued to lower their backlogs of work. The pace of depletion was only slight, however, and the weakest since February.

The rate of input cost inflation continued to accelerate, quickening for the third consecutive month to the fastest since April 2023. The latest increase was also sharper than the pre-pandemic average. Higher costs for aluminium and copper in particular, and metals more generally, were reported, as were increased fuel costs feeding through to rising transportation prices.

With input costs increasing sharply, firms also registered a rise in selling prices, although here the pace of inflation eased from April to a five-month low. Finally, suppliers’ delivery times were broadly unchanged in May.

Interestingly, Reuters’ yesterday piece on world PMI surveys quoted S&P Global for all the countries it discussed except the U.S. where it quoted the ISM.

I have often explained why S&P Global’s survey is superior to the ISM. For objectivity, I asked Perplexity to provide more details. Basic AI in action:

The ISM Manufacturing PMI and the S&P Global Manufacturing PMI are two closely watched surveys that measure the health of the US manufacturing sector, but they often diverge due to differences in methodology.

Key Differences

  • Sample Size: The ISM survey covers a relatively small sample of around 300 manufacturing firms, while the S&P Global survey samples over 800 companies.
  • Firm Size: The ISM survey is skewed towards larger companies, while the S&P Global survey has a more balanced mix of small, medium, and large firms.
  • Seasonal Adjustment: The surveys use different methods for seasonal adjustment. S&P Global uses X-13ARIMA-SEATS, while ISM uses an in-house technique.
  • Weighting: The ISM PMI is an equally weighted average of its components, while the S&P Global PMI is weighted based on industry contributions to GDP.

While both surveys are valuable indicators, their differences in sample composition and calculation methods can lead to contrasting signals, especially during periods of economic transition.

Based on the provided search results, the S&P Global Manufacturing PMI survey has been more accurate than the ISM Manufacturing PMI in reflecting actual manufacturing output and new orders data over the past 10 years.The key evidence supporting this is:

  1. Statistical analysis from 2007 to 2018 showed the S&P Global Manufacturing PMI had consistently higher correlation coefficients and adjusted r-squares compared to the ISM PMI when regressed against official output and new orders data. This indicates the S&P Global PMI was more closely aligned with the actual manufacturing activity.
  2. The analysis found that the ISM PMI tended to overstate manufacturing growth, especially in 2017 and 2018, while the S&P Global PMI provided more accurate signals. The ISM PMI overstated output growth in 24 out of 28 months leading up to December 2018.
  3. The S&P Global PMI’s broader sample, including a better mix of small, medium and large firms, likely contributed to its superior performance in tracking the overall manufacturing sector compared to the ISM’s bias towards larger companies.
  4. Methodological differences, such as the ISM’s equal weighting of components versus S&P Global’s GDP-weighted approach, and varying seasonal adjustment techniques, also impacted the accuracy of the two surveys.

While both surveys are widely followed indicators, the evidence from the provided sources suggests that over the past decade, the S&P Global Manufacturing PMI has outperformed the ISM survey in providing more reliable and accurate signals about the actual health of the U.S. manufacturing sector.

Tomorrow we get the more consequential services PMIs. As a preview, here’s what S&P Global wrote in its flash PMI survey released May 23rd:

The headline S&P Global Flash US PMI Composite Output Index rose sharply from 51.3 in April to 54.4 in May, its highest since April 2022. The 3.1 index point rise (the largest gain for 15 months) signals a marked acceleration of growth midway through the second quarter. Output has now risen continually for 16 consecutive months, with May’s acceleration contrasting with the slowdown seen in March and April.

May’s improved performance was led by the service sector, where business activity surged higher to register the fastest growth for a year, reversing the slowdown seen over the prior three months. Services activity has now risen for 16 straight months. Inflows of new work into the service sector also picked up, having slipped into decline in April, registering one of the strongest gains seen over the past year, though demand was again subdued by a further fall in services exports.

Yesterday, markets reacted to the bearish ISM release, on the heels of last Friday’s weak consumer spending data for April. The strong flash PMI however noted that

Employment fell for a second successive month in May, contrasting with the continual hiring trend seen over the prior 45 months. The overall reduction in workforce numbers was only very marginal, however, and less than witnessed in April, as an upturn in manufacturing payrolls was accompanied by a slower rate of job shedding in services.

While factory jobs grew at the fastest rate for ten months in May, buoyed by rising order books and improved business prospects, services employment has now fallen for two successive months, albeit in part due to staff shortages.

Let’s see what tomorrow’s releases reveal and how this will translate into the May employment report on Friday.

Vehicles Sales Increase to 15.9 million SAAR in May; Up 2.5% YoY

Wards Auto released their estimate of light vehicle sales for May: May U.S. Light-Vehicle Sales Continue 2024 Trend of Slow, Steady Growth (pay site).

Further confirming as a theme for 2024, growth in May largely was centered in the most affordable CUV and car segments. Other sectors during the first five months of 2024 have either recorded sporadic gains or fell into steady decline, including some, such as fullsize pickups, that are coming off lengthy periods of strong results. Sales in May (15.90 million SAAR) were up 1.0% from April, and up 2.5% from May 2023.

Flat for the past 12 months.

Majority of Middle-Class Americans Say They Struggle Financially A third of respondents feel ‘extreme stress’ about paying debt

(…) In the large poll of 2,500 adults, conducted by the Urban Institute think tank, 65% of people who earn more than 200% of the federal poverty level — that’s at least $60,000 for a family of four, often considered middle class — said they are struggling financially.

A sizable share of higher-income Americans also feel financially insecure. The survey shows that a quarter of people making over five times the federal poverty level — an annual income of more than $150,000 for a family of four — worry about paying their bills.

Overall, regardless of the income level, almost 6 in 10 respondents feel that they are currently financially struggling. (…)

About 40% of respondents were unable to plan beyond their next paycheck, and 46% didn’t have $500 saved. The February poll found that more than half said it’s at least somewhat difficult to manage current levels of debt. (…)

The poll also highlights the divide between debt-free households who are sheltered from the impact of rising rates and families who are overwhelmed with ballooning loan and credit-card payments. One third of the respondents said they have no debt at all.

The responses on savings also show wide disparities. About one in five respondents have at least $10,000 saved, but 28% have no savings at all. Overall, one in six said they have to make tough decisions on which bill to pay first on a regular basis. (…)

Some of the findings tracked with the Federal Reserve’s annual survey of household economics and decision making, published last month. In that poll, close to half of respondents could cover a $2,000 expense, but 18% of adults said the largest emergency cost they could handle right now using only savings was under $100, and 14% said they could afford an expense of $100 to $499.

Since the pandemic, core CPI is up 18.8% but my “CPI-Essentials” series (food,energy, shelter) is up 24.0%.

Similar dichotomy in corporates:

Big Tech Companies Unplug Stock Market From Reality The big-vs.-small-stocks phenomenon reflects the same disconnects we see in the broader economy

The average stock in the S&P 500 is hurt more by rising yields—and helped more by falling yields—than any time this century. Yet the S&P itself is far less affected by the outlook for interest rates, because the Big Tech stocks that make up so much of the standard, value-weighted index are insulated from the Fed by their enormous cash piles. (…)

The valuation split is clear. Divide the market into tenths by size, and the valuation of the groups rises fairly steadily as company value rises. Valuation isn’t as vertiginous, either: The median stock in the S&P trades at 18 times forward earnings, against more than 21 times for the Big Tech-dominated index. (To be clear, that still isn’t cheap by historical standards.)

image

The sensitivity to interest rates can be gauged by comparing the ordinary S&P 500, which gives more weight to larger companies, and the equal-weighted version, which treats tiddlers the same as titans to measure the average stock. The ordinary S&P is up over 10% this year through Friday, while the equal-weighted version is up less than 5%.

The link to bond yields is also split, with the average stock more strongly linked to bond yields—rising when they fall, and vice versa—than any time since 1999 over a 100-day period. The gap between this correlation and that of the ordinary S&P, which has a much weaker link to Treasury yields, is unprecedented in data back to 1990. (…)

The Big Tech stocks that dominate the market sit on huge cash piles, while the biggest companies chose to lock in low interest rates for a long time by refinancing their bonds before the Fed began raising rates in 2022. Smaller companies tend not to have cash piles on which to earn fat savings interest and have more need to issue bonds to raise cash. The smallest don’t even have access to the bond market, one reason the Russell 2000 index of smaller companies has lagged so far behind the S&P this year, eking out a gain of just 1.6%. (…)

ECB Rate-Cut Expectations Start to Unravel Before First Move Strong wage growth risks slowing return of inflation to 2%

While most economists still foresee quarterly reductions following this week’s initial move, some reckon sticky inflation, rapid wage growth and surprisingly robust euro-zone output will constrain monetary loosening.

Traders, too, have pared easing bets, reinforced by Executive Board member Isabel Schnabel and Bundesbank President Joachim Nagel seeming to take July off the table, as Austria’s Robert Holzmann said two decreases in 2024 may suffice.

Cautious officials fret that lowering borrowing costs at consecutive meetings could prompt markets to take that pace as their baseline. They may also have less confidence than some of their colleagues that ECB policy can truly diverge from the Federal Reserve, which is likely to stay on hold for a while yet.

A key gauge of euro-zone pay that policymakers had hoped would show inflation had finally been conquered failed to moderate — indicating price pressures, particularly in the services sector, may take longer to ease. Indeed, inflation picked up to 2.6% last month from 2.4% in April — more than expected.

image

At the same time, the 20-nation economy bounced back more resoundingly than anticipated after the mild recession it suffered in the latter half of last year, with the labor market staying resilient, unemployment recently hitting an all-time low and business surveys even showing signs of life at struggling manufacturers. (…)

Almost half of respondents in a Bloomberg survey before the ECB’s April meeting anticipated four or five rate reductions in 2024. Nobody predicts five anymore, and the share that sees four has declined.

Similarly, markets — having priced three reductions for this year as recently as April — have now ruled out July and only put the chances of a September step at 60%. (…)

“In the past, a first rate cut was always followed by further rate cuts to support growth and/or to response to a crisis.” said Carsten Brzeski, ING’s head of macro. “This time around, however, there’s none of these two. Therefore, there’s a high risk that the ECB could be forced to move from ‘one is none’ to a ‘one-and-done’ stance.”

Joblessness rose by a seasonally adjusted 25,000 in May, while economists polled by Bloomberg had expected a gain of just 7,000. The unemployment rate held at 5.9%, the Federal Labor Agency said Tuesday. (…)

An early indicator by the German Institute for Employment Research fell last month, with researcher Enzo Weber saying the labor market’s strength during the economically weak winter means there’s limited recovery potential now.

Analysts reckon households will be an important growth driver, mainly as their incomes continue to catch up to the inflation experienced in recent years. Real wages rose at a record pace in the first three months of the year and are expected to increase further in the coming quarters.

China sees property silver lining but can’t shake Japan comparisons

A plunge in China’s new housing construction is fuelling hopes the battered property sector is finally coming to terms with chronic oversupply, but a clean-up of bad assets is the missing policy piece that keeps Japan-like stagnation fears alive.

On paper, the world’s second-largest economy is almost where the U.S. and Spain were when their late 2000s property crises began to stabilise, with new Chinese housing construction now at less than half its 2021 peak.

This could indicate, analysts say, that home building activity may find a bottom within a year or so, removing some of the weight China’s real estate troubles are placing on economic growth.

Reuters Graphics

New home starts in China fell 63% from their peak to 634 million square metres (7.46 billion square feet) in the 12 months through April.

Taking into account demographics and other factors, the International Monetary Fund estimates fundamental demand for housing in China to average 950 million square metres over the next 10 years.

Some of the demand would have to absorb China’s giant existing inventory, therefore the Fund projects new housing starts to average 715 million square metres – slightly above current rates.

This could mean real estate investment, whose steep 10% back-to-back annual declines JPMorgan estimates chopped 1.5 percentage points off China’s economic growth in each of the past two years, may be close to finding a floor.

George Magnus, research associate at Oxford University’s China Centre, says that could come in 2025 or even sooner. (…)

New home prices in China have fallen 11%, according to official data. JPMorgan estimates prices for older apartments dropped by a similar amount.

The 30-40% peak-to-trough plunge in the U.S. and Spanish downturns started in 2006-07 and lasted more than five years. In Japan, the correction took more than 18 years, pushing prices down by 47% in the end.

So far, China’s pace has matched Japan’s. Odds are that it will continue to do so, analysts say.

Reuters Graphics

What’s missing from both the Chinese and Japanese responses to the crisis is an early recognition of losses.

Japan asked banks to purchase land to slow down the fall in prices. China achieves something similar by placing limits on how much developers can lower new home prices and through a drip-feed of other support measures.

JPMorgan analysts say this is “perhaps an intentionally chosen strategy to mitigate financial spillover risks.”

A stock of unsold homes estimated at almost twice the size of London still exists on the balance sheets of cash-strapped Chinese developers, whose debts sit on the books of banks and other institutions.

By contrast, the United States spent an initial 5% of gross domestic product to absorb toxic assets from financial institutions through its Toxic Asset Relief Program. Spain created a bad bank.

China is not keen on sweeping bailouts, one policy adviser said, asking for anonymity to discuss a sensitive topic.

“The government has no intention to prop up the property market,” the adviser said. “It aims to stabilise it, or at least slow down its decline.” (…)

Analysts say the purchases transfer bad assets from developers to local governments, delaying writedowns. But eventually, the losses will have to be recognised, which is why comparisons with Japan’s lost decades persist.

Alicia Garcia-Herrero, Asia Pacific chief economist at Natixis, says local governments may suffer a similar fate to the Japanese banks, which ultimately had to be recapitalised, implying a “longer, more protracted adjustment.”

“There hasn’t been a clean-up,” Garcia-Herrero said. “This is why China looks more like Japan and not like the U.S. or Spain.”

One important difference is that Beijing can indefinitely support local governments, even many of the state-owned banks.

China Vanke’s Sales Slump Eases as Housing Market Picks Up

The value of homes sold gained 11.5% last month from April to 23.3 billion yuan ($3.2 billion), the Shenzhen-based company said. From a year earlier, sales dropped 29.3%, narrowing for a third month. (…) Vanke’s month-on-month improvement in home sales surpassed the 3.4% increase at the 100 biggest real estate companies tracked by China Real Estate Information Corp. (…)

image

“Vanke’s liquidity challenges are set to persist as long as its contracted sales shortfall continues,” Bloomberg Intelligence property analyst Kristy Hung wrote in a Monday note. “A fundamental recovery in sales is needed to improve the odds of staying solvent through 2025.”