The Fed Might Soon Have to Worry About More Than Just Inflation As evidence mounts that the economy is slowing, pressure to lower rates could build
Investors’ attention on Friday was initially focused on the personal-consumption expenditures price index, part of a package of data released by the Commerce Department. That makes sense since it is the Federal Reserve’s preferred measure of inflation and will help them decide whether or not to cut rates before November’s U.S. presidential election. But accompanying data on underlying economic activity turned out to be more significant.
The PCE price index rose 2.7% from a year earlier in April, in line with economists’ expectations and unchanged from the prior month. The core PCE price index that strips out food and energy, which the Fed favors, was up 2.8%, a tad more than expected.
More noteworthy were the figures for personal income and consumption. Incomes rose 0.3% from the preceding month, in line with expectations and down from 0.5% growth in March. Personal spending rose just 0.2%, below expectations and slowing from 0.7% in March. In real, inflation-adjusted terms consumption and disposable incomes both fell 0.1%. (…)
Also on Friday, the Chicago Business Barometer, also known as the Chicago purchasing managers index and a gauge of economic activity in the region, fell to 35.4 in May from 37.9 in April. The importance of regional PMIs shouldn’t be exaggerated, but this one seemed more noteworthy than most. It was at its lowest since May 2020, during the lockdown period of the pandemic, according to FactSet.
All those readings came on the heels of a downward revision in first-quarter gross domestic product growth on Thursday, to an annualized 1.3% from an earlier estimate of 1.6%. It was mainly driven by a declining estimate of consumption, again suggesting a flagging consumer. In a note, economists at Capital Economics said they are now expecting growth of just 1.2% in the second quarter, down from an estimate of 2.7% a couple of weeks ago.
In short, signs of a slowdown are becoming hard to ignore. This may not start to influence the calculations of the Fed until it shows up more strongly in the monthly payroll numbers. Those showed some slowing in April but, at 175,000 jobs added, was still decent. The report on May will be released on Friday.
But developments in the labor market are famously a lagging indicator, meaning they show up later than other signs when an economic shift occurs. The early signals are already here.
Short term, the best proxy for consumer expenditures is aggregate labor income (employment x hours x wages). Longer term, people can only spend their disposable income to consume and service debt. PDI accounts for non-labor income such as investment income and social security payments less income taxes.
Post-pandemic, federal bounties provided enough cushion to allow Americans to merrily spend their labor income (black). We know that time and inflation have now eliminated these so-called excess savings, this when the actual savings rate is near its all-time low at 3.6%. No more comfy cushion. We now need continued strong labor income (+5.6% YoY in April), particularly given the sharp slowdown in disposable income growth, from 6.6% just 4 months ago, to 3.7% in April.

The drop is more dramatic in real terms: from +5.3% YoY in June 2023 to +3.8% last December and to +1.0% in April. In fact, real disposable income has been flat since January after having increased 2.9% annualized between October 2023 and January 2024.
Partly inflation but mostly income taxes which jumped 6.3% (20.2% annualized) since December and 10.0% YoY in April. The tax rate averaged 12.0% in 2023, in line with 2019, but it averaged 12.4% so far in 2024 and was 12.5% in April. If sustained, the hit to PDI will persist through Q4 this year.
PERSONAL TAX RATE

Meanwhile, labor income growth was zero in nominal terms in April, a marked changed from its 0.55% average monthly gains since October 2023. Breaking down labor income growth by its components, April was a real bummer with employment growth at +0.11% MoM (+1.8% YoY) vs +0.16% on average in the previous 5 months (+1.8%), wage growth at 0.20% vs 0.34% and hours at –0.30% vs +0.06%.
It may be just a monthly aberration, or it may be the first real indication that higher interest rates are actually having an impact. The Fed wants slower growth in employment and wages to get inflation to target. It may be getting both already.
Friday’s employment report will help assess whether April was just an oddity or the beginning of a trend.
Indeed Job Postings are down 5.8% between March 31st and May 24 (including an abrupt drop in the last 2 weeks), suggesting that the BLS Job Openings could decline to the 8M range from March’s 8.5M print. This would be only 10% above the pre-pandemic level.

Interestingly, S&P Global’s May 24rd flash PMI (full PMI out today) said services employment declined for the second consecutive month in May. Real spending on services rose only 0.1% in April after +0.2% in March, a slow and slowing 1.8% annualized growth rate that follows a 4.2% annualized growth rate during the previous 5 months. America’s main job creator is slowing quickly.
A bull may say that initial unemployment claims remain within the last 8-month range. A bear might only see the 2024 dashed arrow and warn of a coming substantial increase in continued claims.

Sitting on the same GDP fence, a comfy bull might say 2.7% growth per the Atlanta Fed’s GDPNow is just fine, but a grinning bear would think “the fool’s not watching the NY Fed GDP Nowcast at 1.76%. Hey! who won, Grant or Lee?”.


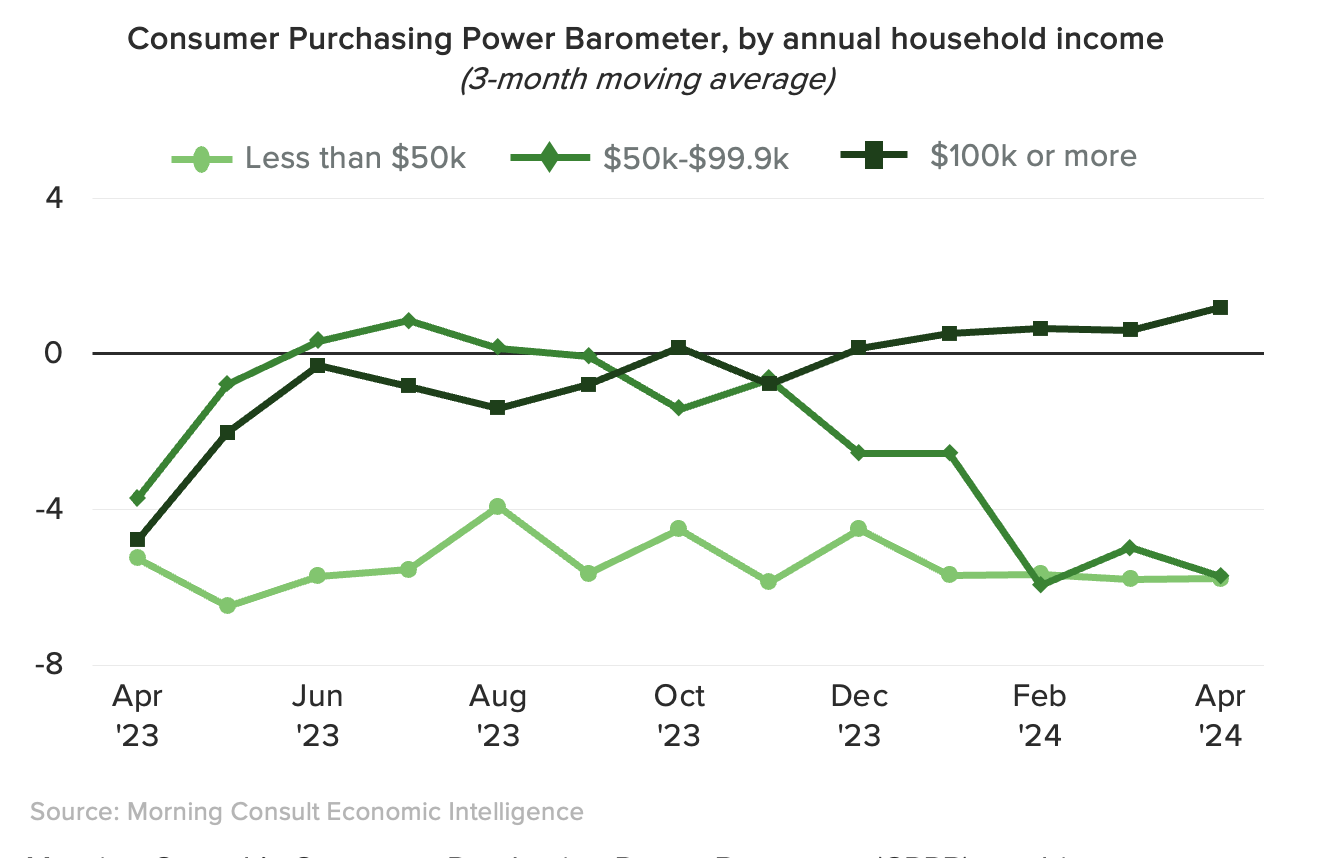
More than ever, the consumer holds the key but his grip on the key is getting weaker. While we wait for hard data, soft data keeps warning of squeezed shoppers. We all know of the bottom 20% of income earners but Morning Consult’s recent survey tells us that the middle income group is now also pinched:
Most U.S. consumers are spending more cautiously as pressures from elevated prices and interest rates pinch household budgets. This softer spending is being driven in part by middle-income adults, whose purchasing behaviors increasingly resemble the frugal habits of the lowest income cohort.
To gauge consumer spending strength, Morning Consult’s Consumer Purchasing Power Barometer (CPPB) combines our two demand indexes, Price Sensitivity and Substitutability. Throughout the bulk of 2023, middle- and high-income adults’ CPPB scores moved in tandem, but in recent months the middle-income group has diverged from their higher earning peers.
Significantly, the cooling in discretionary services spending transpired in the inflation data as Wells Fargo writes:
The headline PCE deflator rose at the slowest pace in four months, up 0.3% in April [0.26%], which kept the year-ago rate steady at 2.7%. Core inflation (excluding food and energy prices) rose 0.2% [0.25%], translating to an also steady 2.8% annual rate. The data may not show meaningful progress on the fight against inflation in April, but it at least is consistent with a cooling rather than a continuation of the Q1 acceleration in price growth. That should offer some solace to Fed officials still hyper-focused on inflation.
The composition of price changes is also key to understanding the recent stickiness in inflation. Specifically, the “super core” measure of inflation, which focuses on services and strips housing from the estimates, also cooled last month, rising just 0.3% [0.27%]. This measure of inflation is still running fairly hot, but the cooling in the three-month annualized rate to 3.6% takes some sting out of the hot first-quarter.
If sustained, the slowing in discretionary services spending should help rein in services inflation. Although further progress is likely needed before the Fed is comfortable easing policy, the April data largely make the hot inflation data at the start of the year look more like a blip rather than renewed acceleration in price growth. This inflation data combined with the softening in overall spending suggests the door is still open for potential Fed easing later this year, though it will need to see further progress on inflation before rate cuts are truly in play.

CPI Shelter was up 5.5% year-over-year in April, down from 5.6% in March, and down from the cycle peak of 8.2% in March 2023.
Housing (PCE) was up 5.6% YoY in April, down from 5.8% in March, and down from the cycle peak of 8.3% in April 2023.
Since asking rents are mostly flat year-over-year, these measures will continue to slow over the next year.

 But, actually, “asking rents” are not “mostly flat” per the best private data provider. Zillow’s rents on new leases rose 0.28% MoM in April and averaged 0.38% during the Jan-Apr period (+4.7% a.r.).
The rarely quoted BLS All Tenant Rent Index rose 1.3% QoQ in Q1 (5.5% a.r.) and is up 5.4% YoY.
In the real world, Invitation Homes last week said that its new leases rose 3.5% YoY in Q2 while renewals were up 5.9% (5.3% blended vs 4.4% in Q1). American Homes said its own new leases were up 5.4% and renewals +5.1% (blended 5.2%).
Evercore ISI’s survey of apartment companies reveals that “rents have been in an uptrend all year” so far.
Everybody claims that the BLS measure lags actual rents. True, but not the way they think. The BLS measure is still 10% below market rent which keeps rising because housing is unaffordable for most Americans amid an acute housing shortage, all engineered by the Fed over the last 15 years (but don’t expect Mr. Powell to acknowledge that).

Remember that rent is only 16% of the PCE index, half the CPI’s weight (33%). The May CPI will be released June 12. The FOMC meets June 11-12.
Canada Economy Grew 1.7% in First Quarter, Missing Forecasts Release prompts traders to boost bets on a June 5 rate cut
(…) The statistics agency also downwardly revised fourth-quarter growth to 0.1% from 1%. While March economic output was flat, matching economist expectations, the statistics agency’s preliminary data suggest output in April rose 0.3%. (…)
This is the last key economic data release before the Bank of Canada’s rate decision next Wednesday. The majority of economists in a Bloomberg survey expect policymakers to cut their key policy rate by 25 basis points at that meeting, marking the start of an easing cycle after keeping the rate at 5% since July last year. (…)
The GDP miss “came from the volatile inventories category,” he pointed out. “As a result, final domestic demand, a better gauge of underlying momentum, still advanced a heady 2.9% in the first quarter. That’s obviously better news than in previous quarters, but is being aided by the growing population.” (…)
In the first quarter, household spending on services rose, primarily driven telecommunications, rent and air transport. Household spending on goods also edged up, with higher expenditures on new trucks, vans and sport utility vehicles.
Housing investment also increased, with Ontario, British Columbia and Quebec recording the largest volume increases in resales while prices in these provinces fell.
Business capital investment grew, led by spending on engineering, mainly within the oil and gas sector. But there were widespread slowdowns in business investment in inventories, with accumulations easing in most industries, led by retail motor vehicles.
Compensation of employees rose and household savings reached the highest rate since early 2022 as gains in disposable income outweighed increases in nominal consumption expenditure. Corporate income fell.
According to preliminary data, manufacturing, oil and gas extraction and wholesale trade led the increases in April. All three of these industries, however, contracted in March.
NBF:
Some will therefore be pleased with the rebound in private domestic demand (+3.1%), which posted its strongest growth since 2021Q4 after a long lethargy since the start of monetary tightening.
We beg to differ, as final domestic demand was just able to keep up with population growth this time around, making it a lackluster quarter.
Getting back to GDP, it was well below population growth of 3.0% (and thus below potential growth), which means to us that the economy continues to cool. To illustrate the counter-performance of the quarter, we need only look at GDP per capita, which continued its downward trend during the quarter and is now 3.5% below the peak recorded at the beginning of the rate hikes. A decline of this magnitude has never been seen outside of a recession.
There are many other signs that the Canadian economy has cooled significantly. Indeed, the consumption deflator rose by just 2.0% annualized on the previous quarter, the lowest rate since the pandemic. In addition, the unemployment rate continues to rise and could deteriorate further as corporations seem overstaffed and profits fell 29% on an annualized basis in the quarter. These developments comfort us in our view that conditions are in place for the Bank of Canada to lower its policy rate this summer. The current overly restrictive monetary policy is reflected in our bleak economic outlook for the coming quarters.


MANUFACTURING PMIs
Euro area factory production close to stabilising in May
The HCOB Eurozone Manufacturing PMI rose to 47.3 in May, from 45.7 in April. While this was still below the 50.0 no-change threshold, it was the highest reading in the headline index since March 2023, indicating the slowest deterioration in the health of the euro area goods-producing sector for over a year.
Improved Manufacturing PMI figures were seen across the majority of the countries covered by the survey. Germany and France saw contractions slow, although the former was still the eurozone’s worst-performing manufacturing sector. On the other hand, accelerated expansions were seen in Spain and the Netherlands, both of which registered the best improvements in factory operating conditions since 2022. (…)
There was a near stabilisation of production across the eurozone in May. While factory output fell, the contraction was the softest in just over a year and only marginal overall. Surveyed companies reported lower new orders – a factor which continued to inhibit production lines – midway through the second quarter. That said, the rate of contraction was the weakest in two years. New export sales also decreased, with the decline likewise cooling to its weakest since May 2022.
Backlogs of work continued to be reduced in May as subdued demand conditions led eurozone factories to use outstanding orders as a means to support output. However, while the rate of depletion was marked, it was the weakest since August 2022. Employment across the euro area manufacturing sector was decreased further amid evidence of surplus capacity, extending the current period of factory job losses to a year. The rate of decrease matched that seen in April and was modest.
Purchasing activity continued to shrink midway through the second quarter, although the pace of decline was its softest since September 2022. This partly reflected sufficient input stock levels, as the latest survey data pointed to a sixteenth successive monthly reduction in eurozone manufacturers’ pre-production inventories. Regarding deliveries of raw materials and other items needed for production, panellists reported a further improvement in lead times.
Input costs fell again, stretching the current sequence of decreases that commenced in March 2023. However, the decline was marginal and the slowest over this period. There was a further month-on-month reduction in the price of goods leaving the factory gate across the eurozone.
Looking ahead, eurozone goods producers reported a strong level of optimism towards production prospects over the next 12 months. The level of positive sentiment was above its series average and the highest since February 2022.
Commenting on the PMI data, Dr. Cyrus de la Rubia, Chief Economist at Hamburg Commercial Bank, said:
“This could be the turning point for the manufacturing sector. The industry is on the verge of halting the production decline that has persisted since April 2023. This is largely supported by more favourable trends in intermediate and capital goods. Additionally, more companies are reporting positive developments in order intakes from both domestic and international markets, although this is still being offset as a larger proportion saw declines in May. Encouragingly, business confidence regarding future production is at its highest level since early 2022.
“Optimism is growing, but companies remain cautious. They continue to reduce personnel and hold back on purchasing intermediate goods. This caution may also be reflected in the accelerated decrease in inventories of produced goods. This suggests that some companies were surprised by recovering demand, which they couldn’t or didn’t want to immediately meet with increased production.
“Germany might soon be ready to overtake its main Eurozone competitors. Although Germany’s HCOB Manufacturing PMI remains the lowest of the four major Eurozone economies, it is close behind Italy. Italy, as of lately considered an outperformer, has seen its situation deteriorate. France follows closely, as its industrial sector has improved less than that of its northern neighbour. Spain however remains out of reach for now, being the only one of the Euro-4 countries with a growing industrial sector.”


China: Business conditions improve with fastest output growth in nearly two years
|


The Caixin PMI contradicts China’s official PMI out last Friday which showed the manufacturing PMI down from 50.4 to 49.5. The Caixin PMI is broader and includes more mid-size companies.
Japan: Manufacturing business conditions improve in May
- PMI rises above 50.0 for first time in a year
- Output and new orders broadly stable
- Employment and input stocks expand
At 50.4 in May, up from 49.6 in April, the headline au Jibun Bank
Japan Manufacturing Purchasing Managers’ Index™ (PMI®)
posted above the neutral mark of 50.0 for the first time in a year and
therefore indicated a mild improvement in operating conditions. (…)
The level of new orders placed with Japanese manufacturers was also broadly stable in May, with some companies noting a recovery in new business intakes at their units. Where sales fell, panellists cited subdued demand trends and sufficient stock levels at clients. There were also mentions of fewer biddings for public work and a lack of investment.
International orders decreased, with survey participants indicating weak demand from mainland China, Europe, North America and Vietnam. The overall rate of reduction was modest, however, and similar to April. (…)
Price gauges showed an intensification of inflationary pressures across Japan’s manufacturing industry. Input costs rose to the greatest extent in 13 months, amid reports of greater outlays on labour, materials and transportation. Yen weakness was also
reported as a factor behind rising international prices. Firms then lifted their selling charges at the fastest pace in a year.


OPEC+ Agrees to Extend Production Cuts in Bid to Boost Oil Prices Deal signals oil prices will remain elevated through the U.S. presidential election
The Organization of the Petroleum Exporting Countries and its allies, together known as OPEC+, agreed to keep collective curbs through next year. The group has longstanding official reductions of 3.66 million barrels a day.
The new deal includes the United Arab Emirates securing another upgrade to its official production quota, by 300,000 barrels a day. The UAE’s new official quota will be gradually phased in starting in January and stand at 3.519 million barrels a day by September 2025.
Eight top producers in the group also agreed to continue voluntary cuts separately into 2025, currently around 2.2 million barrels a day, according to an OPEC+ document. But the voluntary cuts, which include a production cut of one million barrels a day from top producer Saudi Arabia, will be only maintained at the same level for three months before being gradually eased through September next year, the document says.
In effect, the agreement gives the cartel considerably leeway to make adjustments depending on market conditions.
The curbs are aimed at bolstering prices and avoiding a global surplus in a context of rising output from other nonmember producers, particularly the U.S., and concerns over demand amid high interest rates and inflation. (…)
The further extension of cuts agreed Sunday could tip global oil markets into a supply deficit, pushing up prices. Demand for OPEC+ crude is set to increase next year by 800,000 barrels a day, the cartel said in a report last month.
Lagging compliance to agreed curbs has also been a bone of contention between Saudi Arabia and other top producers. Russia, Iraq and Kazakhstan respectively overproduced 200,000 barrels a day, 240,000 barrels a day and 72,000 barrels a day in April, according to S&P Global’s commodities-data service Platts.
In recent months, flows of Russia’s crude to global markets were boosted by 400,000 barrels a day as Ukrainian attacks on its refineries reduced Moscow’s capacity to process the commodity at home, said data-commodities provider Kpler. But they are set to decline in the summer as the plants restart, it said.
 The Budget Geeks Who Helped Solve an American Economic Puzzle A low-profile government agency’s findings on immigration have thrust it into the center of a hotly divisive political debate.
When a low-profile government agency in Washington crunched some numbers to get a clearer picture of the US immigration surge, it helped fill in the puzzle around why the world’s biggest economy has continually defied expectations for a downturn in recent years.
The findings by the Congressional Budget Office, a 270-person agency mostly known for its accounting wonkery, showed that the economic impact of immigration was much bigger than had been previously thought. In a set of 10-year demographic projections published in February, the CBO estimated that the boost to population numbers from immigration would power growth to the tune of $7 trillion through 2033—and would lift government revenue by about $1 trillion—as new workers fill shortages and stoke demand. (…)
Drawing on the DHS, CBO estimated that in the fiscal year ended Sept. 30, some 860,000 people crossed into the US without being apprehended or turned away. The group also estimated more than 400,000 people who arrived legally in the US overstayed their visas, another category that’s hard to pin down. (…)
The analysis—from an agency with only a fraction of the manpower of the Federal Reserve or Treasury Department—has reshaped the economic debate. Wall Street economists were quick to acknowledge it. When asked about the CBO report in testimony before Congress in March, Fed Chair Jerome Powell said that while the central bank refrains from commenting on immigration policy, “it’s just reporting the facts to say that immigration and labor force participation both contributed to the very strong economic output growth that we had last year.”
JPMorgan Chase and BNP Paribas were among the banks that revised their forecasts in response to the report. Not only does it “radically change” our understanding of the post-pandemic labor market, but “just as important, it should change how you interpret the employment numbers that come in over the course of this year,” says Wendy Edelberg, a former Fed and CBO economist who’s now director of the Brookings Institution’s Hamilton Project. (…)
(…) the upbeat economic outlook could change abruptly if authorities tighten controls at the border. There’s information indicating that crossings along the southern border have slowed this year: The number of so-called encounters between migrants and immigration authorities fell to about 190,000 a month in February and March, well below the record of more than 300,000 in December, according to government data. (…)
Bloomberg News has reported that President Joe Biden plans to sign an executive order that would restrict the number of people permitted to apply for asylum, and former President Donald Trump has vowed to implement more draconian measures, including mass deportations, if reelected. (…)


FYI
Fund flows…

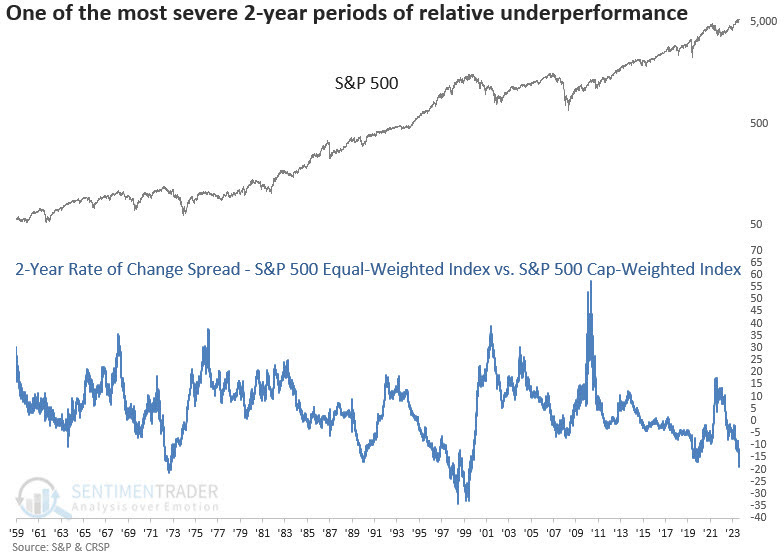
…but not equally:

- On a similar note, the rate of change in equal vs market cap weighted relative returns has reached an extreme, and echoes a pattern often seen around market peaks. (Callum Thomas)
Source: @DeanChristians
The AI Revolution Is Already Losing Steam The pace of innovation in AI is slowing, its usefulness is limited, and the cost of running it remains exorbitant
The rate of improvement for AIs is slowing, and there appear to be fewer applications than originally imagined for even the most capable of them. It is wildly expensive to build and run AI. New, competing AI models are popping up constantly, but it takes a long time for them to have a meaningful impact on how most people actually work.
These factors raise questions about whether AI could become commoditized, about its potential to produce revenue and especially profits, and whether a new economy is actually being born. They also suggest that spending on AI is probably getting ahead of itself in a way we last saw during the fiber-optic boom of the late 1990s—a boom that led to some of the biggest crashes of the first dot-com bubble. (…)
To train next generation AIs, engineers are turning to “synthetic data,” which is data generated by other AIs. That approach didn’t work to create better self-driving technology for vehicles, and there is plenty of evidence it will be no better for large language models, says Gary Marcus, a cognitive scientist who sold an AI startup to Uber in 2016.
AIs like ChatGPT rapidly got better in their early days, but what we’ve seen in the past 14-and-a-half months are only incremental gains, says Marcus. “The truth is, the core capabilities of these systems have either reached a plateau, or at least have slowed down in their improvement,” he adds.
Further evidence of the slowdown in improvement of AIs can be found in research showing that the gaps between the performance of various AI models are closing. All of the best proprietary AI models are converging on about the same scores on tests of their abilities, and even free, open-source models, like those from Meta and Mistral, are catching up.
A mature technology is one where everyone knows how to build it. Absent profound breakthroughs—which become exceedingly rare—no one has an edge in performance. At the same time, companies look for efficiencies, and whoever is winning shifts from who is in the lead to who can cut costs to the bone. The last major technology this happened with was electric vehicles, and now it appears to be happening to AI.
The commoditization of AI is one reason that Anshu Sharma, chief executive of data and AI-privacy startup Skyflow, and a former vice president at business-software giant Salesforce, thinks that the future for AI startups—like OpenAI and Anthropic—could be dim. While he’s optimistic that big companies like Microsoft and Google will be able to entice enough users to make their AI investments worthwhile, doing so will require spending vast amounts of money over a long period of time, leaving even the best-funded AI startups—with their comparatively paltry warchests—unable to compete.
This is happening already. Some AI startups have already run into turmoil, including Inflection AI—its co-founder and other employees decamped for Microsoft in March. The CEO of Stability AI, which built the popular image-generation AI tool Stable Diffusion, left abruptly in March. Many other AI startups, even well-funded ones, are apparently in talks to sell themselves.
An oft-cited figure in arguments that we’re in an AI bubble is a calculation by Silicon Valley venture-capital firm Sequoia that the industry spent $50 billion on chips from Nvidia to train AI in 2023, but brought in only $3 billion in revenue.
That difference is alarming, but what really matters to the long-term health of the industry is how much it costs to run AIs.
Numbers are almost impossible to come by, and estimates vary widely, but the bottom line is that for a popular service that relies on generative AI, the costs of running it far exceed the already eye-watering cost of training it. That’s because AI has to think anew every single time something is asked of it, and the resources that AI uses when it generates an answer are far larger than what it takes to, say, return a conventional search result. For an almost entirely ad-supported company like Google, which is now offering AI-generated summaries across billions of search results, analysts believe delivering AI answers on those searches will eat into the company’s margins. (…)
A recent survey conducted by Microsoft and LinkedIn found that three in four white-collar workers now use AI at work. Another survey, from corporate expense-management and tracking company Ramp, shows about a third of companies pay for at least one AI tool, up from 21% a year ago.
This suggests there is a massive gulf between the number of workers who are just playing with AI, and the subset who rely on it and pay for it. Microsoft’s AI Copilot, for example, costs $30 a month.
OpenAI doesn’t disclose its annual revenue, but the Financial Times reported in December that it was at least $2 billion, and that the company thought it could double that amount by 2025.
That is still a far cry from the revenue needed to justify OpenAI’s now nearly $90 billion valuation. The company’s recent demo of its voice-powered features led to a 22% one-day jump in mobile subscriptions, according to analytics firm Appfigures. This shows the company excels at generating interest and attention, but it’s unclear how many of those users will stick around.
Evidence suggests AI isn’t nearly the productivity booster it has been touted as, says Peter Cappelli, a professor of management at the University of Pennsylvania’s Wharton School. While these systems can help some people do their jobs, they can’t actually replace them. This means they are unlikely to help companies save on payroll. He compares it to the way that self-driving trucks have been slow to arrive, in part because it turns out that driving a truck is just one part of a truck driver’s job.
Add in the myriad challenges of using AI at work. For example, AIs still make up fake information, which means they require someone knowledgeable to use them. Also, getting the most out of open-ended chatbots isn’t intuitive, and workers will need significant training and time to adjust.
Changing people’s mindsets and habits will be among the biggest barriers to swift adoption of AI. That is a remarkably consistent pattern across the rollout of all new technologies.
None of this is to say that today’s AI won’t, in the long run, transform all sorts of jobs and industries. The problem is that the current level of investment—in startups and by big companies—seems to be predicated on the idea that AI is going to get so much better, so fast, and be adopted so quickly that its impact on our lives and the economy is hard to comprehend.
Mounting evidence suggests that won’t be the case.
This reminds me when, in the mid-1990s, explaining my rather large investments in cellular technology, I was regularly rebuffed by naysayers focused on the then large and heavy handsets. When I said that cellphones would eventually become ubiquitous and that everybody would carry one and be constantly reachable, many people shouted “no way!”.
The Blackberry arrived in 1999, the iPhone in 2007, Android in 2008.
The same, and likely much more, will happen with AI as it evolves. Just in my household (trigenerational), we are all using Perplexity more and more often as we see the increasingly numerous ways it can help. AI will soon be embedded in phones with lots of user-friendly applications. Heck! our 14-month grandson is already shouting “Hey Google”.
SURVIVAL TIPS
John Authers often includes this in his great columns. Here’s my first survival tip. It’s a real one.
Live to 100: Secrets of the Blue Zones Travel around the world with author Dan Buettner to discover five unique communities where people live extraordinarily long and vibrant lives.