MANUFACTURING PMIs
USA: April PMI rises to seven-month high amid stronger demand, despite sharper price increases
Operating conditions improved markedly across the US manufacturing sector, according to April PMITM data from S&P Global. The uptick in the headline figure was driven by a quicker expansion in output, a softer deterioration in vendor performance and a series-record rise in pre-production inventories. Although lead times lengthened further, severe material and capacity shortages at suppliers led to sharper increases in cost burdens and selling prices. Meanwhile, firms continued to hire additional staff to ease pressure on capacity, as backlogs of work rose at the slowest pace since February 2021.
At the same time, firms were strongly upbeat regarding the 12-month outlook for output, but concerns regarding inflation and geopolitical tensions pushed confidence to the lowest for six months.
The seasonally adjusted S&P Global US Manufacturing Purchasing Managers’ Index™ (PMI™) posted 59.2 in April, up from 58.8 in March but lower than the earlier released ‘flash’ estimate of 59.7. The rate of overall growth accelerated for the third month running and was the sharpest since last September.

Contributing to the stronger upturn in the health of the manufacturing sector was a faster rise in output during April. Growth in production was linked to greater new order inflows and the delivery of materials which allowed capacity to expand. The pace of expansion was steep overall and the sharpest since July 2021.
New orders increased at a marked pace at the start of the second quarter, and at a rate broadly in line with that seen in March. Companies reported stronger demand conditions, with some noting that new sales expanded despite substantial rises in prices.
Meanwhile, new export orders grew at the fastest rate for almost a year. The expansion in new sales from abroad was attributed to greater demand in key export markets and the acquisition of new customers.
On the price front, input costs rose substantially and at the sharpest rate in four months. Higher cost burdens were attributed to greater material and supplier prices, notably increased transportation, fuel and metals expenses.
Firms continued to pass higher material and staff costs on to clients in April, as the rate of charge inflation accelerated. The increase in selling prices was the fastest since last October.
In line with a further upturn in new orders, firms raised their input buying at a sharp pace. Many companies stated that higher purchasing activity was linked to efforts to stockpile inputs amid price increases and material shortages. As a result, pre-production inventories expanded at the steepest rate on record. Stocks of finished goods continued to contract, however, the pace of decline eased to the slowest
since February 2021.
At the same time, manufacturers recorded a solid rise in employment in April. Workforce numbers grew following greater production requirements and in response to staff leaving voluntarily. Some firms also stated that job creation was linked to the filling of long-held vacancies. Labor shortages continued to be mentioned as a weight on growth, however.
Although sharp, the rate of expansion in backlogs of work eased to the softest for 14 months. Finally, business confidence remained upbeat. Strong optimism was attributed to hopes of reduced supply chain
disruption and increased hiring. Concerns regarding inflation and geopolitical tensions led the level of positive sentiment to slip to a six-month low.
Wondering what inflation was last October? CPI: +0.86% MoM, PPI: +2.0% MoM:

The ISM Manufacturing survey, more focused on larger companies, is going the other way as the Haver Analytics chart illustrate:


The April Manufacturing PMI® registered 55.4 percent, a decrease of 1.7 percentage points from the March reading of 57.1 percent. (…) This is the lowest reading since July 2020 (53.9 percent).
The New Orders Index registered 53.5 percent, down 0.3 percentage point compared to the March reading of 53.8 percent. (…) The Employment Index figure of 50.9 percent is 5.4 percentage points lower than the 56.3 percent recorded in March. (…) The New Export Orders Index reading of 52.7 percent is down 0.5 percentage point compared to March’s figure of 53.2 percent. (…)
Panelists reported higher rates of quits compared to previous months, with fewer panelists reporting improvement in meeting head-count targets. (…) Surcharge increase activity across all industry sectors continues. Panel sentiment remained strongly optimistic regarding demand, though the three positive growth comments for every cautious comment was down from March’s ratio of 6-to-1.
Panelists continue to note supply chain and pricing issues as their biggest concerns. (…)
WHAT RESPONDENTS ARE SAYING
- “Tier-2 supplier shutdowns in Shanghai are causing a ripple effect for our suppliers in other parts of China. Long delays at ports, including in the U.S., are still providing supply challenges. Inflation is out of control. Fuel costs, and therefore freight costs, are leading the upward cycle. At some point, the economy must give way; it will be tough to have real growth with such pressure on costs. Despite the issues and poor outlook, business remains brisk.” [Chemical Products]
- “Continued strong demand with improvements in the supply chain. Delays still exist, but supply issues are slowly improving. Cost increases in multiple categories.” [Transportation Equipment]
- “Supply chain is still constrained, and prices continue to rise. We are focusing on ways to stay profitable while continuing to fill customer orders. Relationship management and strong negotiation skills are extremely important right now.” [Food, Beverage & Tobacco Products]
- “New order entries are still very strong. Unfortunately, logistics issues have (not) yet improved, so lead times remain extended.” [Machinery]
-
“Business is strong. Backlog continues to grow due to new orders and inconsistent supply chain conditions. Shortages of components are the main factor limiting our production.” [Electrical Equipment, Appliances & Components]
- “The shutdowns in China due to a new COVID-19 wave are causing supply concerns for late second quarter and early third quarter. We have extended lead times to customers and are ordering product from China to cover demand through Q4 and early 1Q 2023.” [Miscellaneous Manufacturing]
- “Overall, improvements in supply chain are occurring on larger scale items, but we see suppliers that sell us low-volume items struggling in some cases with getting feed stocks and raw materials they need. Freight continues to plague things as well.” [Nonmetallic Mineral Products]
- “Business is still very robust. Material price increases continue to be passed on (to customers) based on costs of raw materials, logistics and labor to produce products.” [Plastics & Rubber Products]
Seventeen of 17 manufacturing industries reported growth in new orders in March, compared with 15 in March, 16 in February, 11 in January and 13 in December.
- Commodities Up in Price: 36 vs 45 in March, 33 in February, 35 in January, 28 in December and 36 in November.
- Commodities Down in Price: 1 vs 1 in March, 6 in February, 7 in January, 8 in December and 5 in November.
- Commodities in Short Supply: 18 vs 24 in March, 13 in February, 16 in January, 10 in December and 21 in November.
In case you wonder which manufacturing survey to trust, S&P Global’s (formerly Markit) has been more accurate since 2007, but the ISM, having been around forever, is the most widely followed. S&P Global intends to change that.
Canada: Solid growth in manufacturing production sustained in April
April data signalled another robust expansion in operating conditions in the Canadian manufacturing sector, despite a slight moderation since March. Looser COVID-19 restrictions and a general improvement in demand conditions led to strong inflows of new work. Subsequently, output and purchases rose sharply. Meanwhile, strong capacity pressures continued to emerge which firms responded to by raising their staffing levels at an accelerated pace.
As for prices, firms continued to face steep cost pressures with higher charges for transportation, material and fuel reported. Geopolitical tensions were also blamed for elevated rates of inflation, feeding through to sentiment which moderated from March’s five month high.
The seasonally adjusted S&P Global Canada Manufacturing Purchasing Managers’ Index® (PMI®) registered at 56.2 in April, down from March’s survey-record high of 58.9. The latest reading continued to indicate robust operating conditions and extended the current period of growth to 22months, but dipped to a joint 14-month low.

Central to the improvement was a solid uptick in new orders. Firms often mentioned securing new clients in the domestic market. Sales to international clients also increased with exports rising for the second successive month.
With strong demand conditions persisting, firms raised their production levels at the start of the quarter. Output rose sharply, though at a softer pace than that seen in March. Consumer goods firms raised their output levels at the strongest rate followed by those in the investment and intermediate goods sectors, respectively.
Vendor performance deteriorated greatly during the month, although to the joint-weakest degree since November 2020. There were widespread reports of material scarcity, truck shortages and freight delays. Consequently, backlogs rose sharply. Firms did, however, seek to tame the rise in incomplete work by adding to headcounts, though this was not enough to curb an increase in outstanding business.
Firms also mentioned that there were still shortages of skilled labour. Subsequently, firms had little capacity to raise post-production inventories, which fell slightly in April. Raw material scarcity and lengthy lead times prompted Canadian manufacturing firms to raise their pre-production inventories. Stockpiling has now been seen in each of the last 15 months. Purchasing activity, meanwhile, rose substantially, and at the third-strongest rate in the series history.
Turning to prices, input price inflation moderated from March’s peak. The rate of increase was still substantial, however, and among the quickest in the series history. A number of reasons were cited for higher input costs including rising fuel, material, transportation and labour expenses. The war in Ukraine also reportedly drove up input costs.
Consequently, selling prices rose sharply. In fact, the rate of inflation was the second-strongest in the series history surpassed only by that seen in March. Firms reported efforts to protect profit margins and pass on higher transportation and material costs. (…)
Eurozone: Manufacturing growth weakens further amid record output price inflation
Eurozone manufacturers lost further growth momentum at the start of the second quarter as output increased only marginally and at the weakest rate over the current 22-month sequence of growth. The slower expansion was accompanied by a subdued increase in new orders and sustained supply-side pressures as COVID restrictions in China and the ongoing war in Ukraine caused disruptions.
Meanwhile, amid supply-chain challenges, input price inflation accelerated to a five-month high amid soaring fuel and energy costs. Manufacturers responded with the fastest increase in selling prices on record during April.
The S&P Global Eurozone Manufacturing PMI® fell to a 15-month low of 55.5 in April, from 56.5 in March. While still above the 50.0 no-change mark and therefore indicative of improving operating conditions within the goods-producing sector, it marked a sustained loss of growth momentum as the headline PMI fell for the third month running.


Headline PMI figures for each of the three broad market groups registered in expansion territory. The highest reading was at investment goods, despite output here declining. Consumer goods saw the second-strongest expansion, while the intermediate goods sub-sector
Of the monitored eurozone constituents, the Netherlands recorded the strongest upturn during April as growth accelerated. Elsewhere, with the exception of France, PMI readings fell over the month and in each case were at their lowest in over a year. Latest survey data for Germany was particularly noteworthy as both new orders and output slipped into contraction territory for the first time since June 2020.
On aggregate, eurozone manufacturing production increased during April. However, the rate of expansion was only marginal and the slowest seen across the current growth sequence which began in July 2020. Consumer and intermediate goods producers drove the latest increase as capital goods makers recorded the first contraction in output for almost two years.
Latest survey data also highlighted subdued order book growth at the beginning of the second quarter. Although still rising overall, the increase in new business was modest and the weakest in the 22-month growth sequence. The softer upturn in demand for eurozone goods was partly reflective of export market weakness as new orders from foreign clients fell for the second month in succession.
Production growth was also weighed down by ongoing and severe supply-chain disruptions in April. Panellists continued to report widespread shortages for numerous raw materials and components, although transportation issues were also reported as a consequence of the war in Ukraine and a tightening of COVID restrictions in China. Overall, the extent to which delivery times lengthened was considerable.
As a consequence of supply shortfalls, vendors raised their prices for raw materials and components in April. Compounding supplier price hikes were soaring fuel and energy costs, with latest survey data signalling a steep rate of input price inflation that was the strongest in five months. To combat margin pressures, eurozone manufacturers increased their factory gate charges by the greatest extent on record (series began in November 2002).
Nevertheless, euro area goods producers continued to make additional purchases during April and were able to stockpile inputs. That said, the increase in buying activity was the weakest since November 2020. On the other hand, warehoused finished goods fell once again.
Meanwhile, evidence of stretched operating capacities were seen as backlogs of work rose once again. However, the rate of accumulation in outstanding business was the weakest since January 2021 amid another strong increase in employment. The rate of jobs growth was slightly faster than in March and outpaced its historical average by a notable margin.
Finally, after slumping to their lowest since May 2020, future output expectations strengthened slightly in April. That said, business confidence remained well below that seen in February as concerns surrounding inflation and the war in Ukraine clouded the 12-month outlook.
Japan: Softer improvement in manufacturing conditions in April
The Japanese manufacturing sector registered a solid, albeit softer improvement in operating conditions at the start of the second quarter of 2022, according to April data. Firms reported a slower expansion in incoming business while growth in production levels was broadly unchanged on the month. Firms were increasingly commenting that delivery delays and material shortages had weighed on demand and output, notably as input prices continued to rise at a substantial rate that was among the sharpest in the survey history. This contributed to a series record increase in output charges in April. Manufacturers also commented that shortages and delays were exacerbated by the Ukraine war and renewed lockdowns in China, which pushed confidence to a 21-month low.
At 53.5 in April, the headline au Jibun Bank Japan Manufacturing Purchasing Managers’ Index™ (PMI) dipped from 54.1 in March, indicating a softer improvement in the health of the sector that was the second-weakest in the past six months.

The lower reading of the headline index was partly the result of a softer rise in new orders. Sales increased for the seventh month running, though growth eased to a milder pace overall. Firms commented that growth was held back by delivery delays and the Russia-Ukraine war. Geopolitical tensions and rising COVID-19 cases in China continued to weigh heavily on export orders, which fell solidly for the second month running.
Production levels increased for the second successive month in April, with the rate of growth little-changed from March. Firms linked the expansion to rising new orders, though difficulty securing inputs had prevented an acceleration in growth.
In response to ongoing supply chain disruption, buying activity rose at the sharpest pace since January at the start of the second quarter. Japanese manufacturers noted ongoing difficulties in sourcing and receiving inputs due to shortages and surging prices. Concurrently, supplier delivery times lengthened at a broadly similar, yet marked degree in April, with average vendor performance among the worst in the survey history. As a result, businesses aimed to build greater inventories of pre-production inventories.
Manufacturers also commented that a lack of raw materials had disrupted the ability to complete existing orders, as evidenced by a sustained rise in outstanding business. At the same time, firms increased employment levels in response to higher production requirements. The rate of job creation was the weakest for nine months, however, amid an increased number of voluntary leavers.
Business confidence regarding activity over the coming year eased further in April. The degree of positive sentiment was strong overall, yet was the weakest since July 2020. Firms cited hopes that a resolution to price and supply issues would trigger a broad economic recovery, though this was dampened by concerns regarding a prolonged impact from COVID-19 and the Russia-Ukraine war.
Note: China PMI was reported yesterday.
Speaking of China, Malcolm Ridell posted an interview with Joerg Wuttke in The Market, a leading German-language financial website. Joerg Wuttke is the president of the EU Chamber of Commerce in China and has lived and worked in China for over 30 years. “He is arguably the most influential foreign business leader in China.”
 Please read through, well worth it:
Q: ‘Do you see any indication that the Zero Covid policy, which is behind the lockdowns, is being reconsidered?’
Mr. Wuttke: ‘No, nil.’
‘The authorities have made the Chinese population genuinely afraid of the virus.’
-
‘The authorities do not inform that the Omicron variant is milder, they do not inform that other countries have learned to live with the virus – they can’t admit that people in Europe can fly on vacation again and live largely a normal life.’
-
‘The authorities have spent a year bad-mouthing Western mRNA vaccines, with the result that people in China don’t trust the vaccination – and the authorities can’t admit that it would make sense to use mRNA vaccines in addition to the Chinese vaccines.’
‘For the past two years, the party leadership and government have spun the narrative that China has handled the pandemic much better than the decadent West.’
-
‘Now this narrative is blowing up in their faces.’
‘President Xi wants to be confirmed for a third term at the 20th Party Congress in the fall, so he cannot change his narrative this close to the finish line.’
-
‘Until the 20th Party Congress, they will stick to the Zero Covid policy.’
Q: ‘So given the choice between pandemic control and the economy, the economy gets the short end of the stick?’
‘The system’s focus on Zero Covid leads to many decision-makers being in a kind of self-destruction mode.’
‘Imagine you’re a mayor of a medium-sized city and a truck comes with supplies for a local factory with parts from the Shanghai area.’
-
‘Do you let the truck pass and run the risk that the driver will bring Omicron and you will have local contagions?’
-
‘If you have Covid in your city, you have a problem.’ (…)
‘In current politics, business people’s messages hardly get through anymore.’
-
‘Politicians’ fear is too great.’
Q: ‘Officially, the government expects 5.5% GDP growth this year. Is that still realistic?’
‘All signs indicate that the politicians do not want to solve the problem, but only to limit it.’
-
‘I don’t see any vaccination campaign, no information campaign, no imports of mRNA vaccines, and I don’t see the population being told that society can live with it.’
-
‘So I have to assume that Zero Covid will result in locking down this city and then that city on a monthly basis, at least until the Party Congress gives President Xi a third term.’
Q: ‘Did the downturn accelerate in April?’
Mr. Wuttke: ‘Yes, big time.’
‘GDP growth of 4.8% in the first quarter was probably already slightly managed upward.’
-
‘But the real shocker will come with the data for April.’
‘Remember, 2021 was a banner year for China’s economy, especially in the manufacturing sector.’
-
‘January started at a high level, February and March were still okay.’
-
‘But from March 28th, with Covid in Shanghai, everything collapsed.’
Q: ‘To soften the blow, the government is trying to stimulate. Is it working?’
Mr. Wuttke: ‘The stimulus measures are like a band-aid for an amputation.’
‘The People’s Bank of China pumps some liquidity into the system, money flows into infrastructure projects and state-owned enterprises receive support.’
-
‘But that doesn’t get private companies and foreign corporations to invest again.
‘All over China, entrepreneurs look to Shanghai and have to deal with the scenario that the same thing could happen in their city.’
-
‘So, until further notice, they hit the pause button and freeze almost all investment plans.’
-
‘There’s no fiscal policy that can compensate for this restraint.’
-
‘Investment ambitions will not come back until there is confidence that the Covid policy will change.’
‘Nationwide, freight volumes in April are down 15% year-on-year.’
-
‘Freight traffic volumes in the Shanghai metropolitan area plunged by 81% year-on-year in the first three weeks of April.’
-
‘Jiangsu province recorded a drop of 30%.’
-
‘In Guangdong province, China’s economic powerhouse, freight volumes have plunged by 17%, even though there is no lockdown.’
-
‘There are currently no trains running between Nanjing and Shanghai; the authorities in Nanjing are so riddled with fear that they won’t allow any traffic.’
‘I hear of car manufacturers that produce in Jiangsu province and are not directly affected by the lockdown.’
-
‘But they can’t get parts from their hundreds of subcontractors, either because the subcontractors can’t produce or because shipments can’t get through the lockdown areas.’
‘These effects will only be seen in the economic data over the next few months.’
Q: ‘Will this mean continued production stoppages, clogged ports and strained supply chains?’
Mr. Wuttke: ‘Definitely.’
‘Shanghai has the largest port in the world.’
-
‘It’s not in lockdown. It’s running quite well.’
Q: ‘How is the impact being felt in Europe?’
Mr. Wuttke: ‘In Europe, you haven’t even begun to see the effects of these problems.’
-
‘The ships coming into Europe today left Shanghai before the lockdown.’
‘Only in May and June will we see where the electronic equipment, the machine parts, the pharmaceutical precursors, and components are missing.’
-
‘That will then lead to further shortages in the global supply chains.’
Q: ‘How are foreign companies in China reacting?’
Mr. Wuttke: ‘China is losing its credibility as the best sourcing location in the world.’
-
‘China has lost its nimbus as a base for sourcing and manufacturing, at least for now.’
‘With the current situation in China comes a huge loss of confidence, which will eventually lead to changes in supply chains.’
-
‘Foreign companies are not packing up and moving out of China, but they are considering moving parts of their investments to other countries.’
‘And I am now hearing from more and more foreign companies that they are trying to move their supply chains to other countries.’
-
‘For the first time, I see a number of companies looking to other Asian countries for their sourcing.’
‘That means their sourcing will be more expensive, because you can’t simply replace the extremely efficient Chinese cluster in many areas.’
-
‘But a more expensive sourcing is better than nothing.’
-
‘As a CEO or as a purchasing manager, you can’t just fly quickly to Shanghai or to Guangzhou.’
-
‘But today you can easily get to Jakarta, Kuala Lumpur or Manila.’
Q: ‘Do you see any prospects at all for market-friendly reforms in China?’
Mr. Wuttke: ‘My experience in China is that when things get really bad, the technocrats come in.’
-
‘And they do make some reforms that are right.’
-
‘Perhaps they will realize in Beijing that they need foreign companies after all.’
-
‘Perhaps they will then open the doors wider again.’
-
‘But today, of course, we are not there yet.’
‘For now, China is not getting out of the corner the president has maneuvered the country into.’
-
‘They are prisoners of their own narrative.’
To summarize all of the above,
- North American manufacturing is in boomflation mode.
- The Eurozone and Japan are still strong but seeing softness in new orders.
- Everybody is stockpiling, everywhere.
- Costs keep rising strongly but are passed on easily.
- Supply chains challenges are not easing and are not about to ease given the war China’s problems.
Nordea:
The March CPI reading will likely prove to be the peak in headline year-on-year inflation, but there are more signs that we will see stubbornly high inflation rather than a swift reversing. The first reason is that energy and food inflation has been markedly exacerbated by the war in Ukraine, with the latter showing no signs of slowing. The second reason is that supply side problems are much more sticky than earlier anticipated. Risks are that the slowdown in goods inflation, will take longer to materialise.
Another worry is the strong momentum in nominal wage growth, which is supported by the historically hot labour market, and raise the risks that we will see rising service inflation, as consumers fade goods and shifts into services. If inflation continues to surprise to the upside it will most likely lead the FOMC to act and talk even tougher at upcoming meetings.
The Transcript:
“In terms of inflation in our own businesses it’s extraordinary how much inflation we have seen.” – Berkshire Hathaway (BRK.B) Chairman & CEO Warren Buffett
“We are seeing absolutely record inflation. And the supply chain disruption is still there. So probably one of the more difficult periods that I have known in my career from an operational perspective.” – Mondelez International (MDLZ) CEO Dirk Van de Put
“…our pricing is up roughly 8%. Again, that’s first quarter this year over the first quarter last year — we haven’t seen any substantial increase in consumer resistance from this pricing.” – McDonald’s (MCD) CEO Chris Kempczinski
“Inflation was in the transportation costs, especially in wage inflation last year. It remains there. It’s been amplified a bit by the fuel costs following the Ukraine conflict, which has happened since we last spoke. So, it’s more a factor — those costs will now, we believe, will persist a little longer than we were hoping at the beginning of the year.” – Amazon (AMZN) CFO Brian Olsavsky
The key remains the consumer and David Rosenberg is among the most pessimistic economists, noting that “over 80% of the growth in Q1 real consumer spending all took place in January” and that “in the past, when we had a negative GDP reading in a quarter, for whatever reason, we either were in a recession or heading into one more than 80% of the time.”
But the consumer is in good shape according to credit card companies and bankers as The Transcript reveals:
“At this stage, in terms of volumes, we have seen no noticeable impact due to inflation, supply chain issues, or the war in Ukraine.” – Visa (V) CEO Al Kelly
“On the macroeconomic front, consumer spending remains strong, particularly as economies across the globe continue to reopen and pandemic-related restrictions are lifted — According to our quarter one spending pulse report, which is based on all payment types, including cash and check, US retail sales ex-auto, ex-gas were up 4.7% versus a year ago” – Mastercard (MA) CEO Michael Miebach
“…consumers are out there spending. Now, what’s driving that is the second part of it and what you mean by dry powder. If you look in the consumer accounts so you take, talked yesterday about two cohorts, customers had 1 to $2,000 in their accounts pre-pandemic, average 1,400 or so. They now have about 3,400 or 3,500 in the account. For people who averaged between two and $5,000 average clear balance in their account, they now have, they average about $3,000. They now have about 12, $13,000 in their account.” – Bank of America (BAC) Chair & CEO Brian Moynihan
That may be because of the recent surge in travel spending. From the Chase card spending tracker, spending on “travel and entertainment” is among the only strong categories lately. With data through April 25, Chase estimates that control retail sales (goods) are up 0.8% MoM in April after +0.7% in March, before inflation.
Amazon’s recent results and guidance tend to confirm this. And how about demand for pizza:
“Given the softness in comparable sales trends in the U.S. and the resulting contraction of operating income as a percentage of sales in the first quarter, we expect margins for the rest of 2022 to be pressured.” – Domino’s Pizza (DPZ) CEO Ritch Allison
Workers Strike at Machine Maker CNH Industrial The United Auto Workers union is pushing for better terms at the Deere competitor, amid rising inflation and a tight labor market.
(…) The strike at CNH involves about 1,100 workers at the company’s plants in Racine, Wis., where its farm tractors are built, and Burlington, Iowa, where construction machinery is assembled. The action is the latest in a series of strikes at large U.S. companies where unions have pushed for higher wages and better benefits amid rising inflation, a tight labor market and rising corporate profits. (…)
After approving the contract in November, Deere workers received an immediate 10% raise and each worker received an $8,500 bonus. Additional 5% pay raises will be provided to Deere workers in two other years, and lump-sum bonuses amounting to 3% of workers’ annual pay will be awarded in the three other years. (…)
EU Prepares Phased-In Ban on Russian Oil The bloc’s executive is expected to propose a phased-in embargo on Russian oil, taking effect by year-end, after Germany came out in support of a ban.
The Hideous Strength of the U.S. Dollar The U.S. currency’s rapid rise will make it harder for other countries to curb inflation.
(…) The Federal Reserve needs to be mindful of the threat to global growth posed by the U.S. currency’s rapid ascent. (…)
The stronger dollar is also doing the Fed’s work in combating inflation by tightening financial conditions on a trade-weighted basis. Although the U.S is the world’s largest economy and a huge importer of goods, it is relatively insulated from the global energy and food price shock by its domestic production of fuel and foodstuffs. It also benefits because all major commodities are priced in dollars. It’s everyone else’s problem if raw materials suddenly become more expensive in their respective currencies. (…)
The current weakness in the currencies of Japan and Europe would typically be welcomed for juicing their exports. But the recent slippage in the Chinese yuan, the world’s second-most important trade-weighted currency, puts matters into a different league. All three regions are facing an unusual and potentially intractable problem of imported inflation. There’s a clear and present danger of rising prices slowing global economic growth to the extent that a recession is possible, and stagflation a real risk. (…)
For the sake of the global economy, here’s hoping King Dollar’s crown starts to slip.
Nordea:
King dollar. The dollar has reached historically high levels as markets have repriced the Fed’s tightening cycle and investors have sought dollars in times of market turmoil. In the short-term, the dollar is unlikely to see any relief on Fed policy with market sentiment being the most likely catalyst for a retreat in the dollar. The Fed will front-load interest rate hikes and tighten dollar liquidity through QT. We suspect that the Fed actually welcomes a strong dollar to offset goods inflation, especially versus China, which means the king dollar will be difficult to dethrone in the current currency complex for the time being.
SENTIMENT WATCH
Traders Bet New Waves of Bond Selling Will Push Yields Over 3.15%: MLIV Pulse Survey
In the last MLIV Pulse survey, a clear majority of the 807 market participants project the 10-year yield will climb above 3.15% — peaking only in the third quarter — while 41% reckon it will eventually hit 3.4% from about 2.9% currently. (…)
More than half of the survey respondents expect five-year yields adjusted for inflation to turn positive by the end of June, implying a roughly 40-basis-point jump from Friday. To push the rate that high, that fast would require either a rapid move up in the nominal rate thanks to strong growth or lower inflation expectations. The five-year TIPS yield jumped 19 basis points today as the 10-year TIPS yield turned positive.
No wonder AC/DC’s “Highway to Hell” and Bon Jovi’s “Livin’ on a Prayer” were among the most-popular songs chosen by survey participants as the soundtrack for the great monetary tightening campaign of 2022.
The survey respondents consisted of 30% retail investors and 63% institutional, with portfolio managers the largest in the latter category. Slightly more than half of the votes came from the U.S. and Canada. The highest proportion of monetary hawks were risk managers. (…)
Yesterday’s late surge in equities was not enough to give encouraging signals. Six sectors closed up and 5 down. Demand was “modest” and breadth was negative.
Buy-the-dip is dead
Through April, buy-the-dip activity in the S&P 500 is at its 2nd-worst level since the early 1970s. The S&P 500 has lost nearly 0.2% the day following a down day. Year-to-date, the S&P is witnessing one of its worst performances since the 1920s, which may be bad enough to be good longer-term.
This has been one of the worst starts to a year ever for investors, and it’s caused them to abandon BTFD (Buy The F**king Dip).
Bloomberg notes that the tendency of investors to step in after a down day is waning, and S&P 500 pullbacks are lasting longer. (…)
Bloomberg is not wrong. The S&P 500 has returned an average of -0.18% after a down day through April. While it was about as bad in 2018, this is a remarkable change from the past 40 years, when investors greedily snapped up bargains after a down day. Now they’re avoiding dips in case the selling gets even worse, similar to behavior throughout much of the 1930s to 1970s.
The avoidance of buy-the-dip was an excellent sign for contrarians four years ago; the S&P dipped a few more days into early May, then rose steadily through September. Historically, though, it wasn’t a consistent buy signal. The “sell in May” phenomenon typically put a damper on rallies, and over the next one and two months, returns were poor.
If we look at the opposite condition, when investors showed the most eager BTFD attitudes through April, forward returns were much better, and “sell in May” didn’t have much of a hold on their mentalities. (…)
The trouble with statistics is that there’s always something we can show to prove whatever point we wish to make. That’s why we try to always look from multiple angles, keep context in mind at all times, and let data form opinions instead of the other way around. When we look only at poor returns in April, the modest positive bias from multiple weekly losses evaporates. A bad April showed a strong tendency to lead to even worse losses. About the only solace is that there are few precedents in modern times.
As sample sizes constrict, relying on precedents gets harder and harder. So taking this with an even bigger grain of salt, this is only the sixth time in history that the S&P 500 ended April in correction territory for the year. The last time it showed a year-to-date loss of more than 10% through April was 1970, which was the only precedent since 1950. That year preceded even more losses in the months ahead before staging a furious rebound.
If we relax the parameters to generate a larger sample size, 17 years showed at least a 5% YTD loss through April. These showed mostly weak returns over the next couple of months. It’s interesting that since 1950, almost every signal showed a negative return at some point between 3-12 months later.
Overall, the behavior of investors last month tilts to the negative side for the months(s) ahead, but it becomes less clear the further out we look. Performance has been so bad that longer-term returns tend to be above average. It’s the summer months that look to be the most dangerous. We’re in an unhealthy environment with risk-off behavior. Despite some scattered evidence of truly extreme pessimism, our models are not stretched yet, particularly if we’re in a bear market.
EARNINGS WATCH
We now have 279 companies in, an 81% beat rate and a +6.7% surprise factor.
Form ZeroHedge:
So far so good, but that’s as good as it gets. Because while consensus 2022 EPS rose 1% since April 1, it was entirely driven by Energy (and dropped -0.2% ex-Energy). Worse, when looking forward, both BofA’s guidance ratio (sliding to just 0.7x in April) and its earnings revision ratio (0.8x) have plummeted to the lowest since 2Q20, confirming the collapsing outlook trend we first noted one week ago.

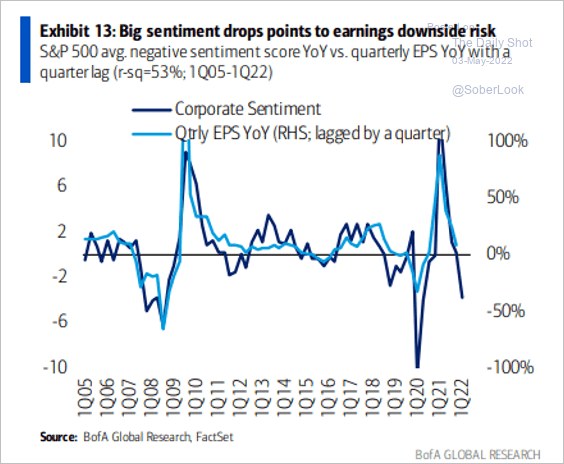
It’s not just guidance that is imploding: according to Bofa’s Predictive Analytics team corporate sentiment sharply fell this quarter, representing the lowest level since 2Q20. Other than the COVID-impacted 1Q-2Q20, this marks the lowest level since 2Q16 when trailing 12-mo. EPS fell 2.7% peak-to-trough.
Worst of all, the sentiment score has also been highly predictive of the following quarter’s earnings growth YoY (54% r-sq), and points a sharp drop in earnings ahead.
Adding insult to injury, companies’ mentions indicate a sharp drop in business conditions, with the spread between “better” or “strong” vs. “worse” or “weaker” falling to the lowest level since 2Q20. (…)

Meanwhile, oblivious to reality, Wall Street consensus remains – as usual – too optimistic: as BofA notes, history shows analysts typically start the year too optimistic and cut estimates throughout the year. Since 2001, actual EPS came in 5% below where consensus stood at the beginning of the year on average (-1% excluding 2008 and 2020).
Consensus EPS for both 2022 and 2023 continued to climb higher YTD (+3% and 2%, respectively) driven by higher Energy earnings…
… but expect this to tumble once the weak guidance and slowing macro conditions finally make it clear to Wall Street that the euphoria is now officially over.