Strong Hiring Signals a Shift in Economy The labor market is pivoting toward a post-pandemic world, as the U.S. added 678,000 workers in February, the strongest job growth in seven months.
The U.S. labor market is pivoting toward a post-pandemic world, with a steady stream of adults joining the labor force and employment approaching levels before Covid-19 began its rapid spread.
Employers added 678,000 workers to their payrolls in February, the biggest gain in seven months, the Labor Department said Friday. The jobless rate fell to 3.8% from 4.0% a month earlier, edging closer to the 50-year low of 3.5% hit just before the pandemic.
More than 300,000 people joined the workforce, and the ranks of those reporting being unable to work because of Covid-19 fell by 1.8 million. (…)
The U.S. still has 2.1 million, or 1.4%, fewer jobs than in February 2020. That gap would close in a matter of months at the current pace of hiring. Since October the economy has created three million jobs. (…)
The unemployment rate for workers with no high-school diploma fell to 4.3% last month, the lowest on records dating to 1992. The jobless rate for Black workers fell 0.3 percentage point to 6.6%, though the rate remained twice as high as white workers. The jobless rate for Hispanic workers fell half a percentage point to 4.4%. (…)
The average hourly pay of private-sector workers grew just a penny last month from January, after five consecutive months in which it had grown at least a dime. Average wages fell last month for manufacturing, education and health and hospitality workers. Still, overall, workers earned 5.1% more in February than they did a year earlier. (…)
 Note that the BLS revised its December-January numbers by +92k. In its January release, the BLS had revised November and December by +709k. In just the last 2 months, we found that between November and January the economy generated 1,716M jobs or 572k per month rather than the 915k or 305k per month originally released. That is a +88% revision!
So much for a data-dependent central bank. Mr. Powell was right after all, the job market is indeed “very, very, very strong”.
Not only very strong, consistently very strong: the last 3 months averaged 582k new jobs, the last 6 months: + 583k and the last 12 months: +556k. And February was +678k, before revisions…
At the last 4-month rate of nearly 600k, the labor market will be back to its pre-covid level in June. That assumes that most of the recently retired workers come back. Otherwise, we are at full employment.
KKR’s Henry McVey last month:
Our research suggests that the U.S. labor market is nearly the tightest it has been in many decades. The aging population and antiquated immigration system were already putting substantial pressure on labor availability before the pandemic. Importantly, though, COVID-19 shook previously dormant fault lines in the workforce via a sudden wave of retirements and a pause in immigration flows.
In addition, the pandemic created new challenges around family care and the integration of discouraged workers back into the labor pool. As such, we believe that 2.1 million of the 3.9 million current labor shortfall in the United States may be more permanent in nature.
The workforce participation rate, which over the last three months has averaged 62.0% versus 63.4% pre-pandemic (down 1.4 percentage points), is unlikely to increase, we believe, as much as the Fed and employers hope. (…)
All told, the current quit rate suggests a ‘true’ unemployment rate closer to 1.0–2.0%, not the reported level of 4.0%.
Despite the historic tightness of the labor market, because of inflation U.S. workers actually did not receive a real wage increase in 2021. However, we do think that they will get one in coming years, following what largely has been two decades of wage stagnation. Despite surging employee pay in 2021, real incomes actually fell — on average — 50 basis points in aggregate last year, dragged down by energy, shelter, autos, and food, among other factors.
(…) Also, we must all be cognizant that the global labor arbitrage has evaporated. U.S. manufacturing wages are now less than four times as expensive as those in China today, compared to more than 26x when China joined the WTO in 2001.
These employment trends represent the cornerstone of our thesis about a higher resting heart rate for inflation. In fact, our deeper dive on the structural labor market issues has firmed our conviction in the magnitude and persistence of the inflationary impulses.
The substantial revisions in job numbers radically change the picture for the consumer side of the economy.
- Aggregate weekly payrolls (employment x hours x wages) rose 0.8% MoM in February and the last 4 months averaged +0.76% for a +9.3% annualized growth rate between November and February.
- Total labor income is thus up 10.8% YoY in February and 10.3% above its February 2020 level.
- To January, headline CPI is up 7.5% YoY and +8.8% from its pre-covid level; the PCE price index is up 6.1% YoY and +7.5% from its pre-covid level. While Americans are individually feeling an inflation squeeze on their real income, the booming job market is so far keeping consumers, in aggregate, comfortably above water.
- This is a much more solid picture for consumer spending than that hoping that excess savings would save the day.
If employment and wages both keep rising 0.4% per month like in the past 4 months, and inflation slows from +0.57%/m to +0.4%/m, the inflation bite will not strangle the economy while it lasts.
Given the strong new orders data in the recent PMI surveys, we should no longer worry about the American consumer nor the economy in 2022.
The pressure will be on the Fed to monitor wage trends in this booming labor environment.
More from McVey who thinks the Fed will need to be more aggressive:
However, we do not believe that these measures will be enough to reverse many of the more structural trends in labor that we have identified. Hence, our view is that inflation will be more ‘sticky’ this cycle.
Consistent with this backdrop, we also see more volatility ahead. The early stages of rate hiking cycles almost always coincide with temporary but sharp market drawdowns. (…)
For equity investors, the biggest change is likely to be the onset of multiple contraction this cycle. On the credit side, we also see some volatility, particularly as the implied default rate on products like High Yield are now well below average. That said, given that many companies have termed out their debt at low rates and the economy continues chugging along, our base view remains that Sharpe ratios fall more in Equities than in Credit in 2022.
Most importantly, we think that we have entered a new investment regime for global allocators of capital. Specifically, we envision the more successful asset allocation portfolio will want to include more inflation protection, including Infrastructure, Real Estate, and Asset-Based Finance. (…)


 All this was before Ukraine, however. Another game changer. Inflation is the most immediately impacted data, right within a fully employed economy.
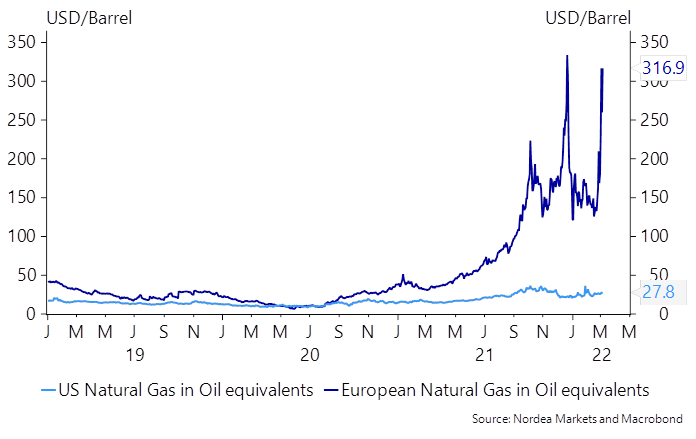
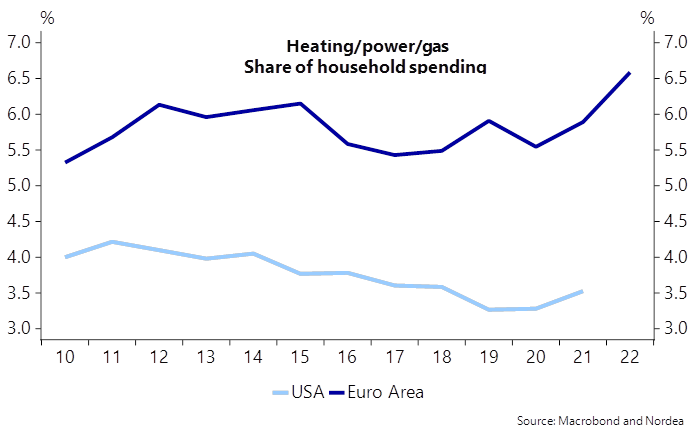
Energy prices are the inflation front line:
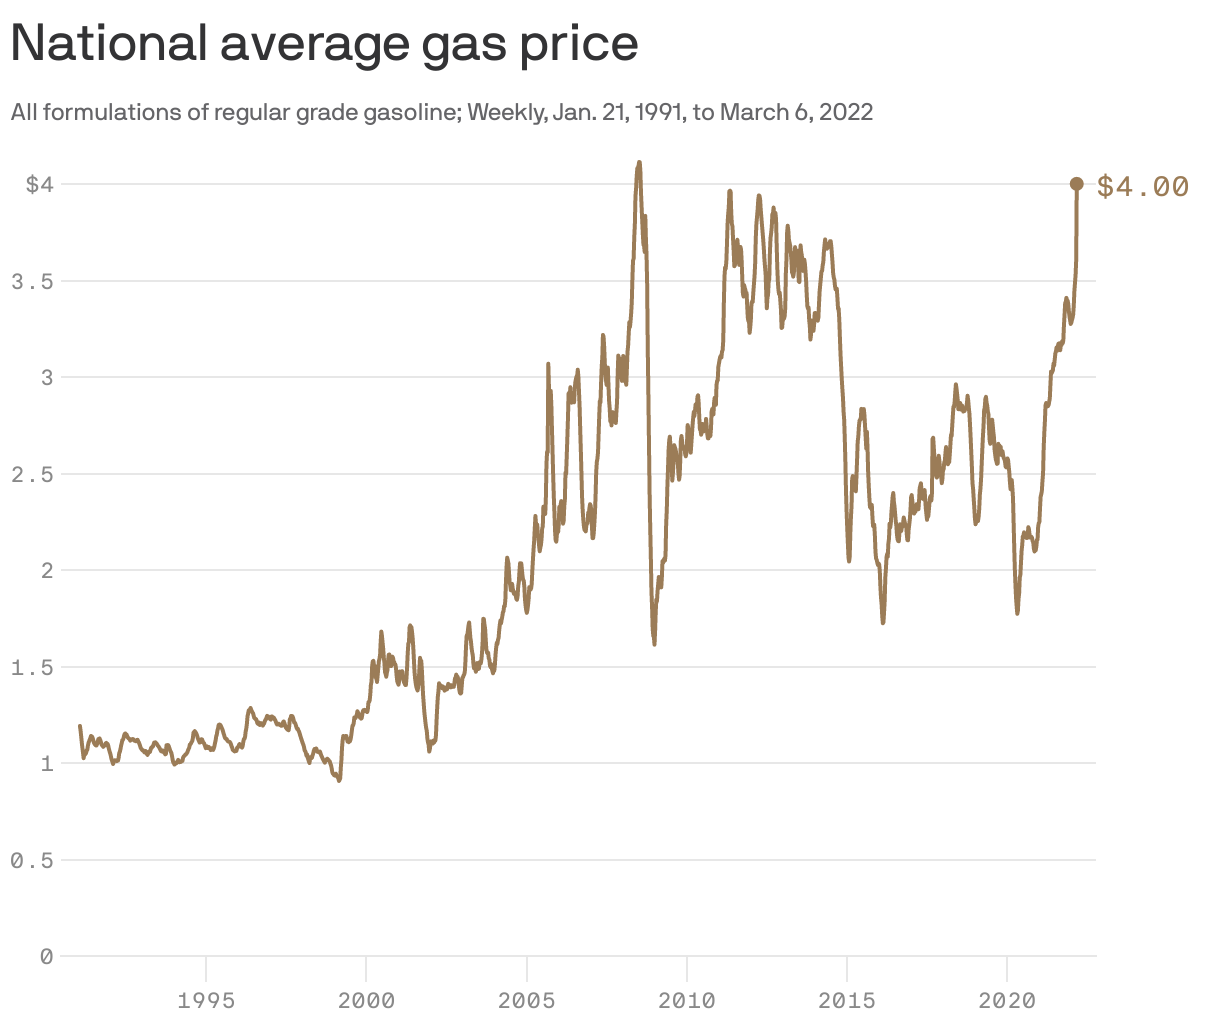 The average U.S. price of regular gas broke $4/gallon ($4.065) for the first time since 2008. Data: U.S. Energy Information Administration/AAA. Chart: Will Chase/Axios
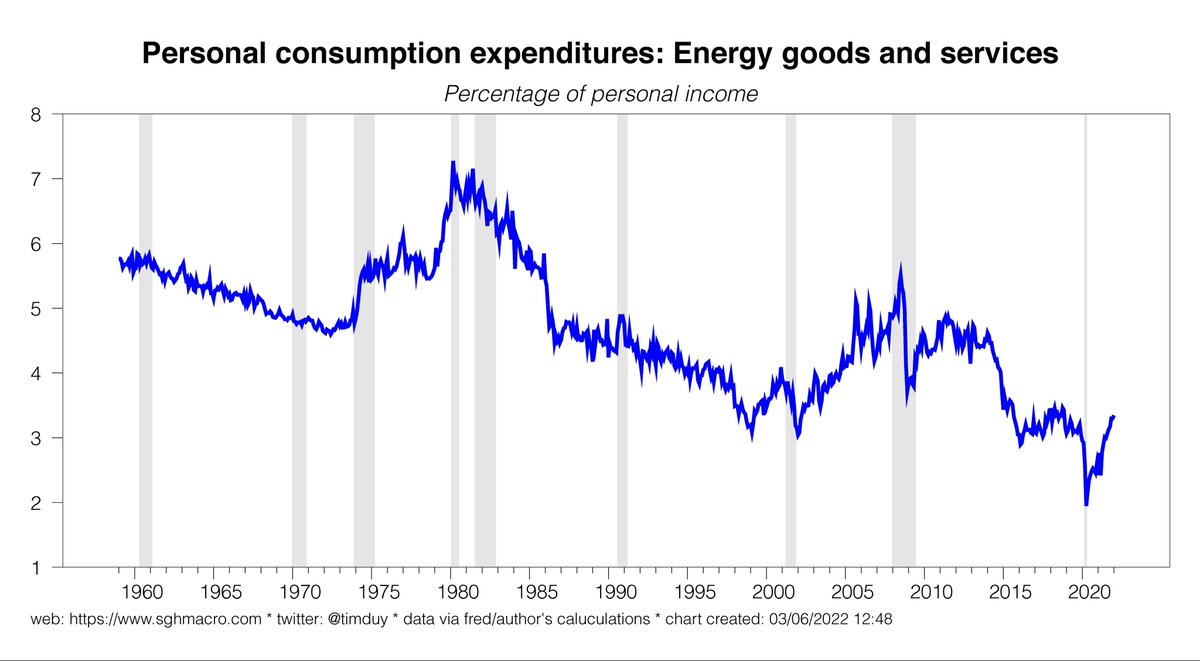
But: Energy spending as percentage of personal income just recently recovered to pre-pandemic levels. Still historically low. (@TimDuy)
Goldman Sachs: Where Russia Matters Most
Russia’s invasion of Ukraine—and the Western response to it—will exacerbate the supply-demand imbalance that lies at the heart of the global inflation surge. Reducing trade with a current account surplus country via sanctions and boycotts means that the rest of the world needs to produce a larger share of what it consumes. The potential shift is fairly small at an aggregate level, as Russia accounts for less than 2% of global goods trade and GDP. It is considerably larger in oil, where Russia supplies 11% of global consumption. And it is huge in natural gas, where Russia supplies 17% of global consumption and as much as 40% of Western European consumption as of 2021.
A Medium-Sized Economy with a Huge Energy Sector

Source: IMF, Goldman Sachs Global Investment Research
GS estimates that a sustained $20 oil shock coupled with higher natural gas prices will lower real GDP by 1.2% in the Euro area (by 0.3% in the U.S). A complete stop of Russian gas would cut real GDP by 2.2%. And “if factories have to shut down because scarce gas is used to heat houses at stabilized rates, the GDP impact could be much larger than the inflation impact.” (…)
And this:
Although the risk of an early reversal by the FOMC has clearly risen, so has the risk of a more lasting inflation increase that lifts the nominal funds rate back to the 4-5% average of the 1990s and early 2000s on a sustained basis. After several decades in which economic. financial, or political shock invariably caused interest rates to fall, markets may have to re-learn that the opposite can also be true.
TECHNICALS WATCH
My favorite technical analysis group saw some market indicators improve a little last week but not enough to reverse caution. More repair is needed after months of damage, particularly on market breadth.
The 13/34–Week EMA Trend is threatening a cyclical bear, some being more damaging and longer than others:

What’s Next For Oil And Gas Prices As Sanctions On Russia Intensify
From J.P. Morgan:
(…) Russia is the second largest producer of natural gas globally, accounting for 16.6% of total global natural gas supply in 2020. That same year, Russia exported 37% of its domestic natural gas production, with the majority of this going to Europe, meeting about 45% of the region’s import demand. About 70% of Russian exports are sent to Europe by pipeline and the region relies heavily on Russian gas transiting through Ukraine. There are three major arteries to move Russian gas to Europe currently in operation: Nord Stream 1 with 55 billion cubic metres per annum (bcmpa) of capacity, the Yamal-Europe pipeline with 33 bcmpa of booked capacity and a trio of pipelines (Brotherhood, Soyuz, and Progress) that transport natural gas through Ukraine into Europe with 40 bcmpa of booked capacity. (…)
With the current potential for infrastructure damage most likely to occur in Ukraine, J.P. Morgan Research estimates there is likely up to 33.5 billion cubic meters of natural gas (bcm) of Russian natural gas exports at risk over the remainder of this year. (…)
“A reduction of 33.5 bcm into Europe over the remainder of the year is quite substantial, accounting for nearly 30% of 2021 Russian natural gas flows into Europe. While this is a substantial disruption, through price, we believe that Europe could attract enough spot LNG to fill the supply gap. It is also important to note that amid the initial disruption of supply, revisiting a price level above 180 euro/MWh is highly likely—a level reached in late-December of last year amid Russian supply uncertainty and the potential for storage to run out in Northwest Europe,” said Chaturvedi. (…)
“With the lack of connectivity between Russian gas fields feeding Europe and the Power of Siberia pipeline exporting gas to China, China is unable to take these specific molecules. Therefore, Russia only really has two options to deal with a significant reduction of natural gas to Europe: to store it or to curtail natural gas production at the wellhead,” said Chaturvedi.
Price impacts from a combination of both sanction-related and Russian-induced supply disruptions would be the most severe and could mean there is no real barrier to how high prices can initially go. Given the potential scale of supply reduction, with the only means to soothe what will be an exceptionally sharp move higher in price—a move beyond what has already been seen in the global gas market over the past 6 months—likely to be from government-mandated energy rationing. The reason that demand destruction will be the only mechanism to slow price’s upward momentum is because there are simply not enough molecules in the global LNG market to make up the shortfall of Russian supply into Europe.
“Therefore, at a bare minimum we believe that TTF price will have to average at an egregiously high level to force natural gas demand destruction around the world. That price level could be an average price of 200 euro/MWh for 2022 or even significantly higher. This would be a structural problem for Europe with market participants grappling with the longevity of this type of supply disruption and as such, these types of higher prices are not likely to only be concentrated in 2022 but also even as far back as 2024,” added Chaturvedi. (…)
With a 12% market share, Russia is also one of largest global oil producers. Almost half of Russia’s oil and condensate exports are directed to Europe. China is the single-largest importing country of Russia’s crude oil, accounting for almost a third of the country’s oil exports. Russia’s oil exports are transported via Transneft’s pipeline system that connects Russian oil fields to Europe and Asia. With its 1.5 mbd (million barrels per day) Druzhba pipeline supplies Russian oil to European refineries in Poland, Germany, the Czech Republic, Hungary and Slovakia via Belarus and Ukraine.
U.S. imports about 600-800 kbd (thousand barrels per day) of Russian oil, which mainly consists of fuel oil feedstocks and some crude. Russian oil imports, as a share of U.S. total oil imports, hit a record high of 10% in May 2021, according to data from U.S. Energy Information Administration, up from 4% in 2008. The rise in Russian imports coincided with the imposition of U.S. sanctions on Venezuela in 2019, as U.S. refiners looked to replace some of their heavy oil supplies that were lost by other sources.
While the U.S. and its allies have so far stopped short of imposing penalties directly on Russian oil and gas, it has become increasingly clear that Russian oil is being ostracized. (…)
Up until recently, Russia was exporting about 6.5 mbd of oil and oil products, with two-thirds clearing through the now-frozen seaborne market. Out of that, Europe and the U.S. accounted for 4.3 mbd, with Asia and Belarus rounding to 2.2 mbd. As the invasion persists, almost 70% of Russian oil is struggling to find buyers. So far, Russia is not withholding volumes. However, Russian producers are facing difficulties selling their oil, with Russian benchmark Urals oil being offered at a record $20 discount to international benchmark, with no bids.
“So large is the immediate supply shock that we believe prices need to increase to $120/bbl and stay there for months to incentivize demand destruction, assuming no immediate Iranian volumes,” said Natasha Kaneva, Head of Global Commodities Strategy at J.P. Morgan.
This could result in a 1.2 mbd hit to this year’s demand, bringing 2022 oil consumption 550 kbd below 2019 levels. If disruption to Russian volumes were to last throughout the year, the Brent oil price could exit the year at $185/bbl, likely leading to a massive 3 mbd drop in the global oil demand. Key to this significant upside is the assumption that even if shale production responds to the price signal, it cannot grow by more than 1.4 mbd this year, given labor and infrastructure constraints.
The Iranian deal could immediately increase supply by 1 mbd over the next two months through the release of floating storage. As Iran ramps up production from the current 2.5 mbd, another 0.8 mbd could be added throughout the second half of the year. Another potential supply response could come from the Organization of the Petroleum Exporting Countries and their allies (OPEC+). The alliance has the capacity to quickly release 1.5 mbd of supply but so far, there is no indication that the group will alter its current plan to increase output in 400 kbd increments. Finally, the third option is the Strategic Petroleum Reserve (SPR) release. The International Energy Agency (IEA) agreed to release 60 million barrels from its members’ strategic reserves, worth barely two weeks of lost Russian supply.
Reflecting the higher risk premium across the oil market and wider commodities complex, the J.P. Morgan baseline view calls for the Brent oil price to average $110 /bbl in the second quarter of 2022, $100/bbl in 3Q22 and $90/bbl in 4Q22, with the possibility that prices rise as high as $120/bbl in the interim, depending on the state of geopolitics. This represents an 11% increase on J.P. Morgan’s November forecast.
If the market begins to price a probability that Russia may take retaliatory measures by reducing its energy exports, a four-month disruption of 2.9 million barrels per day (mbd) of Russian export volumes to Europe and the U.S., will likely see the Brent oil price averaging $115/bbl in 2Q22, $105/bbl in 3Q22 and $95/bbl by 4Q22.
- U.S., European allies discuss banning imports of Russian oil
- Brent spikes to $139 on prospect of Russia oil ban, delay in Iran deal
- Iran Strikes Deal On Atomic Probe, Paving Way for Agreement Iran agreed to provide international atomic monitors with documents that will help resolve a contentious investigation, paving the way for a broader nuclear agreement with world powers and a potential return of Iranian oil to global markets by the third quarter.
- Alberta oil can be a solution to U.S. energy supply crunch – minister Alberta has some spare pipeline and rail capacity and can move more oil to the United States, Savage said in Houston ahead of the CERAWeek energy conference by S&P Global.
Hoping that Mr. Xi would intervene?
China Sets GDP Growth Target of Around 5.5% The target for the year is the lowest level in more than a quarter century of economic planning, reflecting heightened domestic and global uncertainties in a key political year for leader Xi Jinping.
China’s target, which was announced by Premier Li Keqiang on Saturday at the start of the country’s annual legislative session, marks a step down from the already-modest goal of 6% or more that it set for 2021, which it easily surpassed with an 8.1% expansion in gross domestic product. (…)
China’s government also said Saturday it would boost military spending by 7.1% in 2022, up from the previous year’s 6.8% increase and marking its biggest bump in three years. (…)
The economy came into the year with a sharp deceleration in year-over-year growth, from double-digit percentage levels in the first half of 2021 to just 4% growth in the final quarter. (…)
To keep the economic picture from spiraling further out of control, Mr. Li said Saturday the government would step up spending despite an estimated slower growth in fiscal revenue.
The government set a target for an 8.4% year-over-year increase in budget spending this year, up from a 1.8% target in 2021. It expects fiscal revenue to grow by 3.8% in 2022, compared with last year’s projected rate of 8.1%.
It also set the fiscal deficit target at 2.8% of GDP in 2022, down from last year’s 3.2% target, which the government said was a more sustainable rate, while leaving room for unexpected contingencies.
Beijing said it would also offer cash-strapped local governments larger fund transfers from central authorities. Funds transferred from the central government to local authorities will increase 18% this year, Mr. Li said, the biggest jump in years. (…)
“In the face of new downward pressures, steady growth should be given more prominence,” he said. (…)
- China’s Export Boom Eases, Raising Pressure for Stimulus Policy makers are facing the tough task of hitting an ambitious growth target.
Exports in January and February rose 16.3% in dollar terms from a year earlier to $544.7 billion, according to data from the General Administration of Customs. While that beat expectations of a 15% gain among economists polled by The Wall Street Journal, it still marked a slowdown from the 20.9% year-over-year increase in December.
Imports grew 15.5% year over year to $428.7 billion, down from December’s 19.5% increase and in line with the 15.4% predicted by the survey of economists. (…)
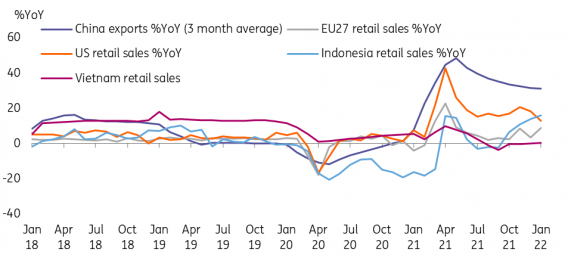
There is a group of export goods that experienced lower volumes YoY YTD and some even contracted though saw higher values. These include rare earth, fertilisers, steel and smartphones. A similar picture was found for imports, for example, coal, crude oil, LNG, timber, pulp and integrated circuits.
This highlights that commodity prices have gone up quickly, and the semiconductor shortage issue has not yet been resolved.
Inflation is embedded in exports and imports and we have to be careful when relying on export and import values to gauge trade flows.
China’s export value growth and retail sales of selected economies
Source: CEIC, ING
If we look at export and import volumes only, without looking at the price and value, we see a different trade picture for China. It did not grow as much. Though the data is incomplete, we can still tell that trade volumes should have decreased on a YoY YTD basis.
There are a few exceptions; one of them is automobile exports, which saw high demand with volumes increasing 69.7% YoY YTD. Export prices increased even more, by 103.6% YoY YTD.
We expect China’s export and import values to continue to increase by more than 10% YoY in the 1H22. But this could be mainly a result of high inflation. And the higher prices might not be seen in exporters’ bottom lines. Freight rates are high at the moment. So the high prices could reflect freight rates, and profits of exporters could be small if the order volumes are small.
Import inflation has yet to show up in China’s CPI but has been reflected in the PPI for more than six months. We believe this pattern will continue as China can exercise price controls if the PPI passes completely to the CPI.
The trade picture doesn’t look as promising as in the past few months but the Two Sessions‘ government work report has highlighted that the government will give more support to SMEs.
EARNINGS WATCH
From Refinitiv/IBES:
Through Mar. 4, 493 companies in the S&P 500 Index have reported earnings for Q4 2021. Of these companies, 76.5% reported earnings above analyst expectations and 20.3% reported earnings below analyst expectations. In a typical quarter (since 1994), 66% of companies beat estimates and 20% miss estimates. Over the past four quarters, 84% of companies beat the estimates and 13% missed estimates.
In aggregate, companies are reporting earnings that are 5.2% above estimates, which compares to a long-term (since 1994) average surprise factor of 4.1% and the average surprise factor over the prior four quarters of 16.0%.
Of these companies, 76.9% reported revenue above analyst expectations and 23.1% reported revenue below analyst expectations. In a typical quarter (since 2002), 62% of companies beat estimates and 38% miss estimates. Over the past four quarters, 79% of companies beat the estimates and 21% missed estimates.
In aggregate, companies are reporting revenues that are 2.7% above estimates, which compares to a long-term (since 2002) average surprise factor of 1.2% and the average surprise factor over the prior four quarters of 4.0%.
The estimated earnings growth rate for the S&P 500 for 21Q4 is 32.0%. If the energy sector is excluded, the growth rate declines to 23.4%.
The estimated revenue growth rate for the S&P 500 for 21Q4 is 15.1%. If the energy sector is excluded, the growth rate declines to 10.9%.
The estimated earnings growth rate for the S&P 500 for 22Q1 is 6.2%. If the energy sector is excluded, the growth rate declines to 1.5%.
Trailing EPS are now $209.57, up 5.8% from their post Q3 level and 27.4% above their February 2020 level. Interestingly, the S&P 500 peaked at 20.6x trailing EPS in February, right where it stands now. But core CPI was 2.3% then, it is now 6.0%. The Rule of 20 P/E was 22.9 in February 2020, it is now 26.6.

Earnings guidance is increasingly negative as we approach the end of Q1. In the past 2 weeks, 22 companies offered guidance with 15 negative and 4 positive, a 3.7 N/P ratio.

Analysts remain reasonably upbeat, however. Q1 estimates are for earnings rising 6.2%, down from 7.5% on January 1. However, analysts are much more nervous on smaller companies:


For all of 2022, earnings are seen rising 7.9%, down a little from +8.4% on January 1. But 6 of the 11 sectors are being revised down, offset mainly by the sharp upward revisions for Energy and Materials.

“Citibank strategists point to a global gauge tracking analyst estimates on corporate profits that has turned negative for the first time since September 2020, calling it a potential “game-changer.”” (Bloomberg)

So many game changers, all at once! Who’s not confused?
Foggy outlook, still high valuations, poor technicals. Caution and patience are virtues.
ANOTHER GAME CHANGER
Two underdog but game changing vaccines: NVX-CoV2373 (Novavax) and CORBEVAX Two new vaccines have been added to our global repertoire: NVX-CoV2373 and CORBEVAX. These will be nothing short of game changers for the pandemic.
FYI:
- Web3—the latest Silicon Valley buzzword WEB3 IS the latest Silicon Valley buzzword, referring to a third iteration of the internet built on blockchain technology. Backers say it will reinvent cyberspace but scepticism is growing. Host Kenneth Cukier investigates the hype and the potential. Runtime: 40 min
Listen on: Apple Podcasts | Spotify | Google | Stitcher | TuneIn
- The cold hard truth about EVs in winter
In Norway — where half of all new cars are plug-ins — tests showed that EVs lose about 20% of their driving range and take longer to charge in cold temperatures, according to the Norwegian Automobile Federation.
AAA found the loss in driving range could be as high as 41% with the heater on full blast.

Data: Recurrent; Chart: Baidi Wang/Axios