U.S. New Home Sales Improved Again in August
The new home market continued to recover during August. Sales of new single-family homes rose 1.5% (-24.3% y/y) to 740,000 (SAAR) during August, following a 6.4% (-25.0% y/y) rise in sales in July to 729,000, revised sharply up from 708,000. Despite last month’s improvement, sales remain 25.5% below their January 2021 peak of 993,000. The Action Economics Forecast Survey expected 709,000 sales in August.
The August’s sales improvement was led by solid gains in the Northeast and South. Sales in the Northeast jumped 26.1% (-37.0% y/y) to 29,000, while sales in the South rose 6.0% (-23.0% y/y) to 445,000. Sales rose 1.4% (-16.3% y/y) in the West to 215,000 but fell 31.1% (-46.9% y/y) in the Midwest to 51,000, the lowest level since January 2014.
The median price of a new home was unchanged in August from July, at a record high of $390,900. July had been revised up from $390,500. The median price in August stood 20.1% above its August 2020 price level. The average sales price of a new home declined 1.2% (14.7% y/y) in August to $443,000 from a record $448,700 in July. These prices are not seasonally adjusted.
The supply of new homes for sale rose slightly to 6.1 months in August from 6.0 months in July and up from a low of 3.5 months from August through October of last year, and the most since April 2020. The median number of months a new home stayed on the market fell to 3.6 months in August from 4.4 months in July and from the nine-year high of 5.1 months in March.
Still on trend overall but really only in the South and West:

- KB Home: “Disruptions to our supply chain intensified as the quarter progressed and along with municipal delays, resulted in our build times extending by about 2 weeks sequentially. This pushed many deliveries into our fourth quarter and will similarly delay in some fourth quarter deliveries into our 2022 first quarter.”
- Lennar: “…we missed the low-end of our third quarter delivery guidance by 600 homes, delivering 15,199 homes… it’s a reflection of the current market conditions. The supply chain for both land and construction is significantly stressed, and that will continue into the fourth quarter and beyond.”
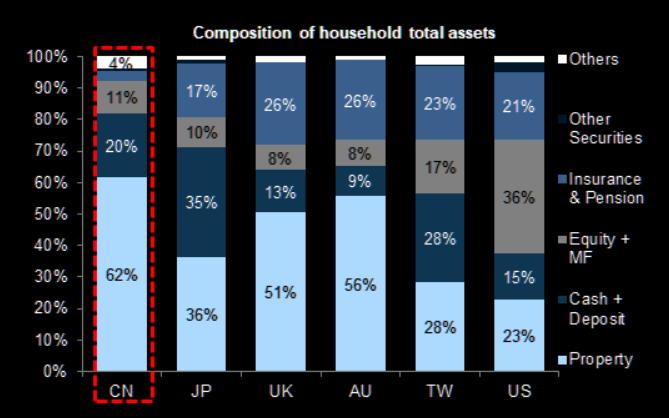
The importance of housing in China (The Market Ear)
Evergrande Pain Spreads to Wealthy Investors as More Interest Payments Missed
Tens of thousands of Chinese households who bought high-yield investments risk being sucked into the spectacular unraveling of China Evergrande Group after the embattled developer missed payments on funds sold through shadow banks, which have funneled billions into its construction projects.
Some of these lenders, known as trusts, have already dipped into their own pockets to repay wealthy investors on Evergrande’s behalf, according to people familiar with the matter. Others are negotiating payment extensions with Evergrande, said the people, asking not to be identified discussing private matters. It’s not clear how much of the funds are in arrears and there’s no evidence that trusts are passing payment delays on to customers who bought fixed-income products tied to Evergrande. (…)
Contagion into the $3 trillion trust industry will put at risk many more investors, while also threatening the biggest source of non-bank funding for the property sector as shadow banks retreat. (…)
Evergrande’s dependence on trusts and other asset management products began growing after banks were directed to cut back on their lending to the property sector. By the end of 2019, Evergrande had done business with most of the 68 trust companies in China, which accounted for 41% of its total financing, based on the last borrowing disclosure. (…)
Trusts are also reducing their exposure to other property firms, a sign that Evergrande’s woes threaten the entire real estate industry, which accounts for more than 15% of China’s economy. The trusts have cut outstanding loans to property firms by 201 billion yuan in the first half of this year, a drop of 17%, according to the trust association. (…)
When trusts began pulling back, the developer started squeezing money from more murky sources — selling its own high-yield wealth products to staff, homebuyers and others. The money wasn’t raised in Evergrande’s name to side-step regulations and keep borrowings off its books, leaving some analysts to speculate on whether there are hidden obligations that are yet to surface. (…)
BTW, Bloomberg reveals that last week, the Sunac group (2020 revenues of $33B), a HK-listed real estate firm with half the liabilities of Evergrande, has “run into big hurdles and difficulties in terms of cash flow and liquidity”.
None of these channels of financial risk will inevitably spiral out of control, as long as China’s regulators step in to break self-reinforcing feedback loops. The good news is that after a series of failures and near-failures including HNA Group and Baoshang Bank, regulators have plenty of experience in containing risks posed by troubled institutions. Still, the difficulty of managing the fallout from Evergrande is greater, given the number of institutions involved and the large role of nonbank lenders. One consequence is likely to be a wider spread of funding costs between banks and nonbanks.
The true systemic risk to the financial system would be large and sustained declines in housing prices and sales. Such an eventuality would be the most likely trigger for a major change in China’s tough real-estate policies, but is not imminent. In aggregate terms, the balance between housing supply and demand is not out of whack, in part because tight financial policies have prevented developers from overbuilding. Nonetheless, defaults are a deflationary impulse and will dampen the economic outlook. A tighter funding environment for developers will reduce land sales and new starts, further dampening construction activity and materials demand.
INFLATION WATCH
NY Fed’s Underlying Inflation Gauge (UIG)
- The UIG “full data set” measure for August is currently estimated at 3.8%, unchanged from the previous month.
- The “prices-only” measure for August is currently estimated at 4.1%, a 0.1 percentage point increase from the previous month.
- For August 2021, trend CPI inflation is estimated to be in the 3.8% to 4.1% range. The width of the range is wider than in July, with the upper bound higher than it was in July.
Logistics Operators Raise Pay, Enlist Robots to Meet Holiday Demand Competition for warehouse labor is fierce as e-commerce volumes surge and companies pull out all the stops on recruiting
Logistics providers are boosting pay, adding flexibility to shifts, blanketing social media with recruitment ads and even shipping in more robots to help workers field surging e-commerce volumes. They are also jockeying with titans like Amazon.com Inc., Walmart Inc. and United Parcel Service Inc. that are dangling inducements, from signing bonuses to assistance with college tuition, as they push to bring on hundreds of thousands of workers ahead of the holidays. (…)
The push for workers is driving sharp increases in pay. Wages for e-commerce workers have jumped from between $13 to $15 an hour in recent years to as much as $19 an hour in some markets, logistics executives said, led by the sector’s biggest operators.
Starting pay for Amazon warehouse workers is up to $22 an hour in some locations, the company said, while the average hourly wage for supply-chain workers at rival Walmart is now $20.37.
Even the largest operators are feeling the strain. The tight labor market added $450 million to FedEx Corp.’s costs in the most recent quarter, the delivery giant said last week, with those headwinds expected to persist through the end of the year. (…)
“Our recruiting costs have doubled, we’re advertising more…everything from help-wanted yard signs to drive-through job fairs. Radio campaigns, billboards, we’re pulling out all the stops.” (…)
Greenwich, Conn.-based GXO Logistics Inc. added 40% more robotics and automation systems in North America in 2021 and plans to open nine new automated U.S. sites to support e-commerce this year. GXO said it has increased pay by between $3 to $5 an hour on average in key markets and is offering other financial incentives, including sign-on bonuses. (…)
General Mills CEO: “(…) the challenges we have with labor and labor inflation are going to persist for quite some time. We have not really seen them abate significantly to this point. (…) inflation is going to continue through the balance of our fiscal year, which is the first half of calendar ’22, that much is clear and it’s going to be broad.”
Costco CFO: “Some suppliers are — that’s paying 2-6 times for containers and shipping. Price increases of pulp and paper goods, some items up 4% to 8%. Again, we’re trying to mitigate those where we can and we think we’ve done a decent job of mitigating some of it. Plastics, resin increases on things like dressed trash bags, Ziplock skews, pet products include — resin oriented pet products, plastic cups, plates, plastic wrap, many items up in the 5% to 11% range. Metals, again aluminum foil, mid-single-digit crossed increases as well as cans for sodas and other beverages. I mentioned commodities earlier, oil, coffee, nuts, they remain generally, according to our buyers at 5-year highs, and so on.”
Steelcase CEO: “We’ve also seen higher levels of commodity inflation and steel inflation has been extraordinary. I said last quarter, when we announced our second price increase of the year that some of these material costs were anticipated to decline, but if they didn’t, we’d need to consider another adjustment. Since then, the cost of steel and several other commodities have continued to increase and are expected to stay high for a longer time. Therefore, we announced this week an unprecedented third price increase, which will begin to take effect in November.”
JPMorgan Chase CEO: “I doubt [come] December, people will say it’s all transitory when it’s now been going on for quite a while…If inflation is so high that the Fed has to do more .., like jam on the brakes, pull out liquidity, then you’re going to see a huge reaction. And I’m not predicting that, but it’s possible they have to do that sometime next year. The Fed can’t always be proactive — I mean, sometimes they’re going to have to be reactive.”
BTW: The next leg higher in oil prices – from a cyclical to a structural bull market Brent oil prices have reached new highs since October 2018, and we forecast that this rally will continue, with our year-end Brent forecast of $90/bbl vs. $80/bbl previously. While we have long held a bullish oil view, the current global oil supply-demand deficit remains larger than we expected, with its drivers increasingly reflective of supply underinvestment in the face of resurging demand. (Goldman Sachs)
- And here’s more on Europe’s energy crisis and how it may spread globally this winter. There just isn’t enough natural gas to fuel the economic recovery. Today’s Big Take discusses how the green movement means nations are more dependent on gas to heat homes and power industries. (Bloombrg)

Paper Questions Federal Reserve’s Faith in Inflation Expectations New research out of the Federal Reserve calls into question a key plank of modern central banking, the idea that inflation expectations matter to monetary policy and can be managed.
Office Vacancies in Canada Reach Highest Level Since 1994 The national vacancy rate reached 15.7% in the third quarter, the highest since 1994, according to a report released Friday by commercial real estate brokerage CBRE Group.
China’s Growth Forecasts Take a Hit as Power Crunch Worsens
China International Capital Corp. estimated the electricity shortages will lower the country’s growth rate by 0.1 to 0.15 percentage point in the third and fourth quarters. Nomura Holdings Ltd. cut its full-year forecast for gross domestic product, while Morgan Stanley warned of lower fourth-quarter output.
The stringent measures to cut electricity use in economic powerhouses like Jiangsu, Zhejiang and Guangdong provinces will probably cause the purchasing managers index, scheduled for release later this week, to drop below 50, Nomura said in a report Monday.
Nomura’s Chief China Economist Lu Ting said there’s now a chance that its growth projection for 2021 — which was cut on Friday to 7.7% from 8.2% — could be lowered further. (…)
Economists from Morgan Stanley forecast the production cuts, if implemented at the current pace for the rest of this year, to cut the GDP growth by about 1 percentage point in the fourth quarter.
CICC also sees an impact on inflation, with producer prices likely to rise at least 9% in 2021 from a year earlier, weighing on the profitability of downstream firms. Monetary policy will likely stay neutral with an easing bias, CICC economists said. (…)
- iPhone Assembler Starts Energy-Saving Measures in China Curbs on industrial energy use have been imposed across several provinces, including economic powerhouses Jiangsu and Guangdong, as Chinese officials pursue President Xi Jinping’s carbon-neutral push and react to escalating coal and gas prices. The continued operations of Apple suppliers suggest Beijing may be excepting the advanced manufacturing sector from its power sanctions.
- Some Apple, Tesla suppliers suspend production in China amid power pinch
EARNINGS WATCH
Trailing EPS are now $182.93, up 11.2% from the pre-pandemic level and 4.3% from forward EPS in February 2020. This while the S&P 500 Index rose 30.9%. The main stats, then and now:

Earnings revisions got more timid as we approached the Q3 earnings season:


Fewer companies have pre-announced compared with Q2’21, not necessarily a good sign. Positives plus in-lines total 65, down from 73 three months ago, not necessarily a bad sign; that number averaged 50 in 2019 and 2018. The 0.7 N/P ratio is also good (2018-19 average: 2.14). There was no pre-announcement last week, a good sign.

FYI: FedEx reported its Q1’22 on Sept. 21. Could it actually be a global pre-announcement?
First quarter operating results were negatively affected by an estimated $450 million year over year increase in costs due to a constrained labor market which impacted labor availability, resulting in network inefficiencies, higher wage rates, and increased purchased transportation expenses. This was partially offset by higher package and freight yields, increased international export express shipments and a favorable net fuel impact. In addition, while commercial ground and U.S. domestic express package volume increased year over year, continued supply chain disruptions have slowed U.S. domestic parcel demand compared to the company’s earlier forecast.
Goldman Sachs’ take:
FDX FY1Q22 results were disappointing despite what we perceived were relatively low expectations from the market going into the quarter as the shares were down about 16% from mid-July (vs. S&P flat since July 15). Operating EPS of $4.37 per share was below our $4.65 and FactSet consensus of $4.88.
We knew going into the quarter that labor constraints, and related upward wage pressures and network operating inefficiencies tied to the labor problems would cause cost pressures (as it is across much of the transport sector). Management at the time indicated the FY1Q would bear the brunt of the profit impact. As it turns out – the impact was greater than we would have thought, with FDX indicating a $450mm cost impact – tied to wage increases and purchased transport ($200mm) and to network inefficiencies ($250mm). Other cost headwinds include healthcare ($135m), ground network investments ($85mm), and incremental air network costs ($60m).
But the large impact was of course around labor.
(…) in the near term it seems like the labor and network inefficiencies will last for longer than originally anticipated – a risk we noted previously for FDX and other transports as we move into peak. (…)
To reflect the labor uncertainty and in conjunction with management’s revised FY22 (May) guidance of $19.75-$21.00 per share (from $20.50-$21.50, or down 3% at the midpoint), we lower our FY22 EPS estimate to $20.00 per share. This lower forecast takes into account a FY2Q22 outlook that will likely contain comparable headwinds and possibly package constraints as the FY1Q22 – therefore we take most of the additional EPS shortfall from this quarter.
(…) it is difficult to determine the exact timing of labor recovery, so we do recognize that there could be some ongoing EPS related risk in near term.
Some facts:
- Express operating profits were 13% below expectations as margins dropped from 7.7% to 6.0% (consensus: 7.1%).
- Ground operating profit was 21% below expectations as hourly wages jumped 16% YoY. Margins were 8.7% vs consensus of 11.1%.
- EPS of $4.37 were 11% below consensus.
FDX CEO: “Our Portland, Oregon hub is running with approximately sixty five percent of the staffing needed to handle its normal volume. This staffing shortage has a pronounced impact on the operations, which results in our teams diverting twenty five percent of the volume, that would normally flow to this hub because it simply cannot be processed efficiently to meet our service standards. (…) So just to give you an illustrative example here, a year ago, our package handlers at Ground, we are paying an hourly rate that is sixteen percent more than previously, at our Express major sort locations the hourly rate is north of a twenty five percent increase. So that is the reality of the labor market right now.”
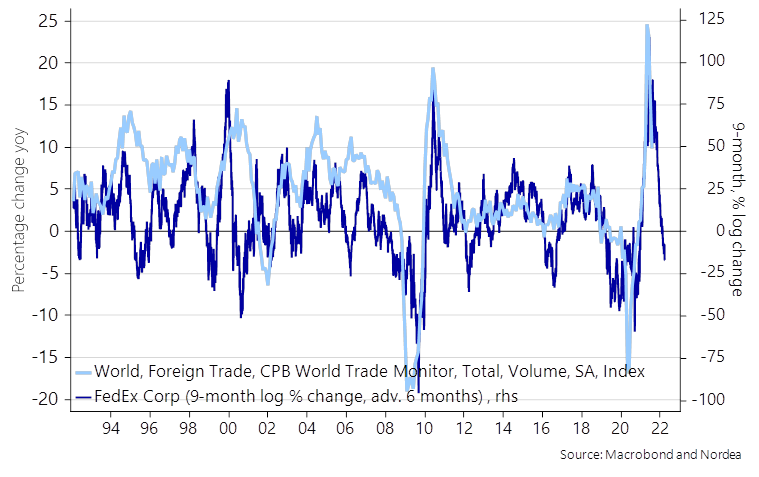
Nordea says that FedEx is on the front line of those companies feeling the heat of a slowing cycle
Fed-ex signals a CLEAR cyclical downturn
TECHNICALS WATCH
My favorite technical analysis firm did not see sufficient improvements in the basic technical trends last week to change its cautious stance. The S&P 500 did bounce back from its Monday Evergrande low of 4289 but as of Friday, only 47% of stocks are above their respective 50dma while the index is back above its (barely rising) 50dma. Also, and importantly, small caps need to show better relative strength:


Refinitiv/IBES data show small caps earnings outgrowing the S&P 500 EPS in 2022…


…nothing really new there:

But check the re-rating; investors either don’t believe or don’t care:


Amazing! Disbelief or flight to liquidity?

Critical junctions approaching:

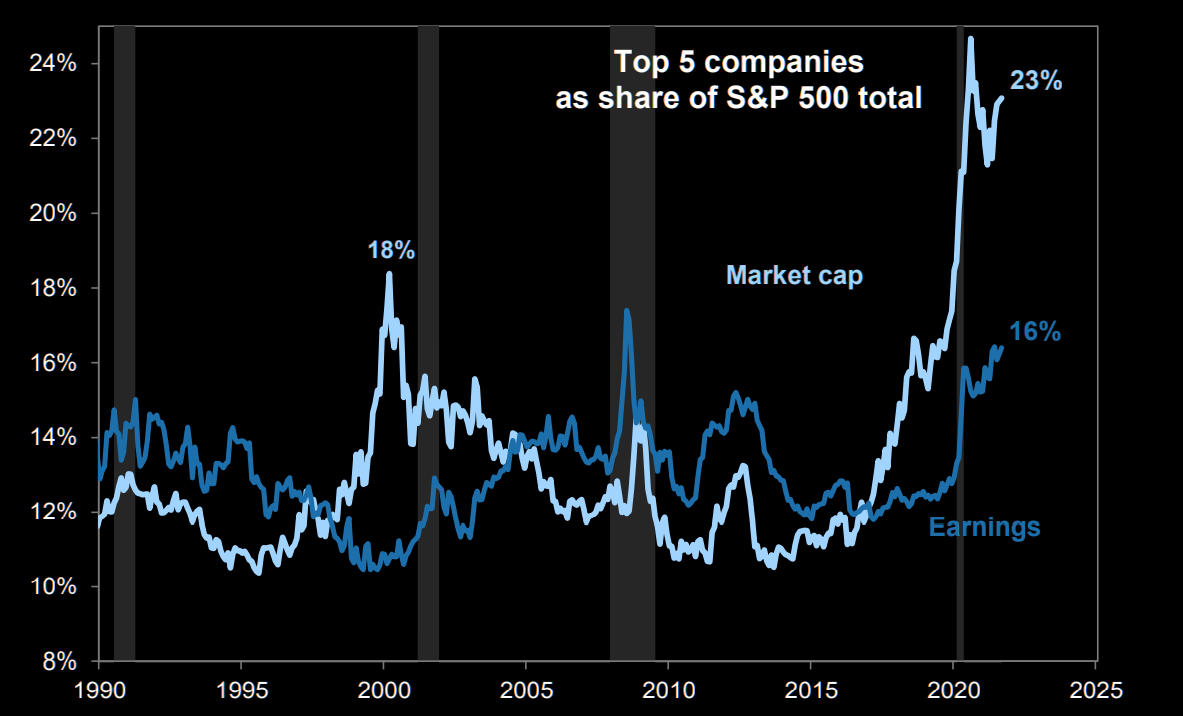
Certainly one of the reasons:
Top 5 stocks as a share of S&P 500
(Goldman Sachs via The Market Ear)
Individuals Embrace Options Trading, Turbocharging Markets Options trading by short-term investors is surging, and their zeal is translating to bigger swings in individual stocks and fueling momentum behind many rallies.
(…) Nine of 10 of the most-active call-options trading days in history have taken place in 2021, Cboe Global Markets data show. Almost 39 million option contracts have changed hands on an average day this year, up 31% from 2020 and the highest level since the market’s inception in 1973, according to figures from the Options Clearing Corp. (…)
“Everyone is using leverage. And they’re using it because you can make a ton more money,” he said. (…)
By one measure, options activity is on track to surpass activity in the stock market for the first time ever. (…)
Some analysts say the zeal for options trading is translating to bigger swings in individual stocks, and fueling the momentum behind many rallies. When individual investors buy call options, the Wall Street firms that sell options often hedge their positions by buying the shares, further contributing to rising markets. (…)
The activity can also exacerbate downturns, traders say, though for much of the past year the stock market has recorded a steady climb higher. (…)
China Vows Further Curbs on ‘Disorderly Expansion’ by Tech Firms Vice Minister Sheng Ronghua told the World Internet Conference on Monday that curbing monopolistic behavior and the “disorderly expansion of capital” were top priorities for the Cyberspace Administration of China. Sheng also listed self-driving vehicles and platform economies as areas that required stronger regulation.
Huawei Finance Chief Reaches Deal With Justice Department Under the agreement, Meng Wanzhou admitted to some wrongdoing, securing an exit from Canada and her U.S. extradition fight; meanwhile, two Canadians detained in China were released.
(…) In a four-page statement of facts, Ms. Meng acknowledged that she made untrue statements to a bank in 2013 about the relationship between Huawei and a company it controlled that operated in Iran, leading the bank to provide services that violated U.S. sanctions on Iran. (…)
Ms. Meng, who is 49 years old, is the daughter of Ren Zhengfei, the founder of Huawei, the world’s largest maker of telecommunications equipment and a leader in 5G technology.
(…) Ms. Meng’s plane took off from the airport in Vancouver, British Columbia, bound for China early Friday evening. Around the same time Ms. Meng’s plane took off, China released two Canadians, Michael Kovrig and Michael Spavor, who had boarded a plane bound for Canada accompanied by Canada’s chief envoy in Beijing, Canadian Prime Minister Justin Trudeau said. (…)
“Over the last three years, my life has been turned upside down,” she said outside the Vancouver courthouse before departing for the airport. (…) She also thanked her supporters and praised the leadership of the Chinese Communist Party. (…)
She had been spending most of her time in her large Vancouver home, where she was supervised by court-appointed security guards, the people said. Most days she consulted with her legal team about her case, practiced English with an online tutor, painted and exercised, they said. Ms. Meng hadn’t seen her husband and children since they visited her in Vancouver in the spring. (…)
Mr. Spavor, a businessman, and Mr. Kovrig, a Canadian diplomat on leave, had been confined to separate Chinese facilities and prisons since December 2018.
The Canadian leader had frequently linked the detention of Messrs. Kovrig and Spavor to his country’s role in the arrest of Ms. Meng on behalf of U.S. authorities. China had denied there was any link between the cases. (…)
Some U.S. national-security experts who have urged the U.S. to take a tough line on China said they viewed the deal as a surrender that the Chinese government would use to its advantage. “I suspect that Beijing will conclude that hostage-taking works and that Washington will capitulate when pressured,” said Matt Turpin, a former China director on the National Security Council in the Trump administration.
Her life was “turned upside down” while living in a $13 million mansion and free to wander in Vancouver. Meanwhile,
In China, Kovrig and Spavor were initially taken to secret jails, placed in solitary confinement, and interrogated for hours a day under lights that were never turned off. Nearly 600 days into his confinement, Kovrig could hold a plank position for 20 minutes and walked 7,000 steps a day in a small, windowless concrete cell to maintain his physical health and mental sanity. (Bloomberg)
China Has New Way to Fight IP Theft Claims Chinese technology giants have seized on a new legal tactic to fight claims of intellectual property theft, raising concerns in the U.S. that Beijing’s promises to strictly enforce patent and copyright laws will be undermined by Chinese courts.
In four major cases since 2020, Chinese courts granted so-called anti-suit injunctions blocking foreign companies from taking legal action anywhere in the world to protect their trade secrets.
Three of the rulings were in favor of Chinese telecom companies—Huawei Technologies Co., Xiaomi Inc. and BBK Electronics. The fourth supported South Korea’s Samsung Electronics Corp. in a dispute with Swedish telecom giant Ericsson AB.
In the Xiaomi case, the Beijing-based company was granted an anti-suit injunction against InterDigital Inc., a Delaware firm that holds patents on wireless and digital technology used in smartphones.
Xiaomi, the world’s biggest smartphone maker, has sold millions of handsets using InterDigital patents since 2013, under industry practice that allows companies to do so while licensing fees are being negotiated.
When talks broke down after seven years, InterDigital decided last year to sue Xiaomi for patent infringement—but found itself beaten to the punch.
At Xiaomi’s request, a Chinese court in Wuhan issued an injunction barring InterDigital from pursuing its case against Xiaomi—in China or anywhere else. If InterDigital persisted, the Chinese court said, it would face fines equivalent to roughly $1 million a week.
To trade lawyers and others who have tangled with Chinese companies over intellectual property, the InterDigital case is the latest sign of how China disregards the patents, copyrights and trade secrets of foreign companies. They say the situation hasn’t improved in key respects despite Beijing’s promises, including pledges made in the 2020 U.S.-China trade deal. (…)
Note: Quotes from corporate executives are courtesy of The Transcript.


 (
(