The enemy of knowledge is not ignorance, it’s the illusion of knowledge (Stephen Hawking)

It ain’t what you don’t know that gets you into trouble. It’s what you know for sure that just ain’t so (Mark Twain)

Invest with smart knowledge and objective odds

THE DAILY EDGE: 30 MARCH 2020

Pointing up Posted Sunday March 29: BEAR ESSENTIALS
Virus Update

image

Slowing a tiny bit but probably because of late and slow testing:

Number of specimens tested for SARS CoV-2 by CDC labs (N=4,750) and U.S. public health laboratories* (N=125,653)

Number of specimens tested for SARS CoV-2 by CDC labs and U.S. public health laboratories

§ Data during this period are incomplete because of the lag in time between when specimens are accessioned, testing is performed, and results are reported. Range extended from 4 days to 7 days on March 26.

Image

A graphic with no description

The chart above is one of many FT charts and data freely available here.

  • Cases world-wide topped 732,000, while the death toll surpassed 34,600.
  • In most western countries case numbers have been increasing by about 33 per cent a day, a sign that other countries may soon be facing the same challenge as Italy.
  • U.S. Deaths From Virus Could Be as Many as 200,000, Fauci Says
  • Dr. Deborah L. Birx, the lead coordinator of the White House’s coronavirus task force, said that even with precautions and restrictions the government’s model estimated “between 80,000 and 160,000, maybe even potentially 200,000 people succumbing” to Covid-19, the disease caused by the coronavirus. She added that without any precautionary measures, the same models projected that 1.6 million to 2.2 million Americans could die from complications of the virus.
  • The White House is extending social-distancing guidelines for another 30 days through the end of April. “Nothing would be worse than declaring victory before the victory is won,” Trump said Sunday.
  • Even Mr. Trump, who for weeks sought to downplay the seriousness of the crisis, struck a decidedly more somber note over the weekend. He also revealed that a personal friend was sick. “He’s a little older and he’s heavy,” Mr. Trump said. “But he’s a tough person, and we went to the hospital and a day later he’s in a coma.” “The speed and the viciousness, especially if it gets the right person, it is horrible,” Mr. Trump added.
  • Trump declares D.C. a ‘major disaster’ area (Winking smile Some say it’s been for a while…)
  • Officials in South Korea, widely praised for its handling of the outbreak, warned that they were seeing a sustained increase in infections in and around Seoul. The country has seen a steady rate of new cases for almost two weeks, with roughly 100 new cases each day since March 11. The outbreaks in the Seoul region have been linked to a call center and a church that held services in violation of the government’s social distancing policy.
  • Italy, with nearly 11,000 deaths, saw some hopeful signs as the mortality rate dropped for a third day in a row — from 969 to 889 to 756 — and new patients requiring critical care dropped to 50, from 124.
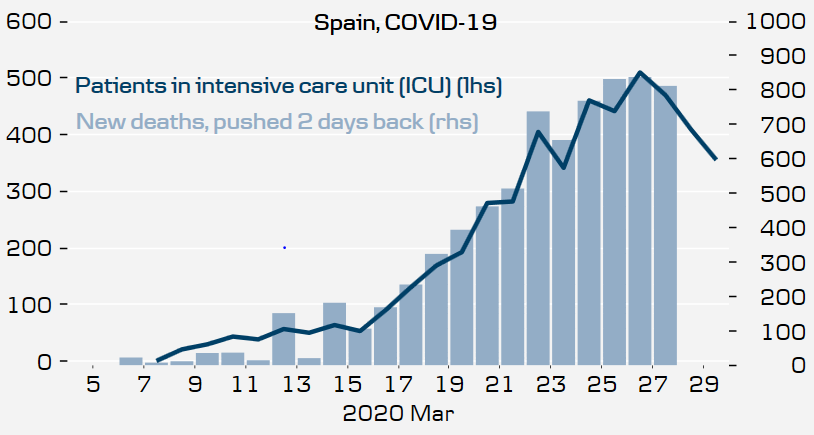
  • Spain also announced 812 new deaths, bringing its national total to 7,340 — more than twice the official death toll reported by China, but still less than Italy’s.
  • The total number of confirmed cases in Spain rose to 85,195 by Monday, whereas China had reported 82,356 by Sunday, according to the World Health Organization. New cases in China remain rare, despite concerns over imported infections and potential underreporting of asymptomatic carriers of the virus.
  • Image
  • Doctors Say It’s Only a Matter of Time Before Virus Sweeps India
  • Africa Is Two to Three Weeks Away From Height of Virus Storm
  • Abbott Laboratories shares rose 18% in U.S. pre-market trading after the company introduced a coronavirus test that can tell if someone is infected in as little as five minutes, and is so small and portable it can be used in almost any health-care setting.
  • The two tests that will help to predict spread of Covid-19
  • A consortium of manufacturing giants, including plane maker Airbus, defense giant BAE Systems and engine-maker Rolls-Royce Holdings, have agreed to build more than 10,000 ventilators amid a jump in demand from the spread of the new coronavirus outbreak. The VentilatorChallengeUK group, which also includes the U.K. operations of Ford Motor, packaged-goods giant Unilever, along with various Formula 1 teams, have agreed to combine forces to accelerate the production of a new ventilator design that can be assembled from parts in current production. Work is set to start this week.
  • Smiths Group said it is contracting with the U.K. government to produce ventilators needed to treat critically ill coronavirus patients. The company plans to increase production to thousands of units a month from hundreds.
  • Dyson announced last week it had developed a new ventilator and received an order from Britain for 10,000 units — but the government later said its purchase would depend on regulators approving the device.
  • Canadian companies retool to meet demands on front lines of pandemic
  • Authorities in Moscow ordered an indefinite citywide quarantine, compelling 12.7 million residents to remain in their homes.
  • In Belarus, the authoritarian President Aleksandr G. Lukashenko called the coronavirus “nothing else but a psychosis” and has joked that a shot or two of vodka a day will poison the virus, advice rejected by medical experts.
  • President Jair Bolsonaro of Brazil has also argued that concerns over the pandemic are overblown. He repeated his argument that the harm to the economy from efforts to curb its spread can be worse than the pandemic itself.
Outbreak at Washington state choir practice suggests virus had airborne spread

On March 10, 60 members of the Skagit Valley Chorale attended practice. Since then, two have died, three have been hospitalized, and 45 have either tested positive or shown symptoms of covid-19, the paper reported.

The outbreak was notable given that the singers, wary of the virus’s growing death toll in Seattle, were careful to use hand sanitizer, avoid physical contact and keep a distance from one another. None appeared to be ill at the time.

County health officials have concluded that the virus must have been transmitted through the air by singers who were asymptomatic, the Times reported. If so, it would bolster the findings of researchers who say that the virus can be transmitted through microscopic aerosols, in addition to the much larger respiratory droplets that are emitted when someone coughs or sneezes.

Chinese cinemas told to close just a week after reopening China Film Administration issues notice on Thursday as government seeks to prevent a new wave of Coivd-19 cases, after locally transmitted infection is reported in Zhejiang

(…) The infection was one of 55 reported across China that day, but the only one that was not imported, the report said. (…) While there have been sporadic cases of individual businesses being ordered to close soon after being allowed to reopen, a nationwide ban on an entire industry is unusual.

Earlier this month, a hotpot restaurant chain in Liaoning province was ordered to close all of its outlets just three days after being told it could reopen, when three new Covid-19 cases were found in the city of Dandong, according to Canyin88.com, which monitors the industry.

(…) In China’s official count of confirmed coronavirus cases, people who test positive but show no symptoms are excluded; they are added to the tally only if they start to feel sick. (…)

The Caixin commentary said revealing the scale and spread of asymptomatic cases was important for research and informing the public of continuing possible risks.

China has reported several days with no new cases outside those brought in from overseas. The case reported in Henan on Sunday suggests that the virus continues to spread among people who might not be included in the public tally. (…)

Caixin reported last week that thousands of urns were sent to funeral homes in Wuhan, the center of the outbreak, in recent days, raising questions about whether the death toll in the city could be higher than the official figure of 2,547.

Experts disagree on threat posed by asymptomatic coronavirus carriers

(…) Zhong Nanshan, one of China’s leading respiratory disease specialists, said in an interview with state broadcaster CGTN on Sunday that although asymptomatic virus carriers were “very infective because there is very high viral load in their upper respiratory tracts”, he did not think there were many of them. (…)

But not everyone is as optimistic as Zhong.

Speaking at a symposium in Shanghai on Friday, Zhang Wenhong, the head of the city’s Covid-19 clinical expert team, said that asymptomatic carriers “now pose the biggest risk” among imported cases of infection, of which Shanghai had reported more than 100.

“Asymptomatic coronavirus carriers usually have strong immunity and show no symptoms for more than two weeks despite being infected,” he said. (…)

Wang Xinhua, president of Guangzhou Medical University, said it was still too early to say what threat asymptomatic carriers posed.

“Confirmed cases with no symptoms do exist, but we don’t know the specific number and the workings and characteristics of this [type of] carriage are not clear,” he said.

“I think [in such people] the viral load is low and the virulence is weakened. If not, they would show symptoms.” (…)

PANDENOMICS
The Financial Times China Economic Activity Index

Using Wind’s financial database, we have compiled a weighted index of six daily, industry-based data series. The measures of the domestic economy include real estate floor space sales, traffic congestion within cities, and coal consumption in major power plants. Trade activity is represented by container freight.  Two other indices, which have been given a lesser weighting, provide social and environmental context: box office numbers from Chinese cinemas – a good proxy on consumer activity – and air pollution in the ten largest cities.
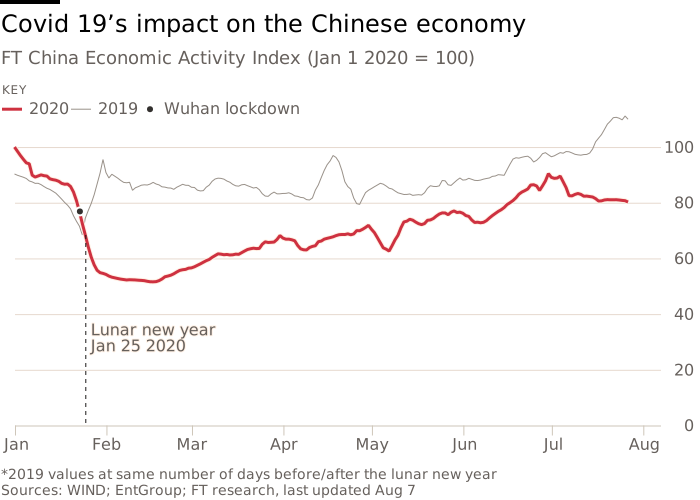
Chart showing Covid-19's impct on the Chinese economy. FT China Economic Activity index.

After Three Stimulus Packages, Congress Already Prepping No. 4 Legislators are already roughing out the contours of yet another emergency-spending package to try to keep the crisis from turning into a 21st-century Great Depression.

Legislators from both parties, administration officials, economists, think tanks and lobbyists are already roughing out the contours of yet another emergency-spending package—perhaps larger than the last—to try to keep the coronavirus crisis from turning into a 21st-century Great Depression. Many expect the debate to begin in earnest by late April.

“There’s talk of a multi-trillion-dollar program, given the size of the shutdown,” says Stephen Moore, a fellow at the conservative Heritage Foundation. “There’s a general recognition that we need something big to get some juice into the economy,” adds Mr. Moore, an outside economic consultant to the Trump administration and some congressional Republicans.

The ideas being floated include extending last week’s package to make the benefits last longer, as well as plugging in likely holes in the hastily assembled bill. One item in particular cited by both President Trump and Democratic leaders is a desire for more money to shore up state government budgets collapsing under lost tax revenues and new spending demands.

A common theme from economists and legislators across the political spectrum: The latest measure was mainly about keeping U.S. commerce on life support while it endures a medically induced coma. That is, paying businesses and workers revenues and wages lost during the shutdown. A next phase would likely pivot from stabilization to stimulus—providing the patient a robust regimen of physical therapy in an attempt to get the economy back to full health. (…)

“My guess is that this bill won’t wear well over time, and Congress isn’t going to be inclined do another big package,” says Andy Laperriere, a Washington policy analyst with Cornerstone Macro, an investor advisory firm. “There will be fraud, companies getting money going into bankruptcy, things that people on the left and right won’t like.” (…)

“The left is going to want to do infrastructure, welfare payments and food stamps,” says Mr. Moore. “Our side will want to do tax cuts and deregulation.” (…)

Fed Considering Additional Support for State, Local Government Finance Central bank hires former Treasury official to assist with potential municipal-lending program

(…) Democratic lawmakers have made support for city and state borrowing a priority in recent legislative talks, and the latest bill directs the Treasury secretary to seek a Fed lending program for municipal finance. (…)

Under its governing law, the Fed can’t directly buy corporate debt, and it is limited to purchasing municipal debt of six months or less. But it can work around these restrictions by creating lending facilities that lend or purchase debt, subject to approval of the Treasury secretary. (…)

The Fed and Treasury brainstormed ways to support hard-hit state and local treasuries after the 2008 financial crisis, but opted against doing so. (…)

“There is a real reluctance to blur the line between the federal government and the state and locals. You start going down that road, it’s hard to know where to stop.”

Bloomberg’s John Authers:

(…) when it comes to monetary bazookas, the Fed hasn’t gone anything like as far as the European Central Bank or the Bank of Japan in expanding its balance sheet. Now that it is effectively backstopped by the Treasury, it could go on quite a buying spree — which would, again, tend to weaken the dollar.

relates to Oil's Done. Watch the Dollar as the Key Virus Gauge
Coronavirus Heightens Risk of Emerging-Market Defaults About 18 countries’ dollar debt is trading at distressed levels, up from four nations at the start of the year

An unprecedented withdrawal of capital from emerging markets is threatening to create a wave of debt defaults as governments struggle with the double whammy of falling oil prices and the rapidly spreading coronavirus outbreak. (…)

Governments, already saddled with the high medical costs and the cost of shoring up their economies, could face a public backlash if they try to repay international bondholders when their local populations are suffering, Mr. Glossop said. (…)

The spread of coronavirus across Africa, South Asia and Latin America is likely to weigh heavily on the regions’ overstretched public-health systems. Measures to contain the outbreak, such as curtailing travel and business activity, will pose a crippling burden on the weakest economies, analysts said. For oil producers, who have seen the price of crude tumble by more than half to below $30 a barrel, that is a double whammy. (…)

The ICE Dollar Index, which tracks the dollar against a basket of currencies, this month climbed to its highest since January 2017. (…)

Oil Plummets to 17-Year Low as Broken Market Drowns in Crude

(…) The kingdom said on Friday that it hadn’t had any contact with Moscow about output cuts or enlarging the OPEC+ alliance of producers. Russia also doubled down, with Deputy Energy Minister Pavel Sorokin saying oil at $25 a barrel is unpleasant, but not a catastrophe for the nation’s producers. (…)

OPEC nations aren’t giving support to a request from the group’s president for emergency consultations over tanking prices, according to a delegate. Algeria, which holds the cartel’s rotating presidency, has urged the secretariat to convene a panel but the call has failed to gather the majority backing necessary to go ahead. Riyadh is among those opposing the idea. (…)

Global oil demand is in freefall and consumption may decline by as much as 20 million barrels a day, according to the International Energy Administration. That is forcing producers worldwide to slash output, while independent trader Trafigura Group expects as much as 1 billion barrels to be sent into storage tanks in the coming months. (…) For those without access to pipelines and ports, local storage will run out in days, traders and consultants say. (…)

In the U.S., one of the largest pipeline companies, Plains All American Pipeline LP, has asked oil producers to voluntarily cut output to avoid overwhelming the network that connects well heads to refineries through thousands of miles of pipelines. (…)

Many crudes, especially sticky, sulfurous grades that refiners find hard to process, trade at hefty discounts to international benchmarks. Western Canadian Select, a tarry blend squeezed from Alberta’s oil sands, reached a record low of $4.51 a barrel on Friday.

In the U.S., Oklahoma Sour is changing hands at $5.75, Nebraska Intermediate at $8, while Wyoming Sweet prices at $3 a barrel. (…)

The next stage of the oil market’s meltdown will be widespread production shutdowns as drillers decide the only option is to leave it in the ground until better days return. There are signs this is starting to happen.

Brazil’s state oil company Petrobras has announced it will reduce output by 100,000 barrels a day this year because of the lack of demand. In Canada, some producers have shut down output, and Glencore Plc., the world’s largest commodity trading house, has shut down its production in Chad.

Many producers are reluctant to shut wells because even though they’re losing money at today’s prices, some cashflow is often better than none at all. But as more refineries idle, the pipeline system grinds to a halt and storage tanks fill to the brim, they will soon have no choice.

Texas producers are beginning to receive requests from pipelines to reduce output as storage begins to run low, according to a tweet from Texas Railroad Commissioner Ryan Sitton. (…)

Here’s the tweet:

Got word yesterday that some Texas producers are starting to get letters from shippers (pipelines) asking for oil production cuts because they are out of storage. We need to get in front of this.

JPMorgan Says the Market Rout Is Probably Past Its Worst Now

(…) Coronavirus infection rates remain a “wild card,” as they remain high even if they’re “slowing” in the U.S. and Europe.

“Risky markets should remain volatile as long as infection rates create uncertainty about the depth and duration of the Covid recession, but enough has changed fundamentally and technically to justify adding risk selectively,” Normand wrote. “Most risky markets have probably made their lows for this recession, except perhaps oil and some EM currencies beset by debt-sustainability issues.” (…)

Goldman Sachs Group Inc.’s David Kostin reiterated in a note Friday that he expects the market to turn lower in coming weeks. He cited a checklist for a sustained rally similar to Normand’s — of slowing viral spread, evidence that fiscal and monetary policy stimulus is working, and a bottoming in investor positioning and flows.

Gavekal Research Ltd.’s Anatole Kaletsky said in a note Monday that it’s too early to buy equities, citing reasons including “surprisingly complacent” investor sentiment and historical data showing bear markets almost never end on a single massive sell-off without retesting the bottom. (…)

Sensitivity of S&P 500 EPS Forecast to Changes in GDP and the U.S. Dollar

SENTIMENT WATCH

Normally, I would act on these 2 charts… but this is not a normal bear…That said, some companies are clearly being valued well below their true long-term value.

S&P 500 and Insider Buy vs. Sell Ratio

BofA Bull & Bear Indicator

TO BE SHARED:
https://mvotd.com/pop-culture-covid-19-psa_c292fb0a2.html
TO BE WATCHED WITH FAMILY

(…) the best movie my family has streamed on Netflix has been Searching for Sugar Man, which won the Oscar for best documentary in 2012. It tells the incredible story of an American singer-songwriter who released two albums in the early 1970s, got dumped by his record label, and returned to his job as a construction worker in Detroit, all the time ignorant of the fact that he had developed a huge following in South Africa, where people thought he was “bigger than Elvis Presley.”

It’s wonderful and moving, it entertains all the family (a rare feat), and it introduces some extraordinary music. Try listening to “I wonder”, and then wonder how this man did not get to be a household name. (John Authers)

Also worth watching: The Stranger on Netflix.

BEAR ESSENTIALS

Trying to forecast the low of equity markets in the current environment is like being a blindfolded tightrope walker seeking the wire with his front foot. A miss could be rather unfortunate. This post takes you through my “educated guess work” seeking a solid enough bottom. Spoiler: keep a lifeline handy.

The likely scenario looking forward is for a world recession until a vaccine or cure are found and made widely available. In the best case, this would happen within 6 months (a cure based on an existing medicine) and in the worst case sometimes in 2021 with a vaccine and/or a novel cure.

In the meantime, the extraordinary global “whatever it takes” monetary and fiscal stimulus will help keep economies running at minimal speed, hopefully preventing a depression.

Eventually, the virus will be conquered and the world will restart. The most likely scenario at that point should be one of a long recovery period to close the large accumulated output gaps without much risk of excessive inflation developing given the accumulated debt and labor slack, and thus very accommodating monetary policies for a long period. Barring another black swan, we could be living another extended economic and financial cycle.

Before we get there, however, fundamentals and sentiment will seriously deteriorate along with labor markets, corporate profits, investments, and widespread credit defaults.

The challenge for equity investors is to find a re-entry point sufficiently comfortable from a valuation and confidence standpoint to be invested when equities start rising again, because they will.

But, much like at peaks, troughs in profits, sentiment and valuations rarely coincide. Can the Rule of 20 help us build our equity positions in a timely and sensible way? It did in 2009. It also warned us early and repeatedly enough near the recent peak. Not that it helps forecast and time recessions, recoveries and any kind of swans but it clearly helps to objectively measure and appreciate risk vs reward, allowing investors to tune their equity exposure based on an historically dependable valuation tool.

The Rule of 20 simply says that the Rule of 20 P/E invariably cycles between 16 and 24 with Fair Value at 20. Below 20, equity markets are increasingly attractively valued. Vice versa above 20. At the 20 Fair Value, the valuation upside from 20 to 24 (+20%) equals the valuation downside from 20 to 16 (-20%). Natural fear and greed phenomena occasionally result in some temporary slippage outside of the 16-24 valuation band.

image

People relying on the conventional P/E run much more risk of whipsaws outside the historical 15-20 band.

image

Incorporating inflation in the valuation (really a proxy for interest rates), the Rule of 20 P/E displays a much more consistent valuation range. Regardless of economic or financial environments, the R20 P/E invariably cycles between 16 and 24.

The charts below plot the Rule of 20 P/E (P/E plus inflation), the conventional P/E and trailing EPS around various bear markets (within the black rectangles) during the past 60 years.

THE 1961-1962 PAPA BEAR (-23%)

A recession from Q2’60 to Q1’61. Small decline (-3.5%) in profits until December 1960, then a 7.3% slide to June 1961. But the bear market only began in December 1961, crashing 23% through June 1962 while profits were strongly recovering. This was a valuation bear market after the Fed tightened during the second half of 1961 when inflation was accelerating. Equities bottomed when valuations neared the low of the R20 P/E range (17.4) with rising profits and receding inflation.

image

THE 1966 BABY BEAR (-18%)

“Fairly valued” equities declined even though profits rose strongly. The Fed tightened starting in December 1965 through October 1966, when the R20 P/E reached 17.0 in September 1966. image

THE 1972-1974 MAMA BEAR (-46%)

A nasty Big Mama bear that began in December 1972 at excessive valuations with the Fed busy reigning in a booming economy. After a 10% correction through August 1973, valuations reached attractive levels thanks to still rising profits (they peaked right at the market trough in September 1974). But equities tanked 42% after OPEC declared an oil embargo in October 1973 that eventually quadrupled oil prices, upending the world and sparking an inflationary spiral and an immediate recession.

The Fed made things worse, tightening again between March and June 1974 to fight the sharply rising inflation. Fed funds rates peaked in early July at 13.3% before dropping to 5% in early 1975 when the recession ended.

Equity markets troughed in September 1974, four months before the recession ended, at a remarkably low 7.2 conventional P/E but a consistent R20 P/E of 17.4 (inflation was 10.2%). Equities rose strongly even against sharply declining profits (-15% through September 1975) during a recession that ended in February 1975. Inflation peaked during Q1’75 and dropped almost 50% during the next 12 months.image

THE 1980-1982 PAPA BEAR (-23%)

A Papa bear during 2 back-to-back recessions that ended in October 1982. There were also 2 back-to-back Fed tightenings, one in Q1’80 and another one in Q2’81. Profits were flattish until December 1981, then declined 16% but equities bottomed in July 1982, 5 months before the profits low when the R20 P/E was 15.1 (conventional P/E: 7.5).  Between July 1982 and August 1983, inflation dropped from 7.7% to 3.0%.

image

THE 1990 BABY BEAR (-14%)

The Fed tightened seriously between March 1988 until May 1989. A mild recession began in June 1989 but a real estate/financial crisis spooked investors for most of 1990. Equities troughed in October 1990 at a R20 P/E of 18.4, even though profits tumbled another 17% during the following 13 months.

image

THE 2000-2002 MAMA BEAR (-46%)

A 2-year Big Mama bear starting 7 months before the recession that cut profits by 32% in 15 months. The Fed tightened throughout 2000. The recession began in March 2001 and ended in November 2001 but the still wildly overvalued stocks lost another 28% during the following 10 months. Equities bottomed in September 2002 after profits started to recover but at valuation levels that were historically high for a market low. In fact, equity valuations remained very high until 2005 as profits rose steadily while inflation remained very subdued.

image

THE 2007-2009 MAMA BEAR (-56%)

This other Big Mama Bear started in July 2007 and marked the end of a significant 3-year Fed tightening policy. Mama bear stayed put for 20 months until March 2009, accompanied by an 18-month recession/financial crisis that ended in May 2009 after decimating corporate operating profits, from $91 in mid-2007 to …varying levels depending on who you listen to but ranging from $40 to $61, the latter number being “normalized”, i.e. an estimate of what earnings would have been excluding some extraordinary write-downs and write-offs emanating from the extraordinary financial crisis. GAAP profits were almost completely eradicated in 2008 and 2009. Many investors got too focused on GAAP profits and totally missed a large part of the bull market.

image

Some key observations from the above:

    • During the 5 recessionary down markets, the low point for equity markets was reached 3 to 5 months prior to the end of the recession in 4 of the 5 episodes. In 2001-02, equities turned up one year after the recession ended.
    • Equity market troughs happen irrespective of profit trends around the lows. In 4 of the 7 episodes reviewed, but in 4 of the last 5, equities troughed and rose while profits were still declining, sometimes brutally like in 1974-75 and 1990-91.
    • Fed tightening was present before/during every bear market.
    • Excluding the 2000-02 episode, market lows were reached at a Rule of 20 P/E between 14.5 and 18.4 (average of 16.7, median of 17.2) and a conventional P/E between 7.2 and 16.1 (average of 11.8, median of 12.8). The range of valuation lows was much narrower using the R20 P/E. (All P/Es on trailing EPS).

image

Now, let’s consider the Rule of 20 Fair Value which has a 98% correlation with the S&P 500 and which we know will be impacted by 2 conflicting trends in the coming 6-12 months (profits down, inflation down). The R20 Fair Value [trailing EPS x (20 – inflation)] simply calculates what the S&P 500 Index level would be if trading at its neutral, fair, valuation level of 20 where the valuation upside equals valuation downside. Fair Value declines along with lower profits but rises with declining inflation.

In effect, the Fair Value approach adds the profit dynamics to the valuation measures provided by the R20 P/E.

THE 1961-1962 PAPA BEAR (-23%)

The R20 P/E rose while Fair Value declined and then declined while Fair Value rose. The bear market ended at 17.4 R20 P/E and rising FV.

image

THE 1966 BABY BEAR (-18%)

Valuation declined along with FV. The bear market ended at a R20 P/E of 17.0. FV stabilized as slowing inflation offset a continued slight erosion in profits.

image

THE 1972-1974 MAMA BEAR (-46%)

The Mama bear ended at a R20 P/E of 17.4 even though FV only bottomed 5 months later. Note that the R20 P/E was near 17.0 for almost a year before the market low. The apparent cause is that inflation was strongly accelerating and the Fed tightening along the way. The bear ended shortly after the Fed started to ease.

image

THE 1980-1982 PAPA BEAR (-23%)

The bear ended at a very low R20 P/E of 15.1 in July 1982. Fair Value had been rising for a while (+37% in the previous 12 months) as rapidly declining inflation more than offset sluggish profits. The U.S. had suffered a double-dip under Volcker’s harsh medicine (Fed funds at 20% in mid-1981). Buying early at a R20 P/E of 17 in January 1982 would have cost you 10% for 6 months but made you 20% over 12 months, and the rest is history.

image

THE 1990 BABY BEAR (-14%)

The bear ended at a R20 P/E of 18.4 in October 1990, right in the middle of a 24%, 3-year drop in Fair Value. Equity valuations had been very cheap ever since after the October 1987 crash that culminated a 43% meteoric rise in the S&P 500 Index during the preceding 12 months. Strangely, investors quickly bid equities up well beyond FV until 1994.

image

THE 2000-2002 MAMA BEAR (-46%)

The Mama bear ended in September 2002, well past the November 2001 recession end, at a R20 P/E of 21.5 on rising FV buoyed by rising profits and sharply slowing inflation as well as a highly accommodative Fed. Equities rose in spite of very high valuations that endured until 2005.

image

THE 2007-2009 MAMA BEAR (-56%)

This brutal and extended Mama bear ended in March 2009 at a R20 P/E of 12.1 (the March 6 absolute low of 666), a level last seen in 1955. The low was reached after Fair Value had stabilized during the previous 3 months. Profits were still weakening (another –7%) but inflation was declining, from 2.5% in August 2008 to 1.8% at the March low on its way to 0.6% in October 2010.

image

In all, bear markets end irrespectively of the trend in Fair Value. At the market trough, Fair Value was rising 3 times, flat twice and declining, strongly, in 2 episodes.

A rising Fair Value is a welcomed backwind for a ship powered by sputtering engines amid an unsteady sea: it strengthens confidence and boosts the probabilities of shortly getting through the turmoil. Rising profits improve corporate fundamentals while easing inflation generally deflates interest rates (discount factor), keeps costs under control and fosters easy monetary policies.

Conversely, a declining Fair Value increases uncertainty and risks. Declining profits damage corporate fundamentals while rising inflation tends to stiffen monetary policies, often to the point of generating a recession and a bear market.

And yet, equity markets have shown that they can stop declining and turn around even when Fair Value is going sideways at low levels or even trending lower like in 1966, 1974 (Mama), 1990 and 2009 (Mama). In 4 of the last 7 bear markets, equity markets troughed before fundamental conditions improved. Briefly said, valuation (particularly the Rule of 20) matters more than fundamentals.

RECAP:

  • Equity markets trough irrespective of trends in profits and Fair Value.
  • Excluding the 1990 and 2000-02 bears, the other 5 market lows reviewed occurred at a Rule of 20 P/E between 14.5 and 17.4 (average of 16.3, median of 17.0). The 1990-91 and 2001 recessions were both very short and shallow with relatively less hawkish prior monetary policies.
  • These valuation lows were measured on trailing earnings and inflation. They have endured even after profits and/or Fair Value subsequently declined. In effect, rising valuations more than offset deteriorating fundamentals once investor confidence returned.
  • Every low was preceded by a dovish Fed (4 lows occurred right around the first move) but the last 2 lows occurred well after the first easing).
  • Fed tightening is generally unfriendly to equities even at low valuation levels. Avoid fighting the Fed!

To sum it all up, bear markets end when fear is sufficiently embedded in valuations and the Fed has become friendly. The Rule of 20 provides a dependable reading of equity valuations. During the last 7 bear markets, accumulating equities when the R20 P/E was below 17.5 AND the Fed was clearly in easing mode has proven rewarding.

THE 1957-58 ASIAN FLU PANDEMIC

In February 1957, a new influenza A (H2N2) virus emerged in the Guizhou Province of southwestern China, triggering a pandemic. By midsummer it had reached the United States, where it appeared to have initially infected relatively few people. Several months later, after the school year resumed, a second, particularly devastating wave of illness struck. 

Thanks to Dr. Maurice Hilleman, chief of respiratory diseases at the Walter Reed Army Institute of Research in Washington, D.C., who convinced companies to begin working on flu vaccines in the spring of 1957, the country was ready with a vaccine when the new flu strain hit in September. Still, the virus killed an estimated 70,000 Americans and one to four million people worldwide, but experts suggest it would have killed many more if not for the vaccine.

The Fed was in serious tightening mode from mid-1955 to the fall of 1957 as the U.S. was coming out of a slight deflationary period and prices accelerated through the spring of 1957 to +3.7%. The Fed last hiked rates by 50 bps in August to 3.5%, cut them 50 bps in mid-November, 25 bps in January and brought them down to 0.50% in February 1958, just before the recession ended in March.

fredgraph (70)

We don’t know what were the respective contributions from the Fed’s actions and the pandemic but U.S. GDP cratered at annual rates of -4.1% in Q4’57 and -10.4% in Q1’58, the worst quarterly drop since WWII (Q4’08 was –8.9%). It was also, at 8 months, one of the shortest U.S. recessions ever.

image

The Baby Bear (–18%) troughed at a R20 P/E of 14.5 with stable inflation and the Fed in easing mode. The R20 FV kept declining for another 9 months along with earnings.

THE 2020 POLE BEAR

This bear came down the fire pole in a hurry. In one month or so, it slid as much as what the average bear typically does in 12 months as LPL Research shows.

Bear Market Recoveries

World economies and equity markets are all coming down on a fire pole, all fighting the same scary blaze, in total economic and financial darkness. For investors, using trailing data makes no sense in this environment. But forward data is as bleak as it is unpredictable.

BEAR BOTTOM

In early 2009, the world financial system was totally upside down and huge GAAP and non-GAAP losses were recorded in Q4’08 and the first half of 2009. Trying to figure out S&P 500 earnings bottom up in this environment was an impossible, and rather futile task.

I then elected to attempt to “normalize” corporate profits using top-down data. The idea being that corporate America has an embedded minimum level of profitability that should normally provide a fundamental floor to equity  markets. On March 2, 2009, I posted S&P 500 Valuation Analysis: Near Bottom followed the next day by the complete analysis S&P 500 P/E Ratio at Troughs: A Detailed Analysis of the Past 80 Years (sorry, charts have disappeared Crying face).

Contrary to 2009, we do not want to imagine the absolute worst case here… but let’s try a very bad case.

If we assume a 6-month recession and that S&P 500 revenues tumble 8% (-16% in 2008-09 during an 18-m recession, –6.8% in 2002- 6-m recession), and that net margins decline from 11% to 7.5%, a 32% correction (–55% in 2008-09 GFC, -30% in 2002), EPS would drop 40% to about $100.

Let’s now value the S&P 500 using a “low on low P/E”, that is the index bear market low divided by the eventual cycle low EPS. At a 2009 R20 low/low P/E of 18.5 = 1850.

image

Using the relatively more stable book value and ROE relationship, during the GFC the S&P 500 book value declined 8.0%, more than twice the 2001-02 hit (-3.0%) because of all the financial write-downs and write-offs and some large bankruptcies, and its ROE crumbled from 17.6% to 11.1%. These are unlikely to decline as much this time given the wide monetary and fiscal backstops quickly erected but let’s assume a 5% drop in BV to $900 and a 13.0% ROE, the average low ROEs of the last 4 cycles adjusted for the current lower tax rate.

image(Data from CPMS/Morningstar)

That’s an EPS low of $117; with a R20 P/E of 15.4 = 1800; at 18.5 = 2150. Remember that the 15.4 low R20 P/E was in 1982 when interest rates were in the stratosphere: T-bills at 11.5% and 10Yr Treasuries at 14%.

A last measure is price to book value. The low in 2002 was at 2.42x BV and in 2009 it was at 1.56x BV. At the low $900 BV derived above, we get 1400 to 2200, quite a wide range. But our assumed 13% ROE is 20% higher than in 2009 (11%) and equal to 2002, and is much less debt levered than in 2008-09 (D/E of 1.3 vs 0.8 in 2002, current = 0.9) justifying a P/B closer to the 2002 level.

Recap on this “worst” case, top-down exercise:

  • R20 P/E 2009 low on $100 EPS: 1850
  • R20 P/E 2009 low on $117 EPS: 2150
  • Low P/BV on BV low: 2200

BEAR WITH ME

As shown, historically, bear markets have bottomed at a R20 P/E ranging between 14.5 and 17.4 (average of 16.3, median of 17.0) trailing earnings, with a friendly Fed, and valuation lows held, irrespective of trends in profits and Fair Value.

At its current level of 2500 and $164.59 trailing EPS, the S&P 500 Index is at 17.5 on the R20 P/E scale. It would need to decline to 2000 to reach the 14.5 range low, really just about as low as it got historically barring depression/deflation. At the 16.3 average: 2300.

My top down approach finds a 1850-2200 low range using “possible” cycle lows in book values and ROEs to derive “possible” cycle lows in earnings to which we applied the Financial Crisis valuation low of March 2009 using that cycle’s lowest earnings of $40 (-55% from peak). That’s like saying “what’s the lowest multiple investors would use assuming they knew the actual low profits in this cycle”. At 1850, we would get the lowest multiple on the worst probable profits.

FYI, Goldman Sachs is now seeing $110 for S&P 500 EPS this year, bouncing back to $170 in 2021. Rainbow

I would not bet much on that $170 number, wishful thinking like if nothing had happened. Consider that

  • we don’t know how and when this virus outbreak will end;
  • everybody has been terribly scared and bruised; individuals and businesses will change their behavior, perhaps significantly: consume less, save more;
  • retirees and near-retirees will have been particularly impacted in their income, savings and pension funds; they will save even more;
  • governments at all levels will also be bruised, they will need revenues to restore their finances and to spend on various health issues; priorities will change and so will taxation.

NOTHING WRONG BEING LATE

Risk tolerance varies a lot, even more so in the current situation where the worst case is really bad. As Richard Bernstein Advisors explain, being late is no great sin:

The table below shows the returns for the full 18-month period encompassing the six months before and the 12-months after the market bottom. We compare the hypothetical returns of an investor who owns 100% stocks for the entire period (“6 months early”) with one who holds 100% cash until six months after the market bottom (“6 months late”).

In general, it has been better to be late than early. Not only do returns tend to be greater when you invest “late,” but more importantly, you’ve never had negative returns in this strategy. When investing “too early,” the magnitude of the drawdowns at the bottom often more than offsets the initial rally off the bottom (nearly a third of the time).

image

I looked at valuation levels 6 months early and 6 months late for each case since 1957 except 1987 (2-month crash, irrelevant). An investor disciplined to only buy when the R20 P/E is below 20.0, i.e. below Fair Value, would not have bought early in 5 of the 6 bear markets it was better to buy late and would have been successful buying early at attractive valuations in the other 3. The only miss would have been 1974 (-4%) but there would have been a huge win in 1982 (46%).

Conclusion: ok to be early if equities are cheap enough, but still nothing wrong being late if your risk (stress) tolerance requires.

High five ANOTHER WORST CASE!

Unfortunately, this is far from a normal downturn, a normal recession, a normal bear. So the following is not a far-fetched dismissible scenario. Demand and supply have been destroyed around the world and they will not (cannot) return V-shaped. A deep/long crisis could well hit income and savings so much that a new “new normal” would occur around the world, even potentially causing depression/deflation.

It happened between 1930 and 1933 (–10.7% deflation in 1932), dragging the R20 P/E down near zero along with an 80% crash in the R20 Fair Value as earnings collapsed 75% over 3 years.

image

Equities did not really recover until Fair Value turned up in early 1934, FOUR years later!

image

Nothing wrong being late…

The Rule of 20 P/E is currently 17.5, normally the high re-entry level, yet not a clear bargain, particularly given all remaining risks and fuzzy future prospects.

Most investors will want confidence

  • that the coronavirus is being controlled with limited risk of a deadly seasonal return in the fall; a cure by summer would secure everybody before a vaccine ends the pandemic: odds are good on that score.
  • that the fiscal and monetary measures are effectively preventing a depression: also good odds given the widespread “whatever it takes – we’ll deal with whatever consequences later” policies.
  • that our leaders actually lead sensibly and intelligently with coordinated strategies: hmmm…efficient and sensible leadership varies a lot by country, even by state…Some decisions could have dire consequences.

Beyond the bear, it is reasonable to assume that valuations will not quickly return to recent excesses. Previous Mama bears left enough bruises to keep people cautious for a while as these charts illustrate:

The first chart covers 1980 to mid-1991. From the low in September 1982 to the next peak in 1987, the R20 P/E (black line) needed 40 months to return to its 20 Fair Value level, spending the first 36 months deep into undervalued territory. A similar cautious state prevailed after the October 1987 crash as the R20 P/E returned to 20 only 31 months after the sudden and quick bear punch.

image

The next chart covers the last 2 Mama bears. After the 2000-02 wallop, valuations spent the better part of the next upcycle in the 18-20 R20 P/E range. Actually, it was not until well after the 2008-09 brutal and enduring Mama bear that valuations successfully crossed into the rising risk area in mid-2016.

image

Given this nasty Pole bear and its viral origins, it seems reasonable to expect another extended display of investor cautiousness. If so, it would be more appropriate to think of the equity valuation range for the next 2-3 years as between 16 and 20. There is really nothing wrong with that. It means that Mama bear will eventually morph into a gentle, slowly aging bull wary of jumping wildly across the Fair Value fence where it always transforms itself into the dangerous ursid kind. Bulls can also be prudent and calm.

Some of Bob Farrell’s ten rules should be recalled here:

  • 5. The public buys the most at the top and the least at the bottom
  • 6. Fear and greed are stronger than long-term resolve
  • 8. Bear markets have three stages — sharp down, reflexive rebound and a drawn-out fundamental downtrend

It is generally during the drawn-out fundamental leg that capitulation occurs, when people get really scared and discouraged by the relentless negative data and bearish media coverage. We shall see if the eventual victory on the virus can totally offset the terrible economic, financial and corporate data of the next several months.

Our politicians are not seasoned confidence builders, to say the least. With a U.S. presidential election only 7 months away, and so much at stake, it is fair to expect additional volatility also stemming from that wild bullpen.

Bob’s rule #10:

  • 10. Bull markets are more fun than bear markets

Related posts: