The enemy of knowledge is not ignorance, it’s the illusion of knowledge (Stephen Hawking)

It ain’t what you don’t know that gets you into trouble. It’s what you know for sure that just ain’t so (Mark Twain)

Invest with smart knowledge and objective odds

THE DAILY EDGE: 27 JANUARY 2020

Business survey suggests U.S. labor market may have peaked There is an even balance in the share of U.S. businesses reporting decreases and increases in employment for the first time in a decade, a survey showed on Monday, the latest suggestion that the labor market has likely peaked and job growth could slow this year.

“For the first time in a decade, there are as many respondents reporting decreases as increases in employment at their firms than in the previous three months,” said NABE Business Conditions Survey Chair Megan Greene.

“However, this may have been due to difficulty finding workers rather than a pullback in demand.”

The survey is based on the responses of 97 NABE members on business conditions in their companies or industries. It was conducted between Dec. 23 and Jan 8. and reflects conditions in the fourth quarter and the near-term outlook. (…)

FICO Changes Could Lower Your Credit Score

Fair Isaac Corp., FICO -1.39% creator of FICO scores, will soon start scoring consumers with rising debt levels and those who fall behind on loan payments more harshly. It will also flag certain consumers who sign up for personal loans, a category of unsecured debt that has surged in recent years.

The changes will create a bigger gap between consumers deemed to be good and bad credit risks, the company says. Consumers with already-high FICO scores of about 680 or higher who continue to manage loans well will likely get a higher score than under previous FICO versions. Those with already-low scores below 600 who continue to miss payments or accumulate other black marks will experience bigger score declines than under previous models.

Millions of consumers could see their scores rise or fall as a result of the changes, the company said. (…)

Trump Expands Aluminum, Steel Tariffs to Some Imported Products

The Trump administration expanded its trademark steel and aluminum tariffs to cover certain imported nails, staples, electrical wires and some downstream parts that go into automobiles and tractors, among other products. (…)

Some imports of derivative aluminum products would be subject to an additional 10% duty, while some derivative steel products would be slapped with a 25% tariff, he said.

Argentina, Australia, Canada and Mexico were exempted from the additional aluminum tariffs. As for the steel tariffs, exemptions were allowed for Brazil, Argentina, Canada, Australia, Mexico and South Korea. (…)

Pentagon Blocks Clampdown on Huawei Sales Proposed rules making it harder for American firms to sell to Chinese company are withdrawn

The Commerce Department’s efforts to tighten the noose on Huawei Technologies Co. is facing a formidable obstacle: the Pentagon.

Commerce officials have withdrawn proposed regulations that would make it harder for U.S. companies to sell to Huawei from their overseas facilities following objections from the Defense Department as well as the Treasury Department, people familiar with the matter said.

The Pentagon is concerned that if U.S. firms can’t continue to ship to Huawei, they will lose a key source of revenue—depriving them of money for research and development needed to maintain a technological edge, the people said. The chip industry has pressed that argument in talks with government officials. (…)

Huawei is an enormous customer for U.S. high-tech firms. The semiconductor manufacturer Micron Technology Inc., for instance, said in its 2019 annual report that Huawei accounts for 12% of its revenue.

If those companies can’t continue to ship to Huawei, Pentagon officials feared, the firms would fall behind economically and not have the funds to invest heavily in research and development, according to the people. (…)

Separately, the administration is exploring how it could help companies produce hardware that could compete with Huawei on 5G within 18 months, a senior administration official said. Discussions include government and corporate representatives from Japan and other democratic countries, the official said.

That effort would help the U.S. persuade other nations, including the U.K. and Germany, to bar Huawei equipment from their networks, the official said. The U.K. is expected in the week ahead to decide whether to ban use of Huawei equipment, which the U.S. considers a security risk. (…)

State AGs, U.S. Justice Lawyers to Discuss Google Probe: WSJ Attorneys general will meet with Justice Department lawyers this week to discuss separate investigations of Alphabet Inc.’s Google, the Wall Street Journal reported, citing people familiar with the matter.
Taxpayers Decide Some States Aren’t Worth It After the new tax law made it costlier to own a house in many high-price areas, some residents of states such as California, New York and Texas are pulling up stakes.

(…) A turning point was the federal tax overhaul that Congress passed in late 2017. The law made it costlier to own a house in many high-price, high-tax areas, reshaping the economics of homeownership in those slices of the U.S.

Two years after President Trump signed the tax law, its effects are rippling through local economies and housing markets, pushing some people to move from high-tax states where they have long lived. Parts of Florida, for example, are getting an influx of buyers from states such as New York, New Jersey and Illinois. (…)

These changes have the biggest impact on a sliver of the population who have high incomes and live in expensive areas. They tend to have white-collar jobs and the ability to pick up and move. Many own their own businesses, work remotely or are nearing retirement. (…)

EARNINGS WATCH

From Refinitiv/IBES:

Through Jan. 24, 85 companies in the S&P 500 Index have reported earnings for Q4 2019. Of these companies, 68.2% reported earnings above analyst expectations and 23.5% reported earnings below analyst expectations. In a typical quarter (since 1994), 65% of companies beat estimates and 20% miss estimates. Over the past four quarters, 74% of companies beat the estimates and 19% missed estimates.

In aggregate, companies are reporting earnings that are 4.8% above estimates, which compares to a long-term (since 1994) average surprise factor of 3.3% and the average surprise factor over the prior four quarters of 4.9%.

Of these companies, 64.7% reported revenue above analyst expectations and 35.3% reported revenue below analyst expectations. In a typical quarter (since 2002), 60% of companies beat estimates and 40% miss estimates. Over the past four quarters, 58% of companies beat the estimates and 42% missed estimates.

In aggregate, companies are reporting revenue that are 1.1% above estimates, which compares to a long-term (since 2002) average surprise factor of 1.5% and the average surprise factor over the prior four quarters of 1.0%.

The estimated earnings growth rate for the S&P 500 for 19Q4 is -0.5% [-0.3% on Jan. 1]. If the energy sector is excluded, the growth rate improves to 2.4% [+2.0% on Jan. 1].

The estimated revenue growth rate for the S&P 500 for 19Q4 is 4.5%. If the energy sector is excluded, the growth rate improves to 5.7%.

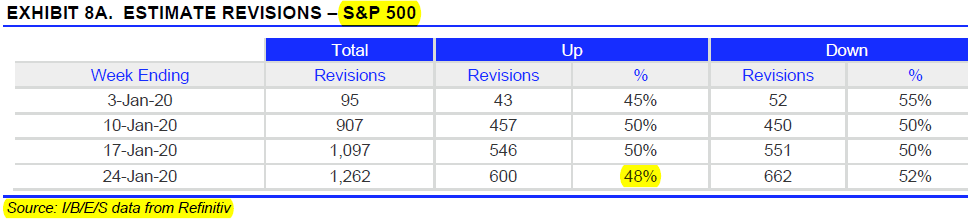
Analysts have been revising downward somewhat more last week.
image

image

The estimated earnings growth rate for the S&P 500 for 20Q1 is 5.5% [+6.3% on Jan. 1]. If the energy sector is excluded, the growth rate
declines to 4.9% [+5.5% on Jan. 1].

The 85 companies having reported so far aggregate a +3.1% earnings growth rate, much better than the –0.6% at the same time during Q3’19. Financials are the main contributor to the better start to this season. With close to half of Financials in, their blended growth rate for the quarter is +13.1%, substantially better than the expected –0.5% for all 500 companies. Yet, their beat rate is only 58% and their miss rate 32%. Financials earnings are seen up 11.1% for the quarter, down from 12.3% on Jan.1 and 11.6% one week ago. Financials account for 36% of the 85 reports in at this point.

As it stands now, trailing EPS are $163.13, down from $163.78 at the end of December and from their recent high of $164.43 in August.

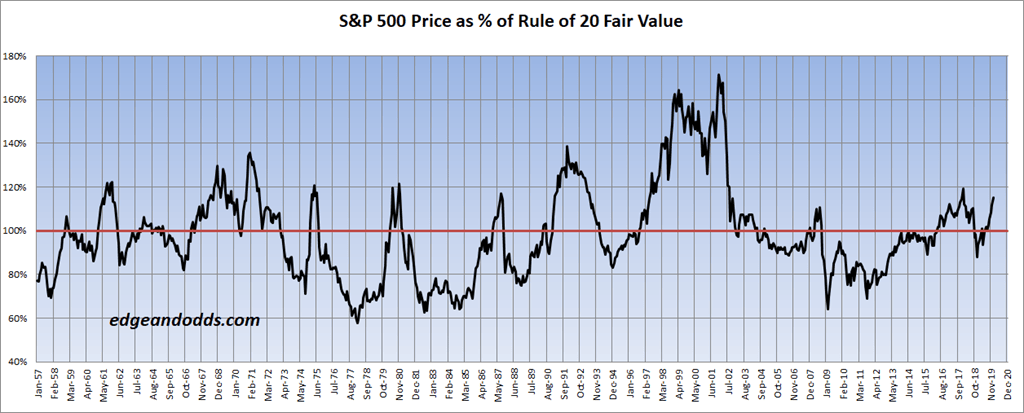
We currently face 2 dangerous conditions:

  • at 3325, the S&P 500 Index is selling 15.2% above its Rule of 20 Fair Value (2886). Since 1957, excluding the 98-02 dot.com bubble years, the Price/R20FV has exceeded 115% only 9.5% of the time.
  • the R20 Fair Value is declining. It peaked at 2952 in June 2019 when trailing EPS peaked at $163.99 (now $163.13) and inflation troughed at 2.0% (now 2.3%).
image

This unstable condition can only return to its Fair Value 20 mean through either a violent market setback (6 times since 1957) or a gradual restoration in valuations with a sustained rise in Fair Value through higher earnings and/or lower inflation (2 times).

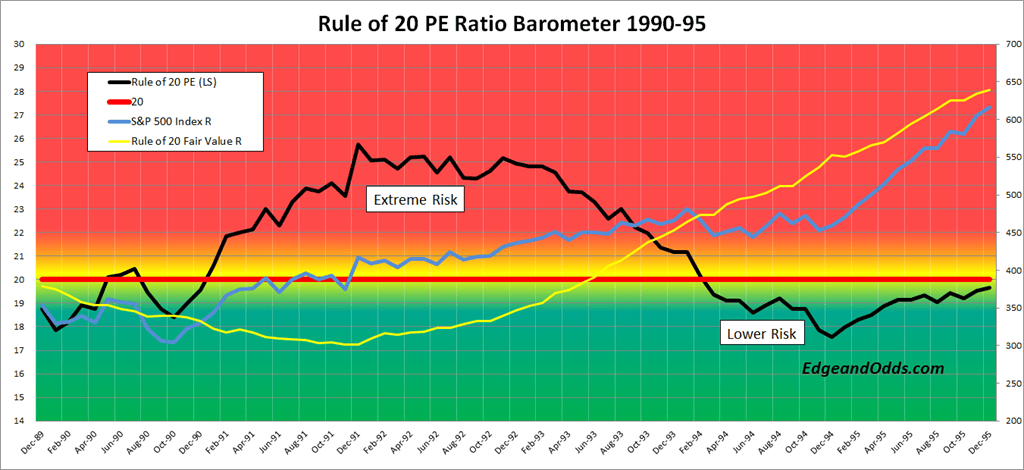
We all have to wish this is more akin to 1992-93 when the S&P 500 Index went from a 15% to 38% overvaluation between June and December 1991 and essentially marked time for 18 months while inflation eased from 4.4% to 3.5%, before gradually climbing to its Jan. ‘94 peak thanks to a 35% jump in trailing earnings which brought the Index back to fair value. During the second half of 1994, the R20 P/E dropped below 20 to allow buying lower-risk equities just before the 1995 strong uptrend. Curbing equity exposure during the period of overvaluation reduced risk at no net cost since stocks did not outperform cash.
image

The fortunate 1992-93 earnings jump happened thanks to a 7.1% total gain in real GDP, a decline in inflation throughout the period and a 33% increase in corporate profit margins.

imageAt this time, sell-side analysts are “hoping” earnings rise 9.5% in 2020 but we know this is more than likely wishful thinking based on their historical record. Much of the hype in current earnings forecasts and equity prices assume a “more normal” economy post the trade war, higher capex and increased earnings from cyclical companies.

The coronavirus episode is compounding the risk for China’s economy and cyclicals in general. China provides 35% of the world’s total growth.

KKR’s view on 2020 earnings trends is more cautious…

image

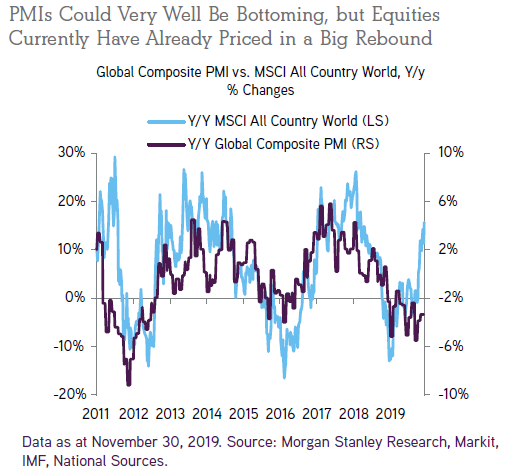
…and warns that equity markets may be too optimistic:
image

In effect, the recent rebound in Markit’s U.S. manufacturing PMI, unconfirmed by the ISM surveys, needs continued uptrends in new orders (charts from The Daily Shot):

 image image

The Conference Board’s LEI warns of an economic slowdown…

Source: @TCosterg (via The Daily Shot)

…totally unaccounted for by equity markets:

Source: @MacroOps (via The Daily Shot)
TECHNICALS WATCH

Lowry’s Research, which has been spot on throughout 2018 and 2019, continues to see signs of strength just about across the board. “While trying to handicap the extent of the market’s next correction is largely an exercise in futility, what does appear certain is that this bull market continues to display signs of health that historically have been consistent with months more and possibly many months more of gains.”

Lowry’s measures of Supply (falling) and Demand (rising) display “the antithesis of a market in the process of forming a significant top.” On Advance-Decline trends, “there is not a whisper of the
Adv-Dec Line divergences that historically appear months prior to a major market top.”

Here’s what Lowry’s was saying at the end of January 2018, when the Rule of 20 P/E reached 23.5 just before the S&P 500 Index corrected 11.8% in a matter of 2 weeks. Right at the peak:

No rally goes on forever (at least so far) and corrections are a normal part of any sustained primary uptrend. Thus, it’s important for investors to recognize the difference between a short-term market top that leads to a correction and the progressive deterioration in market conditions that has, historically, preceded every major market top over Lowry’s 92 year history of bull and bear markets.

And, those key elements are a sustained, months-long uptrend in Selling Pressure and an equally significant downtrend in Buying Power. In addition, divergences between the Adv-Dec Lines and new highs in the S&P 500 have, historically, developed on average 4 to 6 months prior to the final market high. Absent these key elements, any market tops that form in the weeks and months ahead are likely to be short-term in nature and serve as an opportunity for new buying.

Lowry’s then correctly called a market bottom in mid-February. On June 29, 2018, amid investors angst about trade wars and peak earnings, Lowry’s wrote “whatever the accompanying narrative of red flags, the
forces of Supply and Demand appear consistent with prices undergoing a typical short-term pullback
within an ongoing and healthy bull market.”

On September 28, 2018, Lowry’s warned about small caps and weak stocks while maintaining a positive long-term view on equities.  On December 14, 2018, it wrote “given current market conditions, cash raised from the sale of underperforming stocks should probably be held awaiting signs of the renewed Demand needed to power a sustained market rally.”

On December 28, 2018, at 16.9 on the Rule of 20 P/E scale, “Overall, the rally on Dec. 26th compares favorably with rallies off significant lows in 2010, 2011 and 2015. (…) Evidence of heavy selling was then quickly followed in each of the earlier rallies by signs of renewed strong Demand (…). Each of these lows was then followed by a sustained rally, with each rally reaching a new bull market high within an average of 4 ½ months.”

Now that we are at 22.7 on the R20 P/E, Lowry’s says “whatever the risk for a near-term pullback, the ongoing signs of strength demonstrated by the bull market suggest that any weakness that might develop would represent only a temporary pause in a primary uptrend with many more months to run.”

Sounds like Lowry’s is seeing a repeat of 1992-93. As this President likes saying, we’ll see what happens.

THE DAILY EDGE: 24 JANUARY 2020

U.S. Leading Economic Indicators Index Eases

The Conference Board’s Composite Index of Leading Economic Indicators declined 0.3% during December following a 0.1% November uptick, revised from no change. It was the fourth decline in five months. During all of 2019, the leading index rose 1.5% after a 5.7% increase during 2018. From December-to-December the index ticked up 0.1%. (…)

Contributing negatively to the index change were weekly initial claims for unemployment insurance, building permits and the ISM new orders index. Contributing positively were stock prices, factory orders for consumer goods, the yield spread between 10-year Treasuries & Fed Funds, consumer expectations for business/economic conditions and the leading credit index. Exhibiting a neutral effect on the change in the leading index were the average workweek and new orders for nondefense capital goods excluding aircraft.

Three-month growth in the leading index of -1.4% (AR) was negative for the third straight month and below the high of +9.1% in December 2017. The y/y change eased slightly to 0.1% compared to a 6.5% high in September 2018.

The Index of Coincident Economic Indicators rose 0.1% during December after increasing 0.3% in November, revised from 0.4%. (…) Three-month growth in the coincident index held steady m/m at 1.1% (AR) but was down from 2.3% in August.

The Index of Lagging Economic Indicators eased 0.1% during December after a 0.4% November gain, revised from 0.5%. (…) Three-month growth in the lagging index eased slightly to 1.9%, but remained up from -0.4% in October. Twelve-month growth declined to 2.3%, down from 3.5% in July.

The ratio of coincident-to-lagging economic indicators is sometimes considered a leading indicator of economic activity. It increased modestly in December.

Charts from Advisor Perspectives:

Conference Board's LEI

Smoothed LEI

Scott Minerd, Global CIO at Guggenheim Partners, asserts that “every US recession has been preceded by 3 negative months of LEI. Since #LEI began in 1959, 3 consecutive monthly declines have resulted in a #recession within 6 months 7 out of 11 times…Three consecutive declines are a necessary but insufficient condition, but 4 negative prints will seal the deal.”

Well, we got the 3 negative months between August and October but November was up one tick and December was down 3 ticks. Now what’s needed to “seal the deal”?

Meanwhile, initial claims are cleanly back within their 2-year channel:

image

FLASH PMIs
USA: Output growth quickens to ten-month high

U.S. private sector firms indicated a faster expansion of business activity in January, with the pace of growth accelerating to a ten-month high. The upturn was driven by a sharper increase in service sector output, as growth of manufacturing production was unchanged.

Adjusted for seasonal factors, the IHS Markit Flash U.S. Composite PMI Output Index posted 53.1 in January, up from 52.7 in December, to indicate the quickest rise in output since last March. The increase in output was solid overall, despite the pace of growth remaining below the series long-run trend.

image

New business across the private sector continued to rise in January, albeit at a softer pace. The upturn in client demand softened slightly as both manufacturers and service providers registered slower expansions of new orders. In fact, goods producers recorded the least marked improvement in demand since last September, with growth easing further from November’s ten-month high. Meanwhile, new export orders placed with U.S. private sector firms dipped into contractionary territory at the start of 2020.

Nevertheless, firms expanded their workforce numbers at a faster rate in January. Employment grew for the third successive month and at the quickest pace since last July. The rate of job creation accelerated to a six-month high at service providers, while manufacturers registered the slowest rise in workforce numbers since last September.

Meanwhile, price pressures across the private sector remained historically subdued, despite the rate of input cost inflation picking up to a seven-month high. Higher operating expenses were commonly linked to stronger increases in raw material prices and wages. Average output charges rose at only a marginal pace, with the rate of inflation easing from December’s ten-month high.

At the same time, output expectations across the private sector improved at the start of 2020, with optimism reaching a seven-month high in January.

The seasonally adjusted IHS Markit Flash U.S. Services PMI™ Business Activity Index registered 53.2 in January, up from 52.8 in December. This signalled a solid increase in service sector output that was the fastest since last March.

Although the pace of output growth accelerated, the expansion in new orders moderated slightly. The upturn in sales was the third in as many months, and signalled stronger client demand compared to the second half of 2019.

Service providers were buoyed by further business activity growth and increased their workforce numbers, and at a quicker rate.

Service sector firms signalled an improvement in business expectations, as the degree of optimism reached a seven-month high. However, business confidence remained well below the series trend

Finally, the rate of input price inflation quickened to the sharpest since last July, despite being historically muted. In an effort to remain competitive, services firms raised their output charges at only a modest pace.

Manufacturing firms noted a slower improvement in operating conditions in January, as signalled by a slight dip in the IHS Markit Flash U.S. Manufacturing Purchasing Managers’ Index™ (PMI™) from 52.4 to 51.7 in January. Notably, the latest upturn in the health of the sector was the softest since last October.

Although output continued to rise at a moderate pace, new business growth was only marginal as both domestic and foreign client demand softened. Furthermore, new export orders fell for the first time since last September, though only slightly.

Nevertheless, goods producers continued to increase their workforce numbers at the start of 2020, albeit at the slowest pace for four months. The softer rise in employment coincided with signs of easing capacity pressures, with January seeing the first fall in backlogs for four months.

At the same time, price pressures eased across the manufacturing sector in January. A weaker increase in cost burdens occurred alongside only a fractional rise in factory gate charges.

Eurozone growth remains muted at start of 2020

Flash PMI data for January indicated that the eurozone economy failed to pick up growth momentum at the start of 2020. Business activity increased at the same slight pace as was seen in the final month of 2019 as the rate of expansion in new orders remained muted.

Underlying data showed that growth of services activity eased slightly, while the manufacturing sector moved closer to stabilisation. Combined growth of the ‘big-2’ eurozone economies picked up, but this was offset by near-stagnation across the rest of the single-currency area.

The ‘flash’ IHS Markit Eurozone Composite PMI® was unchanged at 50.9 in January, signalling a further muted increase in activity across the euro area economy. The rate of expansion has remained broadly stable since the start of the final quarter of 2019, running at the weakest for around six-and-a-half years.

image

The overall expansion in business activity was again centred on the service sector. That said, services activity rose at a slightly weaker pace than in December. Meanwhile, manufacturing production remained in contraction, but the rate of decline eased to the softest in five months.

The ongoing muted pace of output growth reflected a lack of momentum in new order inflows. New business increased for the second month running in January, but the rate of expansion remained marginal. There were signs of manufacturing new orders nearing stabilisation at the start of the year, with the rate of decline in new work easing to the softest since November 2018. This was also the case with regards to manufacturing new export business.

image

While rates of growth in output and new orders remained muted at the start of the year, companies were increasingly confident regarding the year-ahead outlook for activity. Business sentiment rose to a 16-month high, largely thanks to a fifth successive improvement in confidence among manufacturers amid signs that the worst of the recent downturn has passed.

Confidence in the outlook for output encouraged companies to take on additional staff in January. The rate of job creation quickened from that seen at the end of 2019, but remained muted amid further job cuts at manufacturers. Rises in operating capacity enabled companies to deplete backlogs of work again at the start of 2020.

The rate of input cost inflation quickened to an eight-month high, but remained relatively muted. In turn, companies raised their selling prices at a pace that was broadly in line with those seen through the second half of 2019.

A sharp and accelerated increase in input costs was recorded in the service sector, while the current sequence of decline in manufacturing input prices was extended to eight months.

The ‘big-2’ eurozone economies of France and Germany saw a positive start to the year, with combined output growth at a five-month high. Germany in particular showed signs of recovery as overall output rose for the second successive month amid a first increase in new orders since June last year. A stronger expansion in services activity and a less marked decline in manufacturing production contributed to the improving picture.

The recent solid performance of the French economy continued in January as both output and new orders rose for the tenth month running. Rates of expansion softened, however, amid weaker growth in the service sector.

The rest of the euro area showed signs of weakness. Output growth slowed to a six-and-a-half year low, signalling a near-stagnation in business activity outside Germany and France. In fact, new order volumes were unchanged and firms raised staffing levels only fractionally.

Japanese economy rebounds at the start of 2020

The headline Jibun Bank Japan Manufacturing Purchasing Managers’ Index™ (PMI)® increased to 49.3 in January, up from a previous reading of 48.4, thereby signalling continued contraction of the goods-producing sector. However, the decline was the slowest since last August and only mild overall.

The headline Business Activity Index [Services] moved above the neutral 50.0 mark during January, rising to 52.1 from 49.4 in December. This signalled a rebound of services activity and the quickest output expansion in four months. Stronger increases were also recorded for new business and employment, while output charges moved up into inflation territory.

image

“Positive signs have emerged for Japan’s economy at the start of 2020, with flash PMI data pointing to a domestic-led economic recovery. While official data are yet to confirm it, the fourth quarter looks on track to register an ugly decline in GDP. The January flash numbers will certainly allay fears for now of an impending technical recession in Japan. (…)

“Nevertheless, manufacturing confidence edged up in January in the wake of easing US-China tensions and some optimism regarding Japanese relations with South Korea. Panel comments suggesting that demand conditions in the semi-conductor industry have picked up is a promising sign.

New Warehouse Supply Projected to Exceed Demand Over Next Two Years

Developers are expected to deliver about 301 million square feet of new warehouse space in the U.S., Canada and Mexico this year, while tenants will lease about 242 million square feet, according to a new report from Cushman & Wakefield PLC.

The real-estate firm projects builders will deliver another 272 million square feet in 2021, outpacing projected demand of 218 million square feet. (…)

Cushman & Wakefield said in its report that builders added more space in North America in 2019 than tenants could take on, the first time since 2009 that has happened. (…)

Goldman to Refuse IPOs If All Directors Are White, Straight Men

Goldman Sachs Group Inc. Chief Executive Officer David Solomon issued the latest ultimatum Thursday from Davos. Wall Street’s biggest underwriter of initial public offerings in the U.S. will no longer take a company public in the U.S. and Europe if it lacks a director who is either female or diverse. (…)

BlackRock Inc. and State Street Global Advisors are voting against directors at companies without a female director. Public companies with all-male boards based in California now face a $100,000 fine under a new state law. (…)

Almost half of the open spots at S&P 500 companies went to women last year, and for the first time they made up more than a quarter of all directors. In July, the last all-male board in the S&P 500 appointed a woman. (…)

Next year, the bank will raise the threshold to two diverse directors, which includes diversity based on sexual orientation and gender identity, Goldman said in a statement. (…)

EARNINGS WATCH

We now have 74 S&P 500 companies in, sporting a low 68% beat rate (74% last 4 quarters) and a 23% (19%) miss rate, with a +3.9% surprise factor. The actual earnings growth of these 74 companies is +0.5% in Q4 on a +3.4% increase in revenues.

During Q3’19, the first 73 companies to report had an 84% beat rate and a 12% miss rate, with a +4.3% surprise factor. Their actual earnings growth was –0.9% on a +2.9% revenue gain.

Q4’19 earnings are now seen down 0.7% (+2.0% ex-Energy), from –0.3% on Jan. 1.

IT companies are leading this rally, perhaps because all 9 companies that have reported their Q4 beat estimates with a +2.5% surprise factor. Tech earnings are still expected up only 0.8% in Q4, slightly better than the +0.5% growth expected on Jan 1.

image

Analysts see a nice rebound in growth starting in Q1’20 and accelerating big time to +15.7% in Q4’20. Let’s hope they have more luck this year than last. That said, tech analysts are in good company on earnings forecasts…

image

image

  • The chart suggests that the tech sector appears stretched, at nearly 20% above its 200-day moving average. (Isabelnet) Image: Strategas

S&P Technology Sector and 200-Day Moving Average

Same with large caps overall as Ed Yardeni illustrates:

image

IT stocks are selling at 22.3x forward EPS, a 26% premium over non-IT equities.

image

Net earnings revisions have turned positive for IT companies:

image

They sure need it given their current PEG ratio:

image

At today’s opening of 3325 on trailing EPS of $163.20:

image
Cash or No Cash? Optimist, Pessimist or Realist?

David Kotok at Cumberland Advisors:

(…) Think about this question when the 5 largest stocks are 1/5 of total market weight and are in the highest beta sector.  Remember cash is zero beta: The S&P 500 index of all 500 stocks has a beta of 1; those 5 largest stocks have a beta above 1.5.

So far, this 2019–2020 stock market rally has been fierce. It started at the low point on Christmas Eve in 2018. Since then, the bias toward the large-cap tech sector has dominated the market. Consider that there are four companies with market caps above $1 trillion. They are Amazon, Apple, Microsoft, and Alphabet (Google). A fifth large-cap stock, Facebook, sits at a mere $700 billion. The total of the FAAMG stocks now equals about 19% of the market capitalization of the S&P 500 Index. The other 495 stocks make up 81% of that market cap. And the market cap-to-GDP ratio is the highest in the entire history of the American stock market while the profit share of that GDP is stagnant except for the benefit of the tax cuts.

The five FAAMG companies are all stellar business operations. They all have multidimensional and multinational business reach. They are all growing despite their enormous size.

So the question facing investors is not if these are viable companies, and not if they are making or losing money, and not if they have adequate capital. Those answers are “Yes!” The questions facing the investor are (1) how do I deal with momentum, and (2) how high is the price before it represents an extreme valuation.

Both questions are subject to robust debate. Please note that you could have had this debate months ago when the prices were lower. And also note that you may have it again months from now when prices may be higher. Pundits and analysts can talk and write all day long about risks and issues. They do not face the buy-sell-hold decisions that a professional money manager faces every single day.

In today’s world, the momentum issue is the most difficult one. We know momentum is powerful. We know it can continue for much longer than folks expect. We do not know when it will change, and we can only guess at the catalysts for change.

In today’s world a special factor is the policy of the world’s central banks. In the United States, the Federal Reserve has been expanding the size of its balance sheet and is maintaining interest rates at a very low level. The policy interest rate in the United States is below the various inflation rates, which means that the use of money (in real terms) is free. When that happens, asset price momentum is upward and will likely continue to be upward as long as money expands and the cost of money is next to zero.

In Europe and Japan, policy is expansive, and the cost of money is free or subsidized by negative interest rates. Remember, when the interest rate is negative, the theoretical asset price can go to infinity. With the usage of cross-currency interest-rate swaps, there is a clear transmission mechanism such that the negative rates in Europe and Japan end up raising asset prices in the United States.

In sum, this stock market is driven by momentum, and it is a force that must be respected. The market could go higher or much higher. It could stumble into a serious correction. We saw a 20% correction within the last two years. To be sure, this stock market could go both much higher and much lower in the coming year.

Meanwhile, we have some cash in reserve, and we are worried about the extended market behavior of FAAMG and its secondary effects on the broader indexes. Our ETF selection is defensive. Our quantitative strategies hold cash or defensive and lower-beta positions.

Twenty years ago, we faced a problem with the NASDAQ market top and the tech stock bubble. At that time (April 1, 2000), we wrote a piece entitled “Will the NASDAQ sell-off become a crash? A Value Perspective.” Here is a link to our archive. https://cumber.com/pdf/Cumberland-Advisors-April-2000-Will-the-NASDAQ-sell-off-become-a-crash.pdf. The circumstances today are different, and history never repeats itself exactly, though it often “rhymes.” We shall see.

All in one year:

Market Sentiment Indicators

U.S. Satisfaction Surpasses 40% for First Time Since 2005

Forty-one percent of Americans are satisfied with the way things are going in the U.S., a level not seen in nearly 15 years. (…)

The higher level of satisfaction measured in the Jan. 2-15 Gallup poll comes at a time when Americans’ evaluations of the U.S. economy are the best they have been in nearly two decades, perhaps because of continued low unemployment and record stock values. (…)

Line graph. Americans' satisfaction with the way things are going in the U.S., 2004-2020.

Consistent with this pattern, 72% of Republicans are currently satisfied with the way things are going in the U.S., compared with 14% of Democrats. Thirty-seven percent of independents are satisfied.

The five-percentage-point increase in overall satisfaction this month is primarily attributable to higher ratings among Republicans. Since last month, there has been a 14-point increase in Republicans’ satisfaction. Meanwhile, the percentage of independents who are satisfied is unchanged since December, and Democrats show a statistically nonsignificant two-point increase.

Since Gallup began measuring national satisfaction in 1979, 37% of Americans, on average, have been satisfied, meaning the current figure is just above the historical average. The highest satisfaction level Gallup has measured was 71% in February 1999.

The prolonged slump in satisfaction ratings since 2005 — with an average 27% satisfied — has brought the historical average down six points from where it stood in 2004.

One reason satisfaction readings have been lower in recent years is that those who identify with the party that does not occupy the White House have been extremely reluctant to say they are satisfied with how things are going in the country. Since 2005, on average, 11% of the opposition party’s supporters have said they were satisfied. Between 1992 (the earliest year for which Gallup compiled party data) and 2004, the opposition party’s satisfaction levels were three times higher, at 34%.

However, reflecting a broader discontent that has taken hold in the country, supporters of the sitting president’s party have also expressed lower satisfaction since 2005 (45%) than they did before (57%).