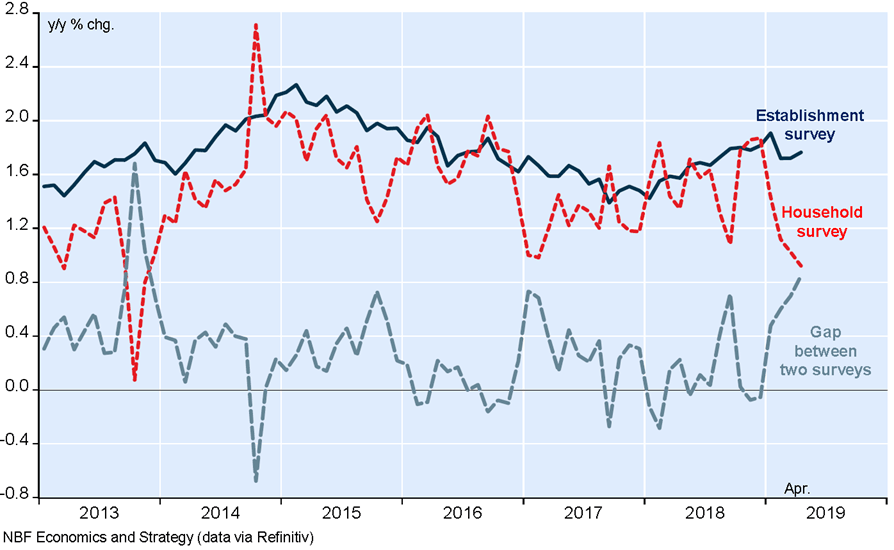
(…) The jobs report is derived from two separate surveys, one of employers and one of families, and those surveys were at odds in the latest month.
The survey of 142,000 employers, which economists find more reliable month to month, showed strong hiring. That is consistent with the idea that Americans are getting back to work in greater numbers. The survey of 60,000 households, however, reported fewer Americans were working or even looking for work. In the longer run, the data from both surveys tend to move together. (…)
The payroll survey was almost universally qualified as great. But, thankfully, David Rosenberg plays his bearishness to the fullest:
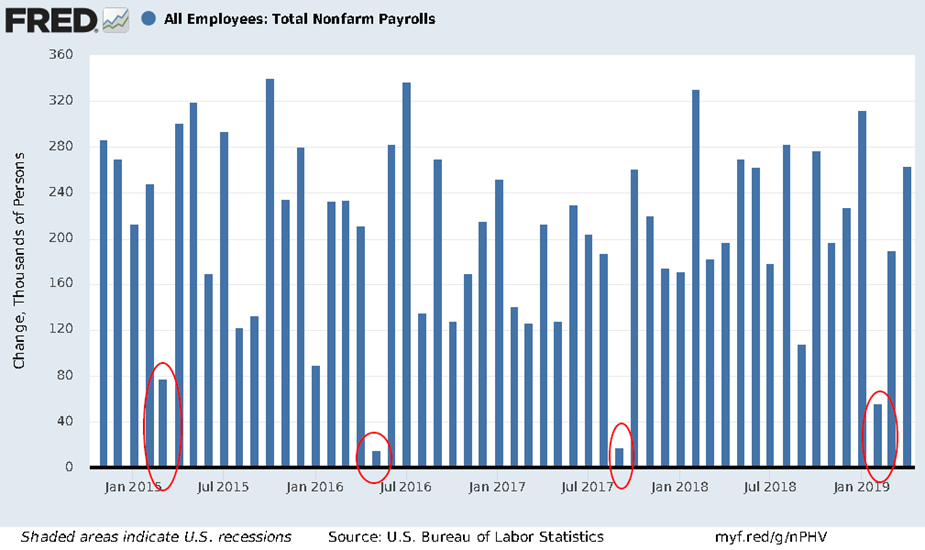
- “The average gain in NFP employment in the past three months is +169k versus the average of +245 in the previous three months.”
But David, we’ve had occasional weak months killing a 3-m sequence, only temporarily…

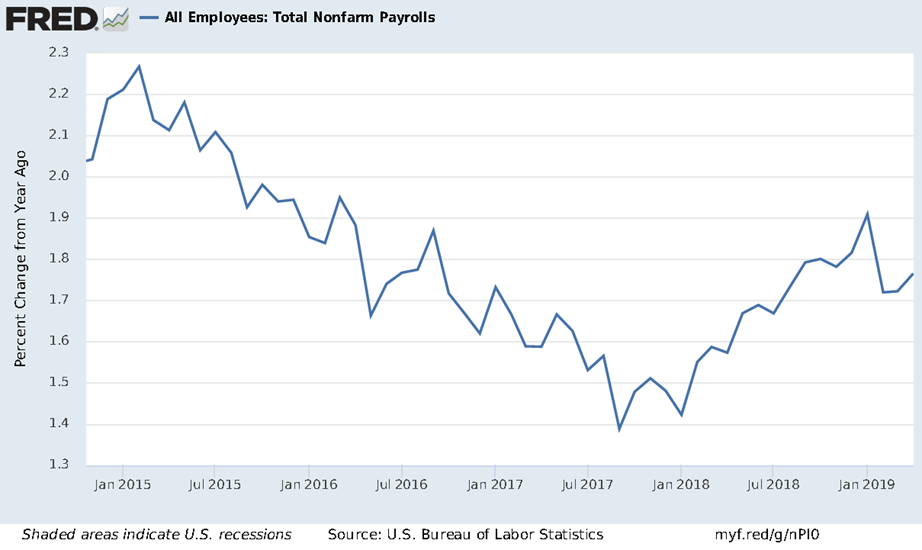
Here’s the YoY trend:

- “Two-thirds of all the employment gains came in just four sectors which have very little sensitivity to the contours of the business cycle”.
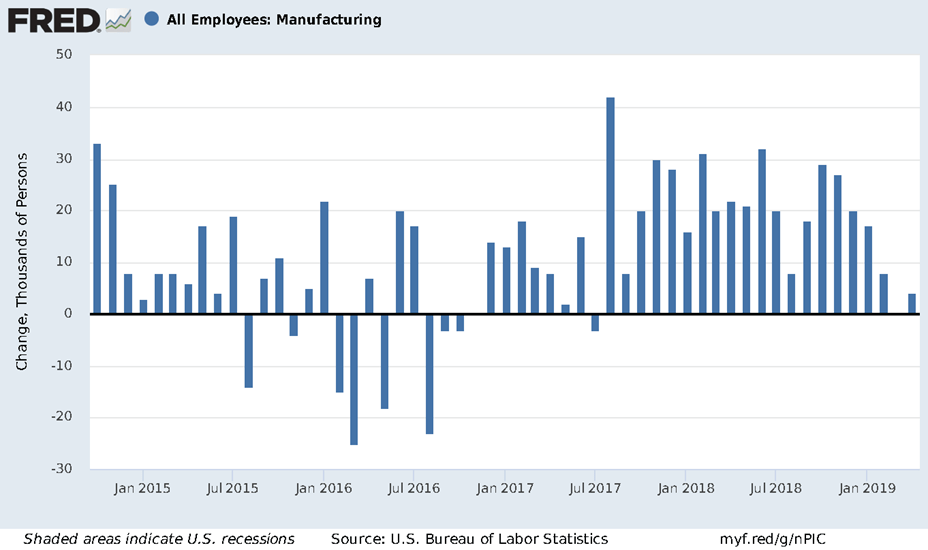
But David, a 3-m lull in manufacturing jobs is nothing compared with 2015-16. And the YoY growth was +1.6% in April, a touch slower than total employment growth. Actually, the diffusion index for all 258 industries surveyed by the BLS was 60.1% in April, up from 59.7% and 58.1% in the two previous months.

- “93k of that +263k nonfarm payroll print came from the BLS birth-death model – the guestimate of how many jobs come from net new business creation.”
But David, the estimated net birth/death rate averaged 89k in the last 12 months and +74 in the last 4.
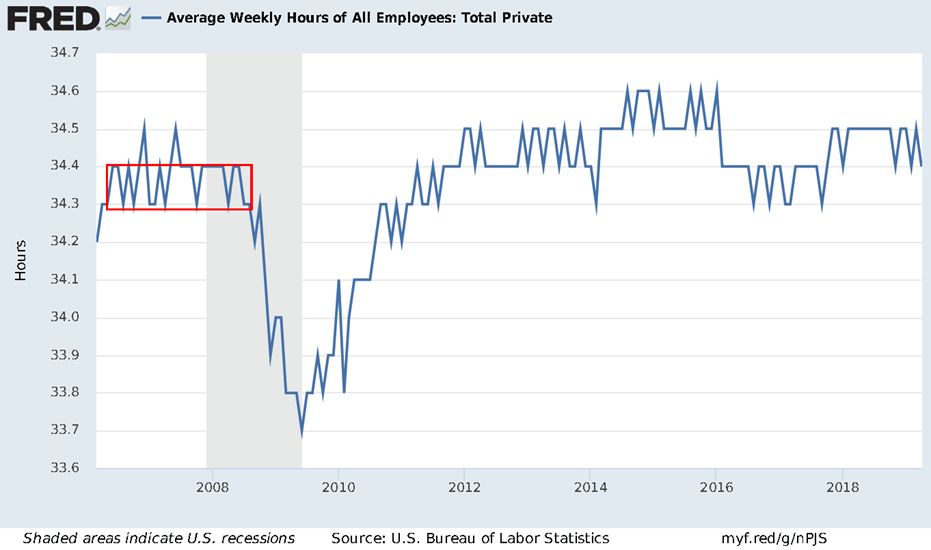
- “It is absolutely imperative to pay close attention to the workweek, which contracted 0.3% in April (to 34.4 hours) and has declined or stagnated in three of the past four months…So netting this against the number of jobs that were added to payrolls, the net effect was actually the equivalent of a 100k reduction in employment in April.”
Really David? Absolutely imperative?

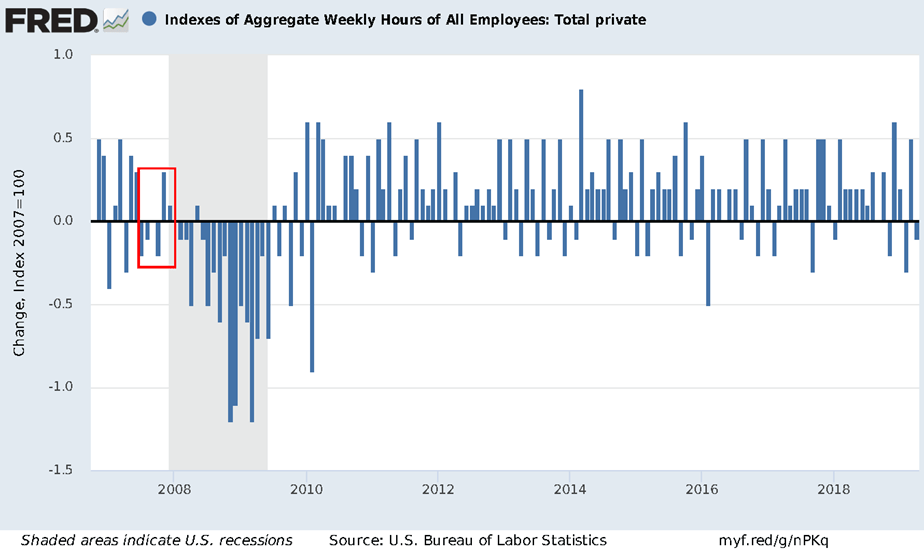
- “Beneath the veneer of that bullish headline was a 0.1% drop in aggregate hours worked (…) This index (…) has declined now in two of the past three months and has stagnated since the start of the year.”
But David, you could also have mentioned that aggregate hours have declined in 3 of the last 6 months, something last seen only in 2016, 2013 and 2007. However, weekly hours are still up 0.7% (+1.4% annualized) in the last 6 months. And BTW, they are actually up 0.3% (1.2% a.r.) since the start of the year.

- “(…) if the labor market were truly on wheels, then we would be seeing more of a wage impulse – but average hourly earnings only eked out a 0.2% MoM gain for the second month in a row and the YoY trend has stopped accelerating and is now running at +3.2%. (…) As an aside, the combination of the meagre wage gain and shrinkage in the workweek means that average weekly earnings – the mother’s milk for work-based personal income – receded in April in the biggest retreat since November 2016, and this dragged the YoY trend down to 2.9%, from 3.2% in March and the 3.5% nearby peak back in January.”
But David, you could have mentioned that hourly earnings for production and nonsupervisory employees, 80% of the work force, are on wheels, being up at a 3.5% annualized rate in the last 3 months (+3.7% in the last 6 months) while inflation is slowing, unlike in 2007-08.

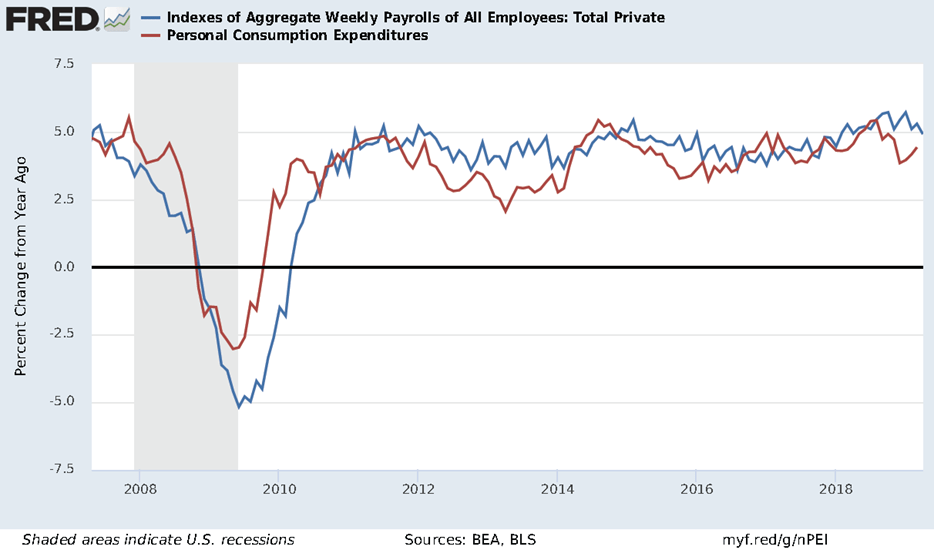
Here’s the payroll index aggregating hours and earnings. It is up 5.0% YoY, quite enough to sustain consumer spending through the spring given current inflation trends. In the 6 months before the Financial Crisis, the payroll index was rising at a 1.8% annualized rate, down from +4.8% in the previous 6 months.

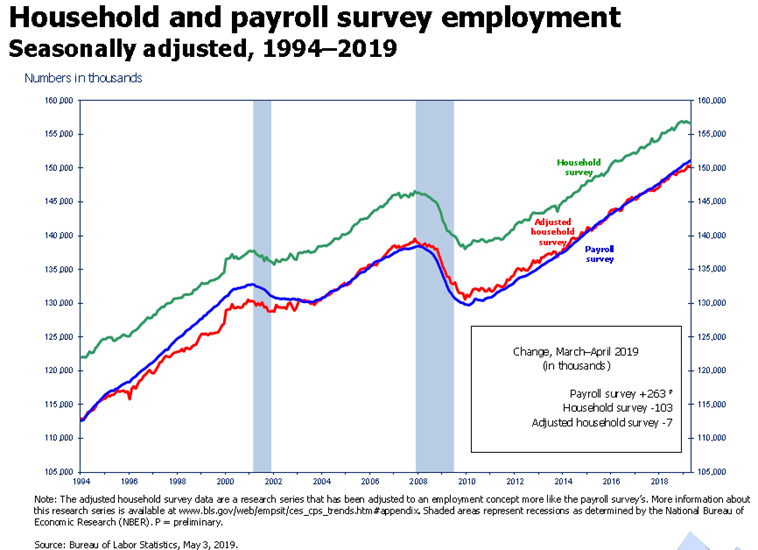
Where David has stronger points is in the recent weakness in the Household Survey which has indeed displayed rather weak numbers since November: a grand total of +63k new jobs in 6 months and –530k in the last 4 months.

The BLS attempts to explain occasional divergences between the two surveys and seeks to reconcile them with an “adjusted household survey” (more on this here):


I will leave economists debate on this but simply mention two points:
- the Household Survey has indeed showed cracks earlier than the Payroll Survey prior to the last 2 recessions. There seems to be some cracking in recent months.
- David rightly points to the recent weakness in full-time employment (2 back-to-back drops totalling 381k and +17k in last 4 months) and to the increase in people working part-time for economic reasons (+344k in last 2 months, but –3k in last 4 months). Those are not signs of a very healthy employment environment…but also not signs of a meaningfully deteriorating picture, just yet anyway.

The latest PMI surveys confirm that the economy is not as strong as the Q1 GDP numbers suggest and that employment growth is indeed slowing:
April data signalled a slower increase in business activity across the U.S. service sector. Output rose at the softest pace since March 2017 as new business growth also eased to a two-year low. Despite a further increase in backlogs of work, firms reined in their hiring, with the rate of job creation slowing to a two-year low. Uncertainty and increased competition meanwhile pushed business expectations to the lowest for almost three years, while rates of input price and output charge inflation eased to 26- and 18-month lows, respectively.
The seasonally adjusted final IHS Markit U.S. Services Business Activity Index registered 53.0 in April, down from 55.3 in March. The latest expansion was broadly in line with the earlier released ‘flash’ figure of 52.9, and signalled the slowest increase in output since March 2017. The upturn was below the long-run series average and indicated a less robust start to the second quarter of 2019. Some firms noted that client demand was subdued, and a number of survey respondents stated that increased competition and uncertainty had dented sales growth.

Similarly, new business increased at a slower rate in April. The upturn was the softest for two years, amid reports of less robust demand conditions. Nevertheless, some firms stated that new client acquisitions had driven sales higher. The pace of new export sales growth was broadly in line with that seen in March and marginal overall.
Service providers also reported a lower degree of confidence in future output growth in April. Although the respective index posted well above the 50.0 neutral mark, the level of optimism dipped to its lowest level since mid-2016. A number of survey respondents stated that greater uncertainty and more intense competition had dampened expectations towards the year ahead.
On the prices front, firms noted a slower rise in input costs in April. Panellists widely commented that the softer rise was linked to less marked increases in raw material prices. Service providers also reported a less robust rise in output charges. The increase was only marginal overall and the slowest since October 2017. Some firms also noted that greater competition had placed pressure on companies to keep selling price rises to a minimum.
Meanwhile, the slowdown in new business resulted in a softer increase in employment in April. Where a rise was reported, panellists linked this to the replacement of leavers following long-held vacancies and a further increase in new business. The rate of job creation was only moderate and the slowest for two years.
Despite a slower rise in workforce numbers, service sector firms continued to register a rise in outstanding business in April. The increase was the fourth in as many months and broadly in line with the series trend.
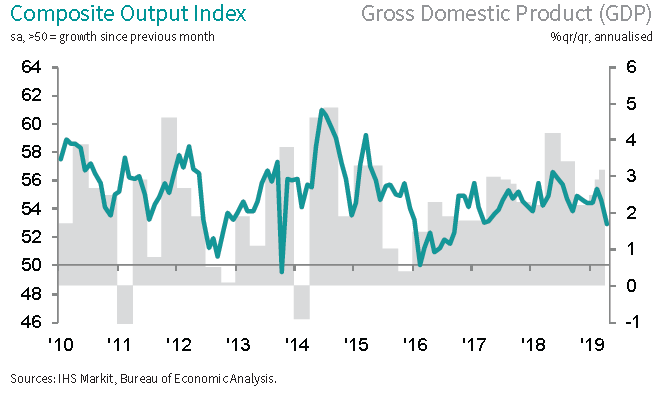
The Composite PMI Output Index registered 53.0 in April, down from 54.6 in March and the lowest since March 2017. Although the output expansion quickened across the manufacturing sector, production growth remained relatively subdued. A less robust service sector performance also weighed on growth.

Similarly, a slowdown in service sector new business growth counteracted a slight pick up in manufacturing client demand, as the overall upturn in new orders eased to a 24-month low. Meanwhile, new export sales rose at a marginal rate in April.
Inflationary pressures eased across both the manufacturing and service sectors. Input prices rose at the slowest pace since September 2016. Subsequently, firms increased their selling prices at a softer rate. Increased competition was also reportedly a factor behind the softest rise in output charges since October 2017.
Meanwhile, the expansion in overall employment was only modest overall and the slowest for two years. That said, private sector firms registered greater pressure on capacity with backlogs continuing to rise.
Finally, business expectations moderated across both the manufacturing and service sectors, sliding to the lowest since June 2016.
Chris Williamson, Chief Business Economist at IHS Markit:
The final PMI surveys for April indicate a marked slowing of the US economy at the start of the second quarter, suggesting the robust start to the year has lost some momentum. Businesses reported the weakest output and sales growth for two years, indicative of GDP growth slowing to 1.9% in April.
While the first quarter saw factory weakness being offset by a robust service sector, both manufacturing and services have now shifted into a lower gear.
An additional concern is that business optimism about the year ahead has slumped to its lowest since mid-2016, reflecting widespread reports from companies that weaker economic growth will likely further dampen business activity in coming months.
Jobs growth has subsequently slipped to a two-year low as firms took a more cautious approach to hiring and expanding capacity in the face of the weaker sales growth and a gloomier outlook. Price pressures have fallen alongside the slower rate of economic growth signalled by the surveys, as firms struggled to raise prices amid intense competition.
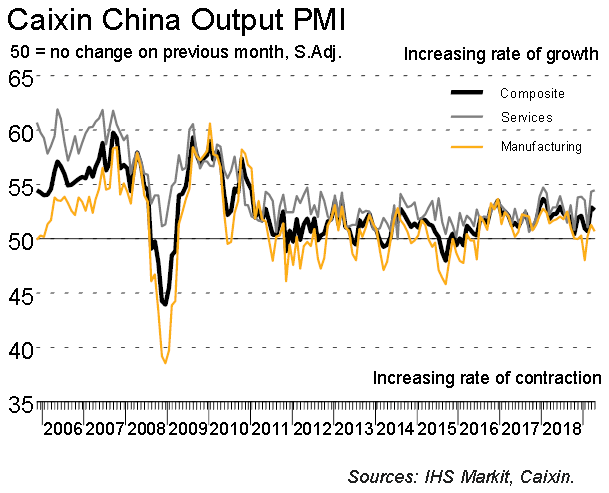
The Caixin China Composite PMI™ data (which covers both manufacturing and services) indicated that Chinese business activity continued to rise strongly during April. This was shown by the Composite Output Index posting above the neutral 50.0 value at 52.7, which was down only slightly from a nine-month high of 52.9 in March.
Data broken down by sector signalled that the increase in overall business activity was largely driven by services companies. Notably, the seasonally adjusted Chinese Services Business Activity Index edged up from 54.4 in March to 54.5 in April, to mark its second-highest level since May 2012 (after January 2018). Meanwhile, manufacturing firms registered only a marginal increase in production at the start of the second quarter.

The rise in services activity was supported by a further strong increase in new business across the sector. This was despite the rate of new order growth softening slightly since March. According to panellists, improved marketing strategies, new product offerings and firmer underlying market demand supported the latest increase in sales. The amount of new work received by manufacturing companies meanwhile increased only slightly. Consequently, composite new orders expanded at a modest rate that was softer than that seen in March.
The amount of new export work received by services companies rose at the sharpest pace since the series began in late-2014 in April. A number of firms commented on stronger demand across key markets and greater efforts to develop foreign client bases. In contrast, manufacturing export sales slipped back into decline, though the rate of reduction was only slight. At the composite level, new export orders fell marginally following an increase at the end of the first quarter.
Employment trends diverged by sector in April, with service providers adding to their payroll numbers while manufacturers signalled a decline. Though modest, the latest increase in service sector staffing levels was the quickest recorded for 10 months, with some firms linking growth to greater amounts of new business. Meanwhile, workforce numbers at manufacturers declined slightly, following the first increase for over five years in March. As a result, employment at the composite level rose at a marginal pace that was similar to that seen in March.
Services companies in China continued to signal a lack of pressure on operating capacities in April, as highlighted by a further decline in outstanding workloads. That said, the rate of backlog depletion was the slowest seen in the year to date. The amount of unfinished business at manufacturing companies meanwhile continued to increase, though the rate of accumulation was the weakest seen for three years. Overall, lower backlogs at services firms offset the rise at goods producers to leave outstanding work unchanged at the composite level.
Operating expenses continued to rise at service providers, with the rate of input price inflation the steepest recorded since September 2018. Manufacturing businesses registered only a marginal increase in purchasing costs during April. At the composite level, input costs rose at a modest pace that was the fastest seen for five months.
Latest data indicated that both manufacturing and services companies increased their charges at the start of the second quarter. That said, factory gate prices rose at only a fractional pace. Service providers meanwhile hiked their charges at a rate that, though marginal, was the quickest seen since June 2018, which some companies linked to firmer demand conditions.
Business confidence remained relatively subdued across China in April amid concerns over the strength of the global economy. At services companies, sentiment edged down to its joint-lowest in five months. Manufacturers meanwhile saw optimism improve slightly to an 11-month high but remain relatively soft overall.
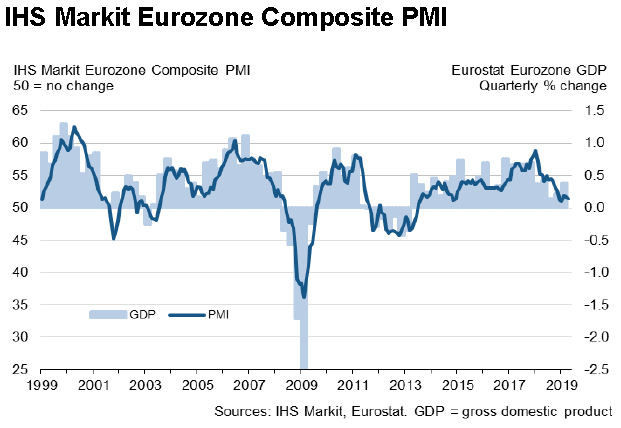
The IHS Markit Eurozone PMI® Composite Output Index recorded 51.5 in April, compared to 51.6 in the previous month. The latest index reading was the lowest for three months, though a little firmer than the flash reading of 51.3. Moreover, despite its modest level in April, by remaining above the 50.0 no-change mark, the index signalled that growth of the private sector economy has now been recorded continuously for nearly six years.

There remained notable differences in performance between the manufacturing and services sectors. Whereas manufacturing production fell for a third successive month, service sector growth was sustained at a solid, albeit slower, rate. The net increase in activity was again linked to higher levels of incoming new work, which rose modestly but at the best rate since last November. Manufacturing new orders continued to fall markedly, in contrast to a solid uptick in services.
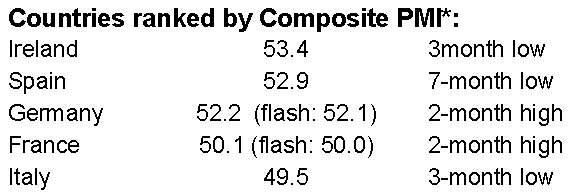
 (…) Germany was the only other nation to record a noticeable increase in activity. France saw output stabilise, whilst there was a return to contraction for Italy followed last month’s expansion.
April’s survey data signalled the ongoing expansion of the private sector workforce in the euro area. According to the latest figures, growth of employment was solid and stronger than in March. Growth has now been recorded throughout the past four-and-a-half years, with April’s gains again driven by Germany, Spain and Ireland. Relatively modest gains in employment were seen in France and Italy.
The addition of new employees again helped firms to keep on top of their existing workloads during April. This was highlighted by a second successive monthly decline in levels of work outstanding held by euro area private sector companies. Rising demand for staff, and an expanded workforce, helped drive average salary costs higher in April. This helped to explain another net increase in firms’ overall operating expenses, with the degree of inflation accelerating since March to its historical trend level. However, competitive pressures continued to weigh on pricing power, with average output charges rising in April at the slowest rate for 20 months.
Finally, business sentiment was unchanged since March. Latest data again showed manufacturers recording a noticeably lower degree of sentiment about the future than their services counterparts.
The IHS Markit Eurozone PMI® Services Business Activity Index remained above the 50.0 no-change mark level during April, though by falling to 52.8 from 53.3 in the previous month, signalled a slightly slower rate of expansion. The moderation in growth occurred despite an improvement in growth in Germany and a return to expansion in France. Noticeably slower gains in activity were seen in Italy and Spain.
In contrast, there was a slight pick-up in growth in new business recorded during April, which continued to encourage firms to take on additional workers. Underpinned by the sharpest rise in employment in Germany since October 2007, the overall rise in euro area service sector employment was the fastest recorded for six months. Higher staffing levels meant that firms were able to keep on top of their workloads, as highlighted by data on backlogs of work which showed no change since March.
Rising employment costs did, however, help to underpin another round of input cost inflation in the services economy. Although firms tried to pass on higher costs to clients, the degree of increase was slightly slower than the previous month.
Finally, business confidence amongst service providers remained in positive territory during April, and remained broadly in line with levels seen in the preceding two months.
Chris Williamson, Chief Business Economist at IHS Markit:
The final eurozone PMI for April came in slightly higher than the flash estimate, though still indicated that the economy lost a little momentum at the start of the second quarter and that growth remains worryingly lacklustre. The survey is indicative of the economy growing at a quarterly rate of approximately 0.2%, but manufacturing remained mired in its steepest downturn since 2013 and service sector growth slipped lower.
In a month in which oil prices continued to rise, it was no surprise to see input cost inflation accelerating for the first time in six months. It is therefore disappointing to see average selling prices for goods and services showing the smallest monthly rise since August 2017, strongly hinting at weakened pricing power and lower core inflationary pressures as firms were often unable to pass higher costs on to customers.
(…) Worryingly, growth of output continues to run ahead of that of new orders, meaning even the modest current growth of business activity is only being sustained by firms eating into orders placed in prior months. Demand clearly needs to improve further to generate faster economic growth and give firms greater pricing power.

Trump Issues China Tariff Threat President Trump threatened to drastically ramp up U.S. tariffs on Chinese imports, a twist that surprised many Chinese officials ahead of planned trade talks.
(…) Mr. Trump’s tweets surprised many Chinese officials, according to a person briefed on the matter Monday, and China is considering canceling trade talks that are to resume in Washington starting Wednesday.
“China shouldn’t negotiate with a gun pointed to its head,” the person said. A decision on whether to go ahead with the talks this week hasn’t been made, the person said.
Chinese officials have said Beijing wouldn’t bend to pressure tactics. By potentially scotching the trip, Beijing would be following up on its pledge to avoid negotiating under threat.(…)
But it is far from clear that the U.S. would actually raise tariffs on Friday. That is because the U.S. trade representative may believe he needs to give U.S. industry notice of a substantial tariff change, people who follow the talks said. U.S. officials have moved slowly in implementing tariffs, fearing they could open the door to a legal challenge that could halt their use of the levies. (…)
Growth Is Great, What Could Go Wrong? Trade. Markets have been in Goldilocks territory recently, aided by better growth in the world’s two largest economies and easing trade tensions. But better growth also undermines one key impetus for a deal.
EARNINGS WATCH
Amid all these “on the one hand, on the other hands”, the FOMC is likely to sit uncomfortably on the fence for a while, even more so with the debt sitting in corporate balance sheets (IN GODS WE TRUST) and the recent bipartisan $2T infrastructure program that nobody can figure how to finance (here comes MMT).
Meanwhile, the truth is that the economy is not that strong, overall demand is weakish, inflation is slowing and competition is rising.
BUT earnings are still rising!!!
We now have 388 reports in with a 76% beat rate and a +6.3% widespread surprise factor for an expected +0.9% earnings growth (+2.3% ex-Energy).
Trailing EPS are now $163.58, from $161.93 for all of 2018.
BUT all is not great!!!
- Margins are declining in Q1 in spite of a 5.1% revenue growth rate. The squeeze is hitting 8 of the 11 sectors.
- Analysts are revising their Q1 numbers upward but not subsequent quarters. Q2 estimates have been shaved by 1.0% according to Factset.
- Revenue growth is seen slowing to +4.1% in Q2 and the important sectors (Cons. Disc., Staples, Financials and Industrials) are expected to see their revenue growth rate decline from +3.9% on average in Q1 to +2.1% in Q2. Operating costs are rising faster.
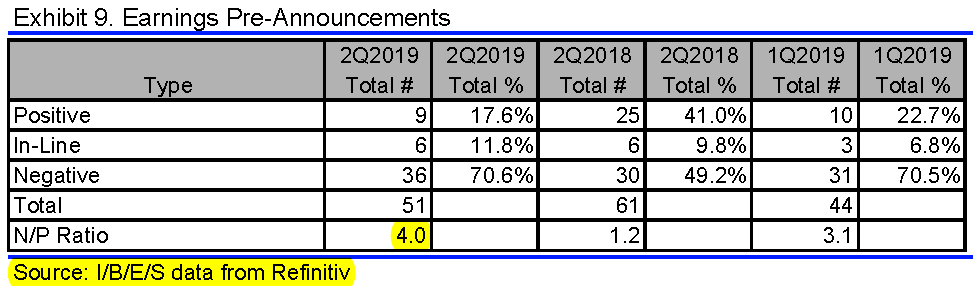
- Preannouncements for Q2 are not pretty so far:

From Bloomberg:
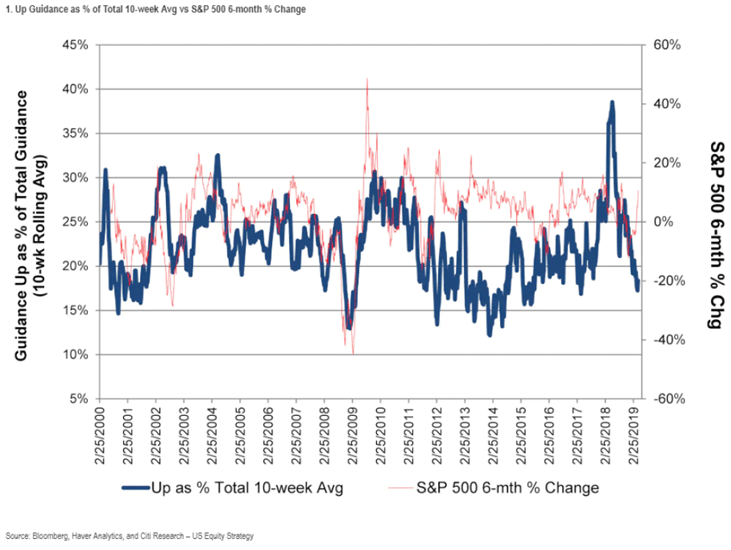
(…) While S&P 500 constituents are beating estimates at a near-record pace, their executives haven’t turned more upbeat on the outlook. Over the last three months, for every firm that lifted guidance above expectations, two cut it, the weakest showing in more than three years, according to data from Bank of America. During conference calls, the number of times the word “optimism” was mentioned fell to a record low. (…)

Still plenty to worry.
TECHNICALS WATCH
Monday of last week, I mentioned that Lowry’s Selling Pressure and Buying Power indices were slowly converging again, needing close monitoring. Friday, Lowry’s added this to its still positive rhetoric: “(…) the current trends in Selling Pressure and Buying Power have only existed for about four weeks and, as such, qualify only as short-term countertrend moves within the prevailing intermediate-term trends dating from the Dec. 24th 2018 market bottom. Nonetheless, the rise in Selling Pressure and decline in Buying Power will be closely monitored in the weeks ahead to determine whether a more significant change in the balance of Supply and Demand is underway.”
FYI, the current gap and trend in the two indices is about where it was at the end of September 2018. The gap had totally closed the third week of October and completely inverted by the third week of December.

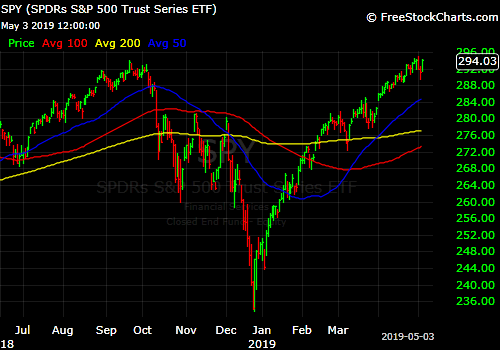
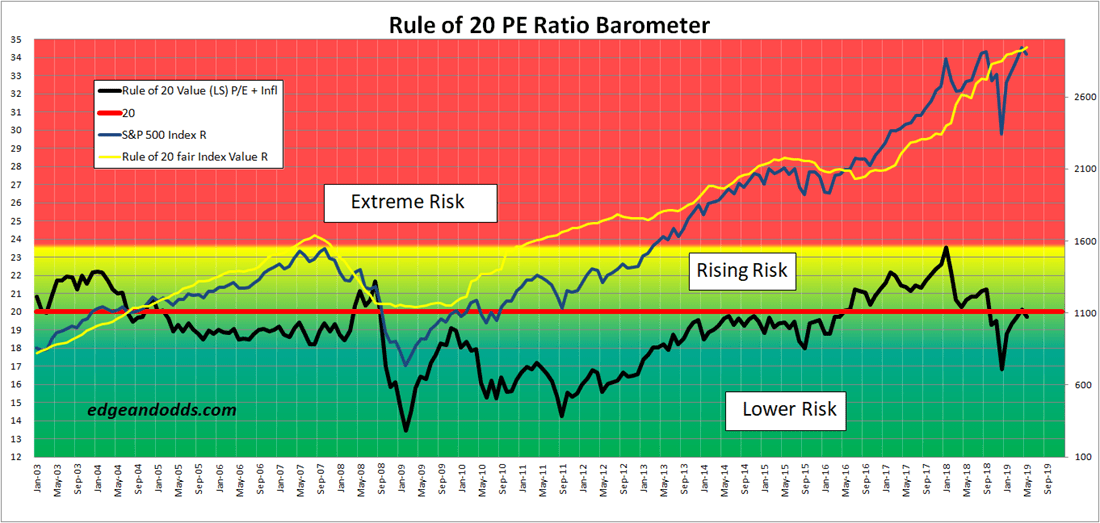
This a.m., the S&P 500 is set to open at 2895, a Rule of 20 P/E of 19.7. During 2014-15, when the Rule of 20 P/E hovered just below 20 while “Fair Value” (yellow line) was rising like currently, low market points were reached between 18.5 (2700) and 19.0 (2790). The 200-day m.a. is at 2770 and rising.

THE SON OF ALL VENTURE FUNDS!
SoftBank Considers IPO for $100 Billion Vision Fund SoftBank’s fundraising plans include a public offering of its $100 billion investment fund and the launch of a second fund of at least that size
(…) The fund’s staff is hustling to keep up with the frantic pace of deal making by SoftBank founder and Chief Executive Masayoshi Son, who has invested nearly all the money that the Vision Fund took in just two years ago.
Highlighting the need for new funds: Mr. Son recently returned from China, where he negotiated informal deals worth several billion dollars that the Vision Fund doesn’t yet have, one of the people said.
The Vision Fund had planned to invest its money over four years, some of the people said, but will have done so in just over two.
Coming IPOs of companies it is invested in—including Uber Technologies Inc. and WeWork Cos.—will free up some money, but not enough to fund everything Mr. Son wants to buy. The fund plans to double its staff to 800 people from 400 over the next 18 months, one of Mr. Son’s top deputies said this week at a conference in Los Angeles, compounding the pressure to raise more money so they can be paid to hunt for deals across the globe. (…)
Venture capitalists typically raise at most a few billion dollars—the whole industry raised $55 billion last year—and so they can get by with checks from smaller funds, wealthy families, other founders and endowments. And even the biggest private-equity funds max out at about $20 billion. Mr. Son is targeting multiples of that. (…)
SoftBank hopes to contribute about $50 billion in cash and other assets to a second Vision Fund, but the company is under financial pressure because of a heavy debt load and weak performance from Sprint. (…)






 U.S.:
U.S.: