THE EMPLOYMENT SITUATION—APRIL 2019
Total nonfarm payroll employment increased by 263,000 in April, compared with an average monthly gain of 213,000 over the prior 12 months. The change in total nonfarm payroll employment for February was revised up from +33,000 to +56,000, and the change for March was revised down from +196,000 to +189,000. With these revisions, employment gains in February and March combined were 16,000 more than previously reported. After revisions, job gains have averaged 169,000 per month over the last 3 months.
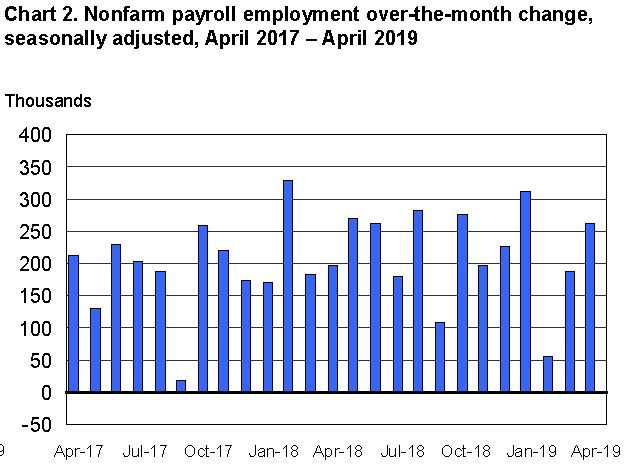
In April, average hourly earnings for all employees on private nonfarm payrolls rose by 6 cents to $27.77. Over the year, average hourly earnings have increased by 3.2 percent. Average hourly earnings of private-sector production and nonsupervisory employees increased by 7 cents to $23.31 in April [+3.4% YoY]
The average workweek for all employees on private nonfarm payrolls decreased by 0.1 hour to 34.4 hours in April. In manufacturing, both the workweek and overtime were unchanged (40.7 hours and 3.4 hours, respectively). The average workweek for production and nonsupervisory employees on private nonfarm payrolls held at 33.7 hours.
The unemployment rate declined by 0.2 percentage point to 3.6 percent in April, the lowest rate since December 1969.
China tempers US hints that Beijing and Washington are preparing for the ‘last round’ of trade talks
Messages from the United States camp that next week’s talks in Washington with China could be the last round in efforts to end the year-long trade war have been tempered by Beijing’s negotiators, who have suggested the tactic to “generate pressure” should not be taken “seriously”.
White House spokeswoman Sarah Sanders said on Thursday that US President Donald Trump and Chinese counterpart Xi Jinping will decide after the negotiations between delegates next week whether to meet to finish the trade deal, hinting that this will be the last round of talks before a possible summit between the two leaders. (…)
But after US Treasury Secretary Steven Mnuchin said on Monday before the US delegation headed to Beijing for the 10th round of talks this week that the US side is expecting to “either recommend to the president we have a deal or make a recommendation that we don’t” following next week’s talks, reaction from the Chinese side did not echo the seemingly fixed deadline for a conclusion.
Taoran Notes, a social media account used by Beijing to release trade talk information and to manage domestic expectations, said the hints from the US side that next week’s 11th round of talks are a deadline is merely a trick “to increase tensions and generate pressure on the other side”.
“It’s the same tactic as the US threatening to raise tariffs, it is merely smoke and mirrors to exert extreme pressure [on China],” the post said. “You don’t have to take it seriously.”
It warned that there is still a possibility that the two sides will end up in “an unhappy departure” if one side wants the other to make compromises and neglects “fairness in negotiation”. (…)
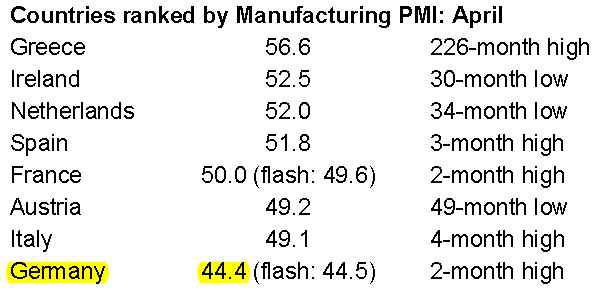
Global manufacturing growth remains lacklustre as international trade flows contract again
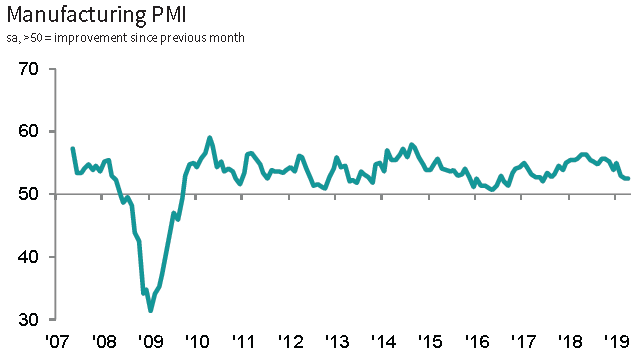
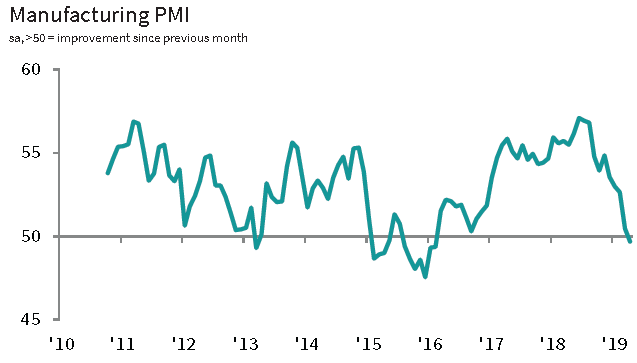
The performance of the global manufacturing sector remained lacklustre in April. Rates of expansion in output, new orders and employment were only marginal, and well below their long-run trends, while new export business fell further.
The J.P.Morgan Global Manufacturing PMI™ – a composite index produced by J.P.Morgan and IHS Markit in association with ISM and IFPSM – posted 50.3 in April, down from 50.5 in March, to register its lowest reading since June 2016. A later-than-usual release date meant Japan Manufacturing PMI data were not available to include in the April 2019 global readings.
The weakness in the global manufacturing sector was most evident in the intermediate and investment goods sectors, both of which saw production and new orders contract during April. The consumer goods industry fared better, with growth of both output and new business accelerating during the latest survey month. Consumer goods was also the only category to see new export work increase, albeit only moderately. (…)
New export business declined for the eighth successive month. Decreases were seen in China, the euro area, Brazil, the UK, Taiwan, South Korea, Turkey, the Philippines, Canada, Mexico, Australia, Poland and the Czech Republic. (…)
The outlook for the sector was relatively subdued in April. Business optimism dipped slightly and remained among the weakest signalled since data on sentiment were first compiled in July 2012 (fourth-lowest overall). Price inflationary pressures continued to ease, with rates of increase in input costs and output charges both at 31-month lows. All three of the sub-industries covered by the survey saw rises in input costs and selling prices, with rates of increase registered for both measures sharpest at consumer goods producers.

Fed Is Shifting the Goal Posts, and Investors Should Care The way the inflation target is implemented could change, with big implications for markets
(…) Goldman Sachs thinks the emphasis on symmetry in the inflation target is already influencing long-dated bonds, as investors anticipate modestly higher inflation over the long run. JPMorgan strategists think the market is already anticipating a “regime shift” to target average inflation, multiplying the impact of the Fed’s dovish turn in January.
If there is a change by the Fed, the effects could be significant in pushing up the prospects for long-run inflation and so bond yields, with knock-on effects across markets. It could also begin a shift by central banks around the world away from the simple inflation targets that have come to dominate policy over the past three decades and open the door to more radical changes, including an acceptance of higher inflation. (…)
Aiming for average inflation would help in a recession because, assuming investors believed the Fed, they would expect rates to stay lower for longer, as the Fed wouldn’t need to clamp down on inflation so quickly in the eventual recovery. That should hold down long-run bond yields and so keep monetary policy easier than it otherwise would be, aiding the economy. (…)
Broadly speaking, the Fed’s rates would be lower at the peak of a boom than under the current policy, which could make financial markets even more prone to bubbles. (…)
If monetary policy proves impotent in the next recession, central-bank-financed spending may well enter the political mainstream.

Negative Yields Deepen Along With Europe’s Problems The amount of negative-yielding government bonds outstanding through 2049 has risen by 20% this year to about $10 trillion
(…) Corporate bonds issued by SanofiSA maturing in 2022 and LVMH Moët Hennessy Louis Vuitton SE maturing in 2021 also traded at negative yields, according to data from FactSet. (…)
In March, the ECB slashed its forecast for real gross domestic product growth this year to 1.1%, from 1.7% just three months earlier, and its forecast for consumer-price inflation to 1.2%, from 1.6%. (…)
In Germany, where growth has stalled, officials plan on running a budget surplus rather than stimulating growth by running a budget deficit. This is a problem because such fiscal restraint by Europe’s largest economy could choke off growth in the rest of the region. By contrast, in Italy, where the heavy debt burden is already seen as a problem, officials have proposed borrowing more to kick-start persistently slow growth. (…)
Euro-Area Inflation Accelerates After String of Upbeat Data
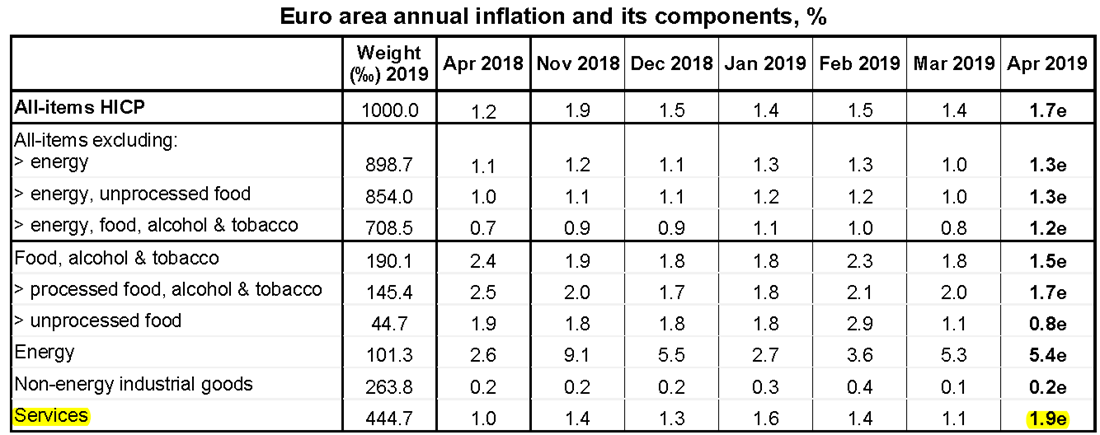
Consumer prices rose 1.7 percent in April from a year earlier — the strongest number since November. The narrower inflation gauge that strips out volatile components such as energy and food came in at 1.2 percent, a six-month high, surging from 0.8 percent in March. (…)
The pickup in price growth may have been partly driven by temporary factors that are likely to unwind in May. Germany data earlier this week showed inflation accelerated at the fastest pace in five months in April on the back of surging cost of package holidays — a side effect of Easter holiday that came later than last year. (…)
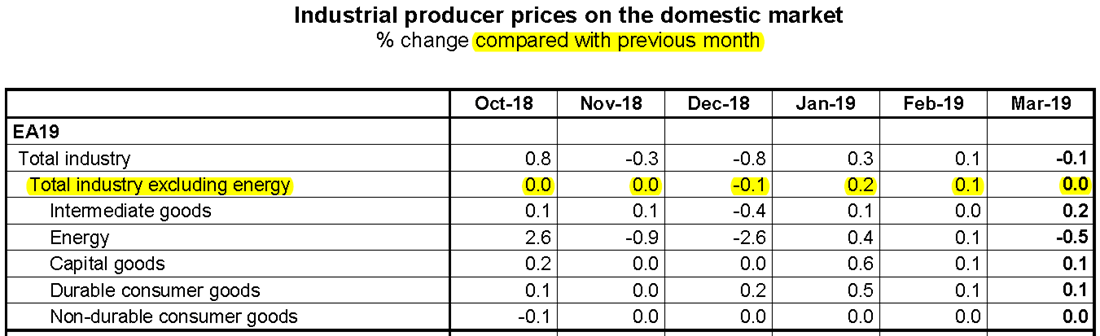
FYI: Real per capita disposable income in the Euro area (19 countries) was +1.2% in 2018 down from +1.6% in 2017. Real per capita expenditures: +0.8% in 2018 (0.0% in second half) from +1.4% in 2017.
Markit also doubts the “string of upbeat data” will continue:
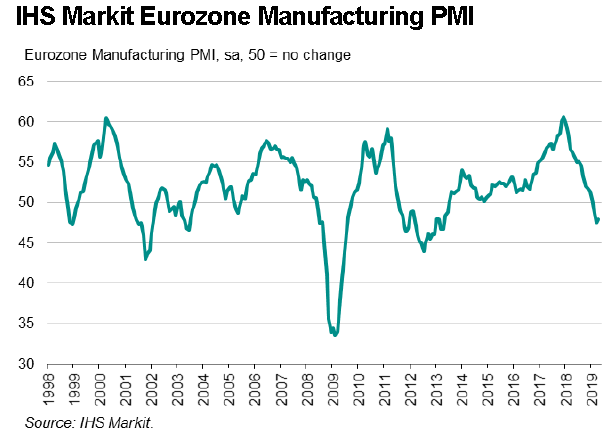
While the official (Eurostat) data appear to be on course to register growth of manufacturing output in the first quarter, the PMI suggests this bounce largely reflects pay-back from a steeper downturn than signalled by the PMI in the fourth quarter: the official data saw output fall 1.0% in the three months to December while the PMI signalled a 0.6% rise.
Such disparities between the PMI and official data are invariably the result of large changes in production in specific sectors (in this case, primarily autos), which are not fully captured by the PMI methodology, but which tend to reverse out in future months. The advantage of the PMI is that the survey provides an accurate guide to the broader underlying growth trend, looking through the noise of the volatile official data.
As such, any recovery signalled by the official data in the first quarter looks set to be only temporary, giving way to renewed weakness in the second quarter.
EARNINGS WATCH
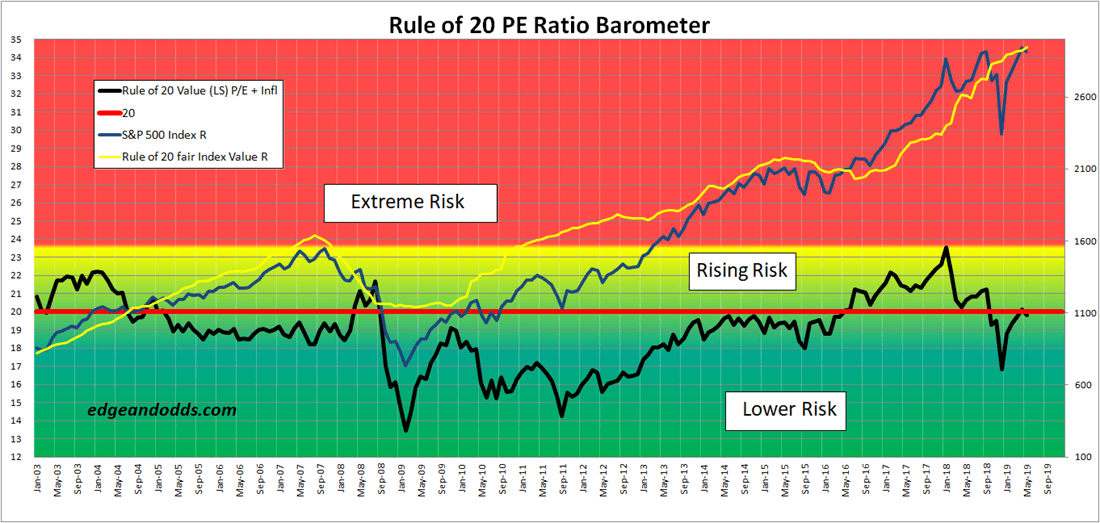
We have 363 companies in with combined earnings up 1.8%: the beat rate is 75%, the surprise factor +6.2% and the blended earnings growth +0.7%.
Trailing EPS are now $163.55.
TECHNICALS WATCH
From CMG Wealth:
- 13/34–Week EMA Trend Chart:

- Volume Demand vs. Volume Supply:
These Ned Davis tables echo the analysis from Lowry’s Research on supply vs demand:


But remember that this game has snakes also:



 Public construction has spiked recently while private non-resid. has been rising at a 8.5% annualized rate in Q1.



 Here is the US output as a percentage of the global supply. (The Daily Shot)