The enemy of knowledge is not ignorance, it’s the illusion of knowledge (Stephen Hawking)

It ain’t what you don’t know that gets you into trouble. It’s what you know for sure that just ain’t so (Mark Twain)

Invest with smart knowledge and objective odds

THE DAILY EDGE: 5 MARCH 2019

THE AMERICAN CONSUMER

Sales of light vehicles decreased 0.8% (-2.6% year-on-year) in February to 16.57 million units at a seasonally adjusted annual rate (SAAR). This is the weakest vehicle sales since February 2015.

An 8.1% drop in auto sales (-11.6% y/y) to a 5.02 million unit pace drove the decline. In January sales increased 2.1%. Purchases of domestically-produced cars fell 9.0% (-11.0% y/y) to 3.65 million units. Sales of imported cars were down 5.5% (-13.0% y/y) to 1.37 million.

Light-truck sales grew 2.8% (1.9% y/y) last month to an 11.55 million unit rate, reversing some of January’s 7.9% drop. Purchases of domestically-made light-trucks gained 2.1% (0.3% y/y) to 9.15 million units. Sales of imported light trucks jumped 4.8% (8.3% y/y) to 2.39 million. (…)

Imports’ share of the U.S. vehicle market rose last month to 22.7%, with the auto share up to 27.3% and the light truck market increasing to 20.7%, a nine-and-a-half year high.

 large image large image

  • Target jumps on 2019 forecast, strong holiday quarter Target Corp forecast full-year adjusted profit above Wall Street estimates on Tuesday and posted better-than-expected holiday quarter results, driven by strong digital sales and higher customer footfall at its stores.

(…) Its comparable sales, that include both in-store and digital sales, rose 5.3 percent (…)

This comes after WMT reported SSS up 4.2% YoY and AMZN product sales +8.2% in Q4.

U.S. Construction Spending Reverses Earlier Increase

The value of construction put-in-place declined 0.6% (+0.8% y/y) during December. It reversed an unrevised 0.8% November gain. A 0.2% rise had been expected in the Action Economics Forecast Survey. During all of 2018, construction’s value rose 4.1%, the weakest increase since a 2011 decline.

The value of private construction activity also fell 0.6% at yearend and was little changed y/y. The decline was the first in three months and was led by a 1.4% drop (-3.5% y/y) in the value of residential building, the fourth decline in five months. Single-family construction dropped 3.2% (-5.2% y/y), the largest of seven consecutive months of decline. The value of improvements eased 0.4% (-3.9% y/y) after strengthening 12.7% in November. Multi-family construction rose another 3.1% (5.3% y/y) after three months of strong increase. Nonresidential building activity improved 0.4% (3.8% y/y) after a 1.1% decline. Office construction was unchanged (8.2% y/y) and commercial construction fell 1.0% (-4.5 y/y). Factory sector building rose 1.7% (6.6% y/y).

The value of public construction eased 0.6% (+4.2% y/y). The 6.6% rise during all of last year was the strongest in ten years. (…)

 large image large image

China Cuts Growth Target Amid Challenging Downturn China lowered its economic growth target this year to between 6% and 6.5%, bowing to a deepening slowdown that can’t be quickly arrested without aggravating debt levels that are already high.

(…) Chief among the remedies to prop up growth: increasing deficit spending, launching new tax cuts and other fee reductions for businesses—totaling 2 trillion yuan, or 2% of China’s $13 trillion economy—and boosting bank lending to small and private companies by 30%.

Mr. Li nodded to the “uncertainties of the China-U. S. trade friction” that weigh on growth and the negotiations for a resolution. The economic blueprint he delivered calls for giving foreign investors greater access to China’s markets and allowing foreign firms to enter more sectors without Chinese partners. A new foreign-investment law, he said, will level the playing field between foreign and domestic firms—a central demand of Washington’s. (…)

In recent days, we got reports that Evegrande, China’s largest property developer and one of China’s most indebted company, cut prices 10% across the board to boost sales. Car dealers are also discounting heavily, underscoring the slowdown in consumer sensitive sectors.

“Chongqing consumers stop buying cars when they buy a house. When not buying a house, they buy a car,” an auto dealer said in an interview last week. When the stock market rises, said another dealer of luxury vehicles, so do auto sales. Dealers say that their customers are increasingly strapped for cash. While, back in 2015-16, around 40-50% of auto sales were financed, now, dealers say, the number is 60-70%. (J Capital)

mchi

COMPOSITE PMIs

Business activity across the U.S. service sector continued to improve in February, with the rate of expansion quickening to the fastest since July 2018. The rise in output was supported by a sharp increase in new business and a return to growth in new export orders. Moreover, foreign demand rose at the strongest rate since last May. Subsequently, pressure was placed on capacity and led to the fastest rise in outstanding business for nine months. In expectation of further new order growth and in an effort to clear backlogs, the pace of job creation reached a five-month high and was strong overall. That said, service providers were less upbeat towards the year-ahead outlook for business activity.

The seasonally adjusted final IHS Markit U.S. Services Business Activity Index registered 56.0 in February, up from 54.2 in January and broadly in line with the earlier released ‘flash’ figure of 56.2. The rise in business activity was the quickest since last July and above the long-run series trend. Panellists reported that greater client demand and favourable economic conditions were key driving factors behind the upturn.

image

At the same time, service providers registered a faster increase in new business in February. More robust client demand and the opening of new facilities were commonly mentioned as contributing factors to the latest rise. The expansion was the strongest since last October and historically sharp. Firms also reported a return to growth in new export orders following a two-month sequence of decline. Furthermore, the pace of increase was the fastest for nine months and well above the series average.

In line with a stronger rise in new business, firms were required to take on more staff in February amid strains on capacity. The rate of job creation was the quickest for five months and accelerated significantly from that seen in January. At the same time, backlogs of work increased for the second successive month and to the greatest extent since May 2018.

Meanwhile, inflationary pressures picked up in February, with service providers registering faster rises in both input and output charges. The strong increase in cost burdens was largely linked to higher raw material and fuel prices, tariffs and higher interest rates. The rate of input cost inflation accelerated from January’s 22-month low and was the quickest since last November. Firms reportedly sought to pass greater cost burdens on to clients through increased output prices. The rate of charge inflation quickened for the second month running as more favourable demand conditions allowed companies to raise prices.

Service sector firms remained optimistic in February. The degree of confidence was, however, weaker than that seen in January and historically subdued. Although service providers commented on the strength of client demand, others highlighted concerns around the sustainability of new business growth.

The Composite PMI Output Index registered 55.5 in February, up from 54.4 in January. The faster overall expansion was driven by a quicker upturn in business activity in the service sector, counteracting the slowdown in manufacturing output. Similarly, composite new business increased at the strongest rate for four months amid a quicker rise in new orders at service providers. Manufacturing firms registered a slower rise in new business. Nevertheless, new export orders received by both manufacturing and service sector firms picked up in February, with service providers registering a return to growth in foreign demand.

image

Inflationary pressures were relatively subdued in February compared to those seen throughout 2018. Rates of input price and output charge inflation were strong overall and accelerated from those seen in January. Meanwhile, a quicker overall output expansion led firms to increase their workforce numbers at a more robust rate. The pace of job creation was the strongest since September 2018.

A slight reduction in optimism across both the manufacturing and service sectors resulted in a lower degree of overall confidence towards future output in February.

Chris Williamson, Chief Business Economist at IHS Markit:

The US PMI surveys tell a tale of two economies in February, with any slowdown story confined to the goods-producing sector. While manufacturing struggled, with the surveys consistent with a near stalling of factory output and order books, the service sector remained encouragingly resilient, enjoying its strongest burst of activity for seven months.

With the size of the vast service sector overshadowing the manufacturing sector, the two surveys suggest the overall pace of economic growth accelerated in February. Having correctly indicated that the economy grew at a slower but still solid pace in the fourth quarter (our model from the survey indicated 2.5% growth against an initial official estimate of 2.6%), the data for the first two months of 2019 point to a similar 2.6% annualised rate of expansion.

In addition to signalling stronger economic growth, the surveys suggest hiring also remained encouragingly solid in February with a 250,000 non-farm payroll rise indicated, albeit predominantly driven by the service sector. (…)

image

GDP growth of 2.6% would be at the top end of consensus and substantially above the Atlanta Fed current reading which is based on recent official data releases. If so, it would mean that we will get significant revisions in official data in coming weeks. If I have to choose, I go with the PMI surveys.

image

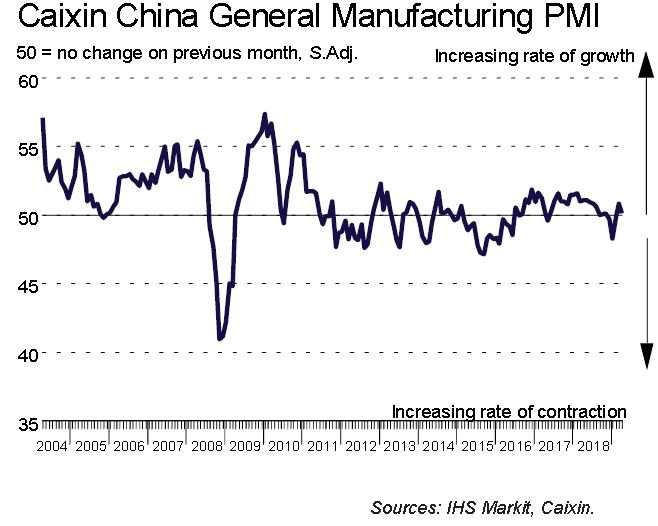
The Caixin China Composite PMI™ data indicated a softer rise in Chinese business activity during February. At 50.7, down from 50.9 at the start of 2019, the Composite Output Index pointed to a marginal expansion of output that was the slowest in four months. (…)

The slowdown was largely centred on the services sector, which registered the softest increase in business activity since last October. Notably, the seasonally adjusted Chinese Services Business Activity Index posted 51.1, down from 53.6, to signal a marginal rate of growth that was weaker than the long-run trend. Manufacturing production meanwhile returned to expansion in February, though the rate of increase was fractional overall.

image

The relatively subdued rise in services activity coincided with a slower increase in new business in February. Notably, service providers signalled the least marked expansion of new orders since last October amid some reports of relatively muted demand conditions. In the manufacturing sector, new orders rose for the first time in three months, albeit only slightly. At the composite level, new business expanded at a slightly faster, but still marginal, pace during February.

The trend in exports meanwhile deteriorated midway through the first quarter of 2019. Overall, foreign sales declined marginally, driven by a renewed fall at manufacturing companies. At the same time, new export order growth eased to a five-month low at services companies.

Employment trends continued to differ by sector, with services companies registering the fifth successive monthly rise in staffing levels as manufacturers continued to scale back their workforce numbers. That said, the latest expansion of service sector payrolls was only marginal, having eased since the start of the year. At the same time, goods producers saw a slightly quicker rate of job shedding compared to January. As a result, composite employment fell back into contractionary territory in February.

Services companies in China signalled lower backlogs of work for the second month in a row during February. Though moderate, the rate of depletion was the quickest seen since September 2015, with some firms citing greater efforts to clear incomplete orders. In contrast, outstanding workloads continued to increase modestly across the manufacturing sector. Nonetheless, the steeper reduction in the level of work-in-hand at service providers underpinned the first fall in unfinished business at the composite level for three years.

Operating expenses faced by services firms continued to rise in February. The rate of increase quickened slightly since the start of the year, by remained modest overall. Meanwhile, average purchasing costs for manufacturers declined for the third consecutive month, albeit only slightly. At the composite level, input cost inflation picked up from January’s three-year low and was moderate.

February data showed that both manufacturers and service providers raised their output prices only slightly. That said, it marked the first increase in factory gate prices for four months. Where higher selling prices were reported, panellists generally linked this to firmer overall demand conditions.

Chinese companies continue to expect activity to increase over the next year in February. Optimism was widely linked to new products, company expansion plans, greater investment and expectations that overall market conditions will improve. However, the level of positive sentiment softened since January, with confidence easing slightly across both the manufacturing and service sectors.

February’s IHS Markit Eurozone PMI® Composite Output Index indicated firmer growth of the eurozone’s private sector economy when compared to January. The seasonally adjusted index strengthened to 51.9, up from 51.0 and a three month high. Moreover, the index improved on the earlier February flash reading of 51.4.

image

Underlying trends in activity generally strengthened across the region during February with the exception of Spain, where growth softened slightly compared to January. Disparate trends also persisted, with Ireland expanding markedly compared to continued contraction in Italy. France saw a return to marginal growth, whilst output in Germany rose at a solid and strengthened rate.

There remained a notable divergence between the performances of the manufacturing and service sectors during February. On the one hand, ongoing trade tensions, weakness in the automotive industry and political uncertainties continued to weigh on demand for manufactured goods. Manufacturing new orders deteriorated to the greatest degree in nearly six years during February, placing downward pressure on output which fell slightly for the first time in nearly six years.

In contrast, service providers registered modest but nonetheless improved growth in activity when compared to January. The trend in services new work was also favorable, with the sector registering a firmer rise in sales. Growth merely offset the decline in manufacturing orders, however, to leave overall private sector new work unmoved on the month.

imageIn spite of the underwhelming trend in new business, private sector companies in the euro area again chose to take on additional workers. Growth remained solid, improving on January and extending the current period of expansion to well over four years. Germany, Ireland and Spain all continued to record robust gains in employment, compared to a relatively modest gain in France and marginal growth in Italy. With capacity levels continuing to expand, private sector companies were again able to comfortably keep on top of their workloads. Backlogs of work were stable during February.

Despite evidence of rising wage pressures, especially in Germany, Ireland and Spain, overall cost pressures continued to weaken. Thanks to noticeably slower inflation in manufacturing, overall input costs rose to the weakest degree for a year-and-a-half. A similar trend emerged for output charges, which increased in February at the slowest pace since September 2017.

Finally, business confidence improved during February to a five-month high, though nonetheless remained amongst the weakest recorded for the past four years. Political and economic uncertainties continue to weigh on sentiment.

The IHS Markit Eurozone PMI® Services Business Activity Index remained above the crucial 50.0 no-change mark in February, rising to 52.8, from 51.2 in January and a three-month high. All countries recorded growth in activity, albeit to varying degrees. Whilst France and Italy registered marginal gains, activity levels in Germany, Ireland and Spain all rose to robust degrees.

There was an improvement in overall new business growth and, despite being modest, the increase in sales was sufficiently strong to place pressure on capacity. Backlogs of work increased during February following January’s decline, with Germany and Ireland recording the most acute increases in outstanding business. These two nations also recorded the strongest employment gains during the latest survey period. Overall, private service sector jobs in the euro area rose at a marked and accelerated rate during February.

With demand for workers continuing to increase, there were many reports of higher salaries being paid. This helped to explain another sharp increase in overall service sector operating costs. Where possible, firms sought to protect margins via a solid increase in output charges.

Finally, business confidence improved in February to its highest level in four months, though remained below its trend level.

Chris Williamson, Chief Business Economist at IHS Markit:

Measured overall, the survey shows the quarterly rate of GDP growth picking up to 0.2% in February from 0.1% in January, meaning the first quarter could see the eurozone economy struggle to beat the 0.2% expansion seen in the fourth quarter of last year.

Manufacturing remains especially fragile, with an increased rate of decline of new orders and signs of excess capacity relative to sales boding ill for future production. While the service sector is showing greater resilience, inflows of new business remained worryingly weak, providing little hope for any noticeable improvement in performance in the coming months. (…)

TRADE STUFF
China suspends customs clearance for Tesla Model 3 imports: Caixin

China’s customs authority has suspended customs clearance procedures for Model 3 cars built by Tesla Inc, the financial publication Caixin reported on Tuesday. The report said the customs authority in Shanghai had found various irregularities in 1,600 imported Model 3 cars, including the improper labeling of the vehicles. (…)

China says Canadian stole secrets; Huawei to sue U.S. China’s government and its leading smartphone maker, Huawei Technologies Ltd, stepped up pressure on Monday on the U.S. and Canadian governments in a dispute over trade and telecoms technology that has ensnared Huawei’s CFO, who faces U.S. criminal charges.

China blocks canola shipments from Canadian company as tensions mount

Trump Attacks India on Trade as U.S. Seeks Its Help on China

The Trump administration notified Congress on Monday that it wants to scrap trade concessions for India [and Turkey], the largest beneficiary of the so-called generalized system of preferences that impacts $5.7 billion worth of goods.

The move affects just a fraction of India’s trade flows, yet it comes weeks before India’s national elections, and just as Prime Minister Narendra Modi’s government is trumpeting its foreign policy prowess and military strength following a stand-off with Pakistan. (…)

U.S. Push on Food Trade Pressures EU U.S. and European trade negotiators, under growing domestic pressure over agriculture, are set to meet again this week as clashing demands threaten to rekindle a tit-for-tat economic war.
Macron lays out proposals for a more ‘protective’ EU French president calls for ‘renaissance’ in Europe to fend off ’nationalists’

(…) “Never since the second world war has Europe been so necessary,” he wrote in an address to the “citizens of Europe” to be published on the opinion pages of multiple newspapers on Tuesday. “And yet Europe has never been so much in danger.” (…)

Evidence Grows That Trump’s Trade Wars Are Hitting U.S. Economy

In two separate papers published over the weekend, some of the world’s leading trade economists declared Trump’s tariffs to be the most consequential trade experiment seen since the 1930 Smoot-Hawley tariffs blamed for worsening the Great Depression. They also found the initial cost of Trump’s duties to the U.S. economy was in the billions and being borne largely by American consumers.

In a study published on Saturday, economists from the Federal Reserve Bank of New York, Princeton University and Columbia University found that tariffs imposed last year by Trump on products ranging from washing machines and steel to some $250 billion in Chinese imports were costing U.S. companies and consumers $3 billion a month in additional tax costs and companies a further $1.4 billion in deadweight losses. They also were causing the diversion of $165 billion a year in trade leading to significant costs for companies having to reorganize supply chains.

Significantly, the analysis of import price data by Mary Amiti, Stephen Redding and David Weinstein also found that almost all of the cost of the tariffs was being paid by U.S. consumers and companies. That contradicts Trump’s claim that China is paying the tariffs. (…)

In a separate paper published on Sunday four economists including Pinelopi Goldberg, the World Bank’s chief economist and a former editor-in-chief of the prestigious American Economic Review, put the annual losses from the higher cost of imports alone for the U.S. economy at $68.8 billion, or almost 0.4 percent of gross domestic product.

That was offset by the gains from protectionism derived by U.S. producers benefiting from the tariffs, the economists found. After accounting for the impact of higher tariff revenue and the benefits of higher prices to domestic producers the study found the aggregate annual loss for the U.S. economy fell to $6.4 billion, or 0.03 percent of GDP. (…)

Economists at the Institute of International Finance last week calculated Chinese retaliatory tariffs alone were causing roughly $40 billion a year in lost U.S. exports. (…)

TECHNICALS WATCH

From Nautilus Capital:

  • Breadth has Surged. Recall that over 90% of stocks in the SP500 exceed their 50 DMA. February 15th marked the first time for this trigger in 6 months. Since 1991, the SP500 has averaged gains of +20% 1-year later. (10 up vs. 0 down.)
  • The SP500 just registered a statistically significant Bullish Long-term Trend Following Signal. When the 1-month moving average closes above the 12-month moving average after below for 3 months, returns since 1958 average + 17.42% 1 year later. (16 up vs. 0 down.) Since 1927, the same signal generates a 1-year return that averages +14.96% (22 up vs. 5 down.)

The S&P 500 remains stuck at 2800…

spy

…but the equal weighted index has gone through its resistance…or has it really?

rsp

THE DAILY EDGE: 4 MARCH 2019

U.S., China Close In on Trade Deal China and the U.S. are close to completing a trade deal, though hurdles remain. Both countries could lift some tariffs imposed last year, and Beijing would agree to ease restrictions on American products.

(…) Despite the remaining hurdles, the talks have progressed to the extent that a formal agreement could be reached at a summit between President Trump and Chinese President Xi Jinping, probably around March 27, after Mr. Xi finishes a trip to Italy and France, individuals with knowledge of the plans said.

As part of a deal, China is pledging to help level the playing field, including speeding up the timetable for removing foreign-ownership limitations on car ventures and reducing tariffs on imported vehicles to below the current auto tariff of 15%.

Beijing would also step up purchases of U.S. goods—a tactic designed to appeal to President Trump, who campaigned on closing the bilateral trade deficit with China. (…)

There has been less progress on other issues dividing the two nations, especially China’s industrial policies and subsidies. Beijing considers that support crucial to its state-led development plan and maintaining the Communist Party’s rule. (…)

The U.S. and China are close to a trade deal that could lift most or all U.S. tariffs as long as Beijing follows through on pledges ranging from better protecting intellectual-property rights to buying a significant amount of American products, two people familiar with the discussions said. (…)

One of the remaining sticking points is whether the tariffs would be lifted immediately or over a period of time to allow the U.S. to monitor whether China is meeting its obligations, the people said. (…)

U.S. RETAIL SALES

The important debate on the hugely weak December retail sales continues. Bearish David Rosenberg highlights the most recent SpendTrend retail sales figures for February showing a weak 0.9% YoY growth rate. SpendTrend data is based on aggregate card-based same-store sales activity across First Data’s network of more than 1.3 million U.S. merchants. But SpendTrend data were up 6.2% YoY between October 28 and January 1, the best showing in four years, totally different from the official retail sales data.

We will get earnings reports from many retailers this week, hopefully with some sense of the current state of the consumer.

Consumer expenditures are nearly 70% of the economy. Housing is not particularly strong these days, nor are exports. And now, manufacturing seems to be entering a soft patch per these Markit charts:

 unnamed (14) unnamed (15)
Demographics: Renting vs. Owning

This is from CalculatedRisk’s Bill McBride:

(…) The move “from owning to renting” is over, and demographics for apartments are much less favorable than 8 years ago.  Also much more supply has come online.  Slowing demand and more supply for apartments is why multi-family starts have slowed recently (multi-family starts probably peaked in 2015).

On demographics, a large cohort had been moving into the 20 to 29 year old age group (a key age group for renters).  Going forward, a large cohort is moving into the 30 to 39 age group (a key for ownership). (…)

Russia Cuts February Output Deeper to Comply With OPEC Pact

The country produced 43.3 million tons of oil last month, according to preliminary data from the Energy Ministry’s CDU-TEK unit. That’s equivalent to 11.336 million barrels a day, down 82,000 barrels per day from the October baseline of the OPEC+ deal, Bloomberg calculations show.

Russia’s Energy Ministry earlier this week said February output was 97,000 barrels a day lower than in October. Bloomberg’s calculation of the country’s cuts also differed from official figures in January. The difference may be explained by the methodology, as the ministry uses an individual conversion ratio from tons to barrels for each field, while Bloomberg uses a unified ratio of 7.33 barrels a ton.

The nation curtailed its January supply by about 47,000 barrels a day from the baseline, according to the Energy Ministry. Russia pledged to gradually implement a 228,000 barrel-a-day reduction and maintain it until the end of the first half. (…)

Source: @markets; Read full article

TECHNICALS WATCH
The Dow Just Had Its Best Two Months in Years — and There Could Be More to Come

Thumbs up (…) “Although the rate of change in high-frequency indicators makes an unequivocal case for a slowdown, the level of said indicators refutes the idea of a hard landing, at least so far,” he writes. “The level of the ISM New Orders Index remains consistent with ongoing growth in earnings estimates and capital spending.”

There are also signs that the Fed, simply by taking a breather, has eased monetary conditions. The evidence: The yield curve is steepening. The difference between 30-year and two-year Treasury yields—the spread most correlated to money supply—has risen to about 0.6 percentage point, the highest since June, Darda observes, while the market has started pricing in more inflation. “It is becoming clear that the Fed has actually ‘eased’ monetary policy to some degree given the FOMC’s forward-looking January ‘pivot,’ which should reduce hard landing risk,” he explains.

Thumbs down The market isn’t risk-free, however. Deltec’s Rogers, for one, sees continued weakness in economic data from China and Europe, trade hopes baked into stocks, and very little earnings support for the stock market in the U.S., where the S&P 500 trades at 16.4 times earnings. “We think from here there’s little upside, so we would not chase equities,” he says.

This pretty good chart from CMG Wealth also suggests there could be more to come:

13/34Week EMA Trend Chart

CMG Wealth’s Steve Blumenthal also watches the 200-day moving average. A sell signal occurred recently when the 200-day MA price line dropped from its high point by 0.5%.  But a buy signal will occur if the 200dma price line rises from its 2738.1 low point by 0.5% or more. This would be at 2751.8, 0.17% above its current level.

Meanwhile, the Nasdaq has effectively reversed its similar bearish signal when its 200dma exceeded 7061 on February 25. Ned Davis Research data says that, since 1973, the NDX has risen 74% of the time averaging 12.7% per annum when its 200dma was rising.

The S&P 500 is bumping against its recent 2800 recovery highs with many investors still hurt by the 16% cliff that followed the December 3 failure.

spy

Lowry’s Research reminds us that its Demand vs Supply data was showing steady rising Supply and weakening Demand prior to December 2018. Selling Pressure has been declining since early January while “Buying Power rose to its highest point since late August of 2018. On an intermediate-term basis, the trends of contracting Supply and expanding Demand are consistent with a healthy market uptrend. In the short-term, the moderation of these trends suggests a near-term market consolidation is more likely.”

BTW, equity markets outside the U.S. have broken their one-year downtrend and are now bumping against their still declining 200dma.

acwx

EARNINGS WATCH

A consolidation phase is also likely for the Rule of 20 Fair Value as trailing earnings are expected to flatten during the next 6 months based on Q1 and Q2 estimates for 2019.

With trailing EPS of $162.86 and 2.2% inflation, the Rule of 20 Fair Value is 2899, 3.4% above the last close. If estimates per Refinitiv’s data are met, trailing EPS will not rise much until Q3 or Q4 of this year and only lower inflation would positively impact Fair Value (every 0.1% decline in the inflation rate would increase Fair value by 0.55%).

Analysts are relentlessly revising their estimates downward and corporate preannouncements are not helping reverse the trend.

imageimageimage

First 2 Months of QTr

Q1’19 earnings are seen down 1.1% (-0.4% ex-Energy). Q2 and Q3 estimates are +3.2% (+4.0%) and +2.9% (+4.3%) respectively while Q4 is still expected to show good growth at +9.3% (+10.7%) primarily because of an expected 20% rebound in Financials’ earnings as Financials’ trading revenues should (?) recover from the very weak Q4 just passed.

As Ed Yardeni illustrates, Financials are selling at low historical multiples and PEG ratios…

image

…having substantially lagged the S&P 500 Index during this cycle…

xlf

…because Financials’ earnings have substantially lagged due to their inability to bring margins back even near pre-crisis levels…

image

…in part because of compressed lending margins…

image

China’s Stock Market Isn’t Quite The Bargain It Seems

The broad Chinese market trades at just 14 times forecast earnings for the next 12 months, according to a FactSet index of more than 3,000 stocks. That is roughly 17% below its 10-year average of 16.8 times, despite a blistering rally in Chinese stocks over the first two months of this year.

On other gauges, the country looks even cheaper: The MSCI China A Onshore Index, which includes large- and mid-capitalization stocks in Shanghai and Shenzhen, had a price-to-earnings ratio of just 10 times at the end of January. (…)

However, headline figures tell only part of the story. The consumer non-durables segment of the FactSet index, which includes liquor maker Kweichow Moutai, trades at 20.9 times forward earnings, while technology-services companies trade at 29.4 times. These are some of the companies foreign investors most want to own as Chinese consumers become a bigger economic driver.

Meanwhile, financial firms trade at just 7.4 times forward earnings, making that segment the cheapest of FactSet’s China index. The country’s banks have large stacks of nonperforming loans. (…)

The banks matter because they make up big chunks of many indexes: They and other financial institutions account for 35% of the Shanghai Composite, and 31% of the MSCI China A Onshore Index.

Avoid the Crowds in Chinese Stocks (AllianceBernstein L.P.)

After MSCI decided [last week] to boost the allocation to Chinese onshore stocks in its emerging-market indices, global investors are likely to pump more money into the market. But watch out for crowds. Flows into China are concentrated in a small group of large-cap stocks. (…)

Our research suggests that foreign inflows through the Stock Connect channel are concentrated in a small number of Chinese stocks, mostly large caps ( Display ). In fact, only 117 Chinese A-shares have foreign ownership of more than 5%, while 1,480 stocks have foreign ownership of less than 5%. Those 1,480 stocks include many small- and mid-cap names that may be less familiar to foreign investors.

There are many good long-term investment opportunities in large-cap Chinese stocks. But naively following crowds can be risky, if sentiment and momentum toward popular positions reverse. We believe the Chinese market offers a world of opportunities in a diverse set of companies that are off the beaten path. International investors seeking to take advantage of China’s newly opened markets should make sure their asset managers have strong local knowledge of companies and industries as well as the capabilities and skill to capture the potential that’s being overlooked by the masses.

Should Stock Buybacks Be Banned? (Ed Yardeni)

Good analysis by Ed Yardeni.